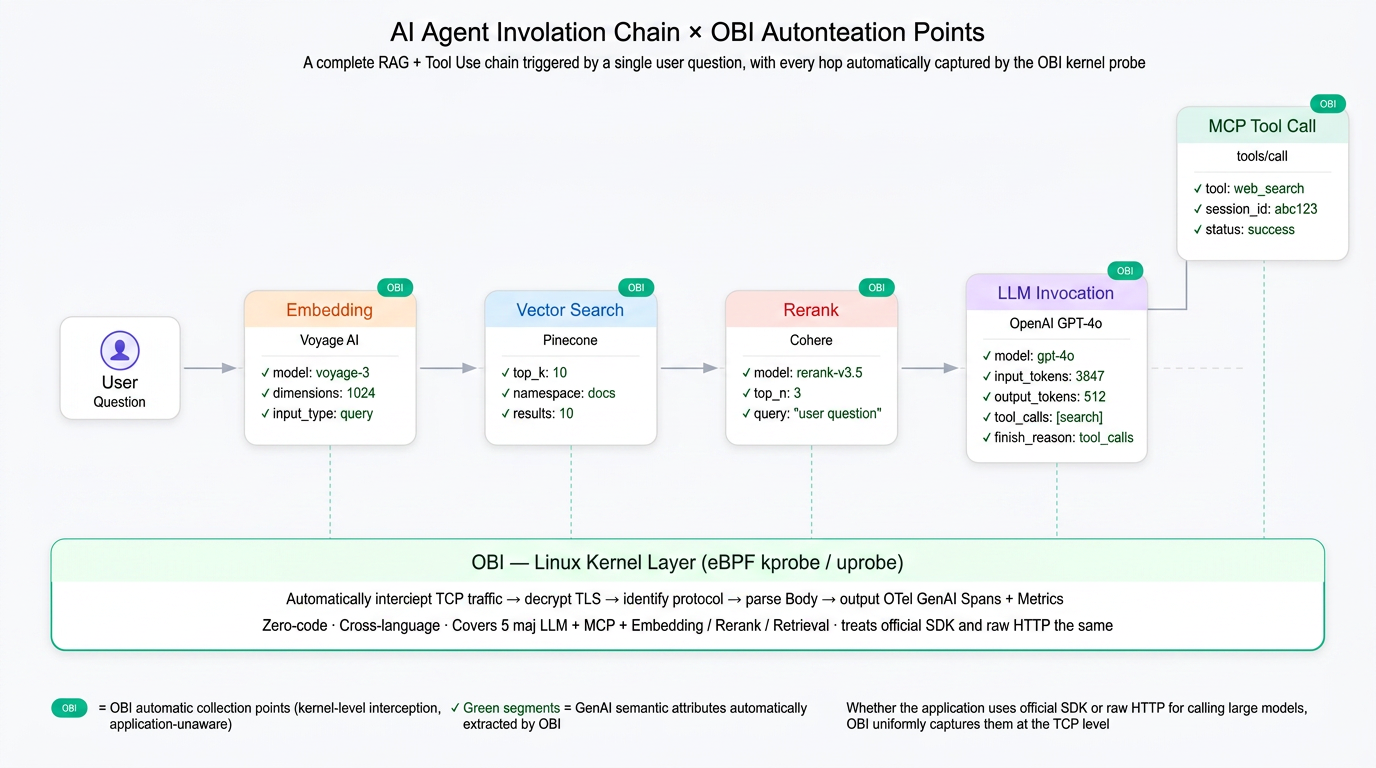
When an AI agent receives a user query, it first calls an embedding model to vectorize the query, then initiates a Top-K retrieval to Pinecone, followed by a reranking process. After that, it calls GPT-4o with the context. During this time, GPT-4o might also invoke external tools via the MCP protocol. This entire chain spans five protocols and three cloud providers. When a user complains that "the answer is wrong," developers are faced with a crime scene but have no surveillance footage to investigate.
Traditional APM can tell you "an HTTP request took 3 seconds," but it cannot answer "which model was used, how many tokens were consumed, what functions the tool call invoked, or how many results the vector search returned."
The approach of OpenTelemetry eBPF Instrumentation (OBI), on the other hand, is to install a 24/7 forensic camera inside the Linux kernel. Without modifying a single line of business code, it automatically identifies and parses all AI-related network calls, recording the key evidence into OpenTelemetry standard traces and metrics.
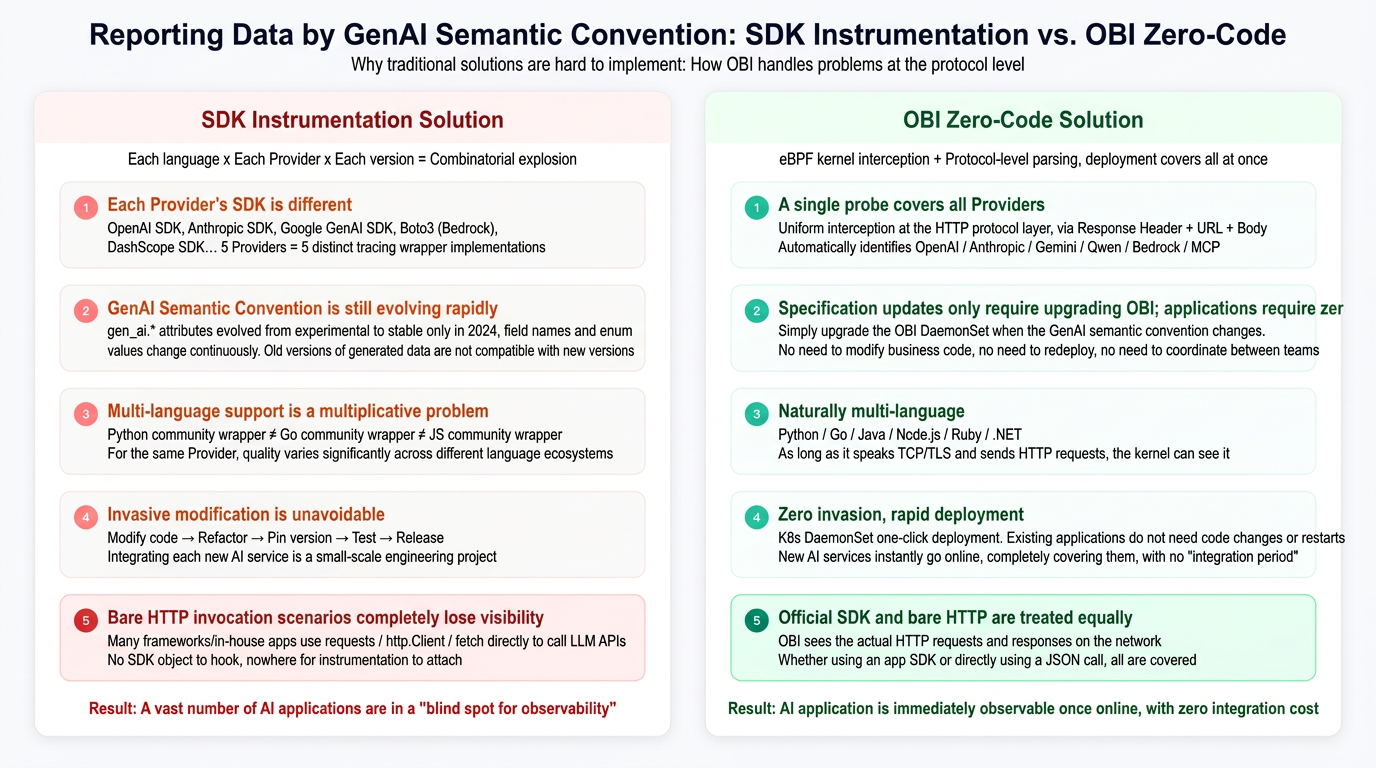
The OpenTelemetry community has defined a set of semantic conventions for GenAI, specifying standard attributes like gen_ai.request.model, gen_ai.usage.input_tokens, and gen_ai.usage.output_tokens. Ideally, all AI applications should report data according to this specification so that calls from different providers can be monitored on a unified dashboard and covered by the same alerting rules.
In reality, however, manually instrumenting business code to meet these standards is an agonizing process:
SDK fragmentation: Every provider's SDK is entirely different. The OpenAI SDK, Anthropic SDK, Google GenAI SDK, Boto3 (Bedrock), and DashScope SDK represent five different API wrappers. Developers must write tracing wrappers for each, extract their respective model, token, and tool_calls fields, and map them to unified GenAI attributes.
Rapid evolution of semantics: The GenAI semantic conventions are still evolving quickly. They only moved from an experimental state to stable in 2024, and field names and enum values are constantly being tweaked. SDK wrapper maintainers have to constantly play catch-up, and data generated by older versions might not be compatible with newer ones.
Multi-language complexity: Adapting for multiple languages is a multiplicative problem. Python's opentelemetry-instrumentation-openai and Go's community wrappers are completely separate projects with different maintainers and varying levels of maturity. Observability support for the same provider can be highly inconsistent across different language ecosystems.
Intrusive modifications: Code changes are unavoidable. You have to modify code -> install packages -> align versions -> retest -> redeploy. Integrating a new AI service becomes a full-blown engineering project, severely slowing down iteration speed.
There is an even more fundamental issue: many AI agents do not even use official SDKs. A lot of frameworks and in-house apps simply use standard HTTP clients like requests, http.Client, or fetch to construct JSON request bodies and call LLM APIs directly. It's lightweight, flexible, and avoids SDK version lock-in. But this also means that all observability solutions based on SDK monkey-patching or wrappers completely fail. There are no SDK objects to hook into, no callbacks to inject, and instrumentation libraries have nowhere to start. For OBI, however, whether you use an official SDK or raw HTTP requests, it all ultimately boils down to HTTP traffic over TCP. What the kernel sees is exactly the same.
The result is that a massive number of AI applications are stuck in an "observability blind spot." It's not that developers don't want to monitor them; it's just that the cost of adopting SDK-based solutions is too high, and raw HTTP scenarios are completely unsupportable by those traditional means.
OBI approaches the problem from a different level: instead of wrapping SDKs provider by provider at the application layer, it uniformly intercepts HTTP traffic at the network layer of the Linux kernel. Through protocol-level parsing, it automatically extracts all the fields required by the GenAI semantic conventions.
This means one set of probes covers all providers. When the specs update, you only need to upgrade the OBI DaemonSet, requiring zero changes to your application. It is inherently cross-language—whether it's Python, Go, Java, or Node.js, they all send HTTP requests over TCP, and the kernel does not care what language the app uses. More importantly, whether the app uses official SDKs or raw HTTP requests, OBI captures them equally. It doesn't look for SDK objects; it looks at the actual HTTP requests and responses flowing through the network.
The following diagram illustrates how OBI automatically sets collection points at every hop in a typical AI agent invocation chain. From embedding, vector retrieval, and reranking to LLM inference and MCP tool calls, all outbound HTTP requests are transparently captured at the kernel layer:
When OBI captures an AI-related HTTP request, it goes through the following processing pipeline—from packet reception at the NIC to finally outputting an OTel Span that complies with GenAI semantic conventions:
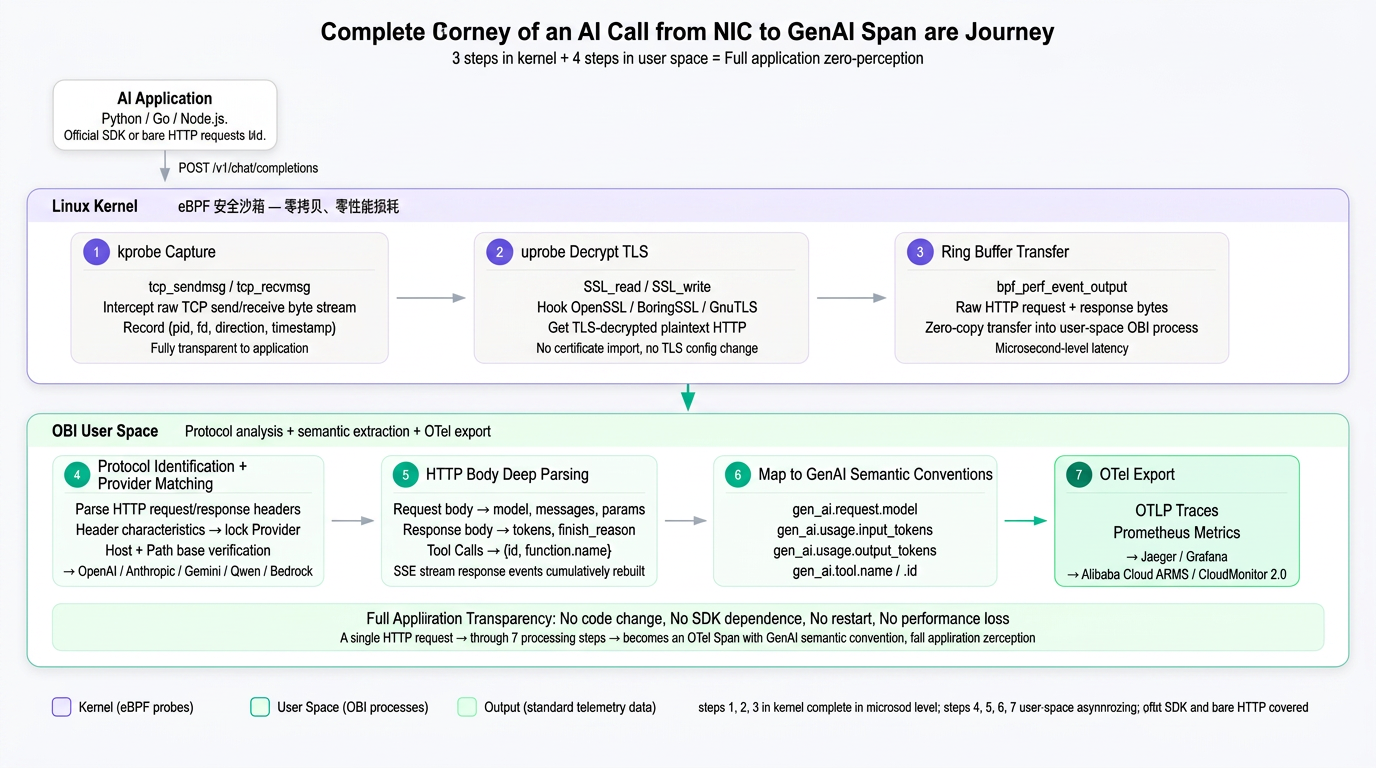
Pushing observability to the kernel sounds great, but it immediately hits a wall: today, all LLM calls run over HTTPS. If you capture packets directly at the NIC or socket layer, all you see is a bunch of encrypted bytes. You can't parse the model or tool_calls, let alone reconstruct an SSE stream. For OBI to gather evidence at the kernel layer, it first had to solve a fundamental problem: how to get plaintext from HTTPS without decrypting private keys.
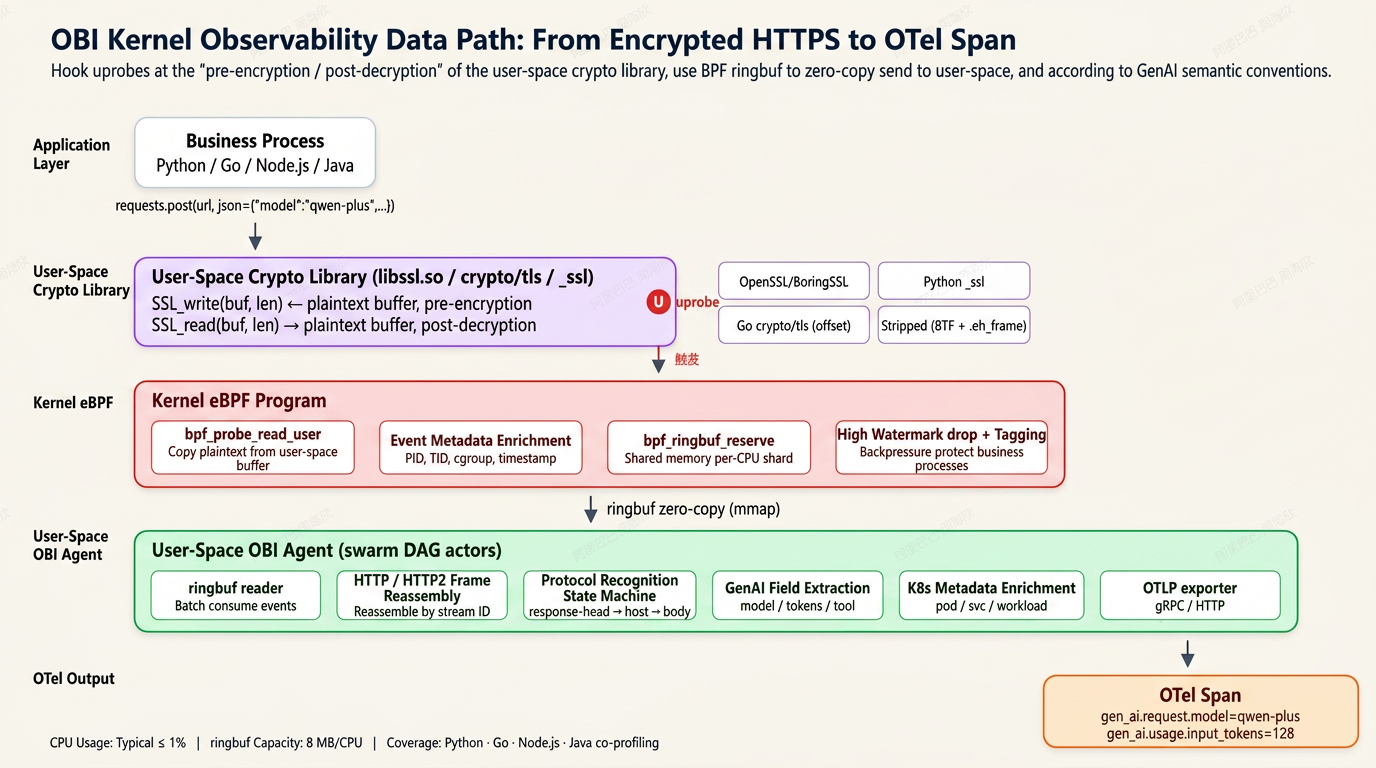
Step 1: Place the probe at the exact line of code before TLS encryption. OBI doesn't touch the ciphertext at the TCP layer. Instead, it hooks (via uprobe) into user-space cryptographic libraries at the exact moment of "pre-encryption/post-decryption." Specifically, it adapts to four types of runtimes:
The key insight here is that encryption happens inside the user-space crypto library. The interface between the application layer and the crypto library is always a plaintext buffer. By hooking this interface, you can get the complete request and response bodies without needing man-in-the-middle certificates or private keys.
Step 2: Move data from kernel to user space with zero-copy. After the uprobe is triggered, the eBPF program needs to pass the captured HTTP plaintext to the user-space OBI agent for protocol parsing. The traditional perf event mechanism requires multiple buffer copies per event, which is an unacceptably high cost for LLM prompts that can easily span tens of kilobytes. OBI uses the BPF ringbuf (introduced in Linux 5.8): the kernel eBPF program allocates space directly in shared memory via bpf_ringbuf_reserve, and writes application data via bpf_probe_read_user in one go. The user-space reader maps the same memory segment via mmap for zero-copy reading. Backpressure is managed by the ringbuf's own watermarks; when the high-water mark is hit, the kernel side drops events and logs metrics, ensuring the business process is unaffected. In multi-CPU scenarios, each CPU gets its own ringbuf slice to avoid lock contention.
Step 3: From HTTP plaintext stream to OTel Span. Once the plaintext enters user space, it goes through a complete parsing pipeline. This involves HTTP/1.1 and HTTP/2 frame reassembly, selecting JSON/SSE/Binary decoders based on the content type (Content-Type), accumulating streaming responses by event, extracting fields mapped to GenAI semantic conventions, enriching them with K8s metadata (pod, namespace, service, workload), and finally outputting an OTLP Span. This entire pipeline runs on the OBI agent's swarm DAG scheduler. Every stage is a horizontally scalable actor, keeping CPU usage stably under 1% for typical single-node workloads.
The following diagram connects these three steps into a complete data path—from the application sending a request, to the uprobe capturing the plaintext, zero-copying via ringbuf, and finally parsing the protocol to output an OTel Span:
Capturing plaintext is only a data-layer victory; the harder part is the correlation layer. A real-world AI agent is almost never a synchronous "one request per thread" model. Python asyncio runs dozens of coroutines concurrently on a single thread, Go uses goroutines to constantly switch context, and Node.js scatters callback chains everywhere. If you simply grouped all calls under the same parent span using traditional PID/TID, the entire trace would be completely tangled.
OBI rebuilds context at the kernel layer for the three mainstream concurrency models. Let's take Python and Go as examples.
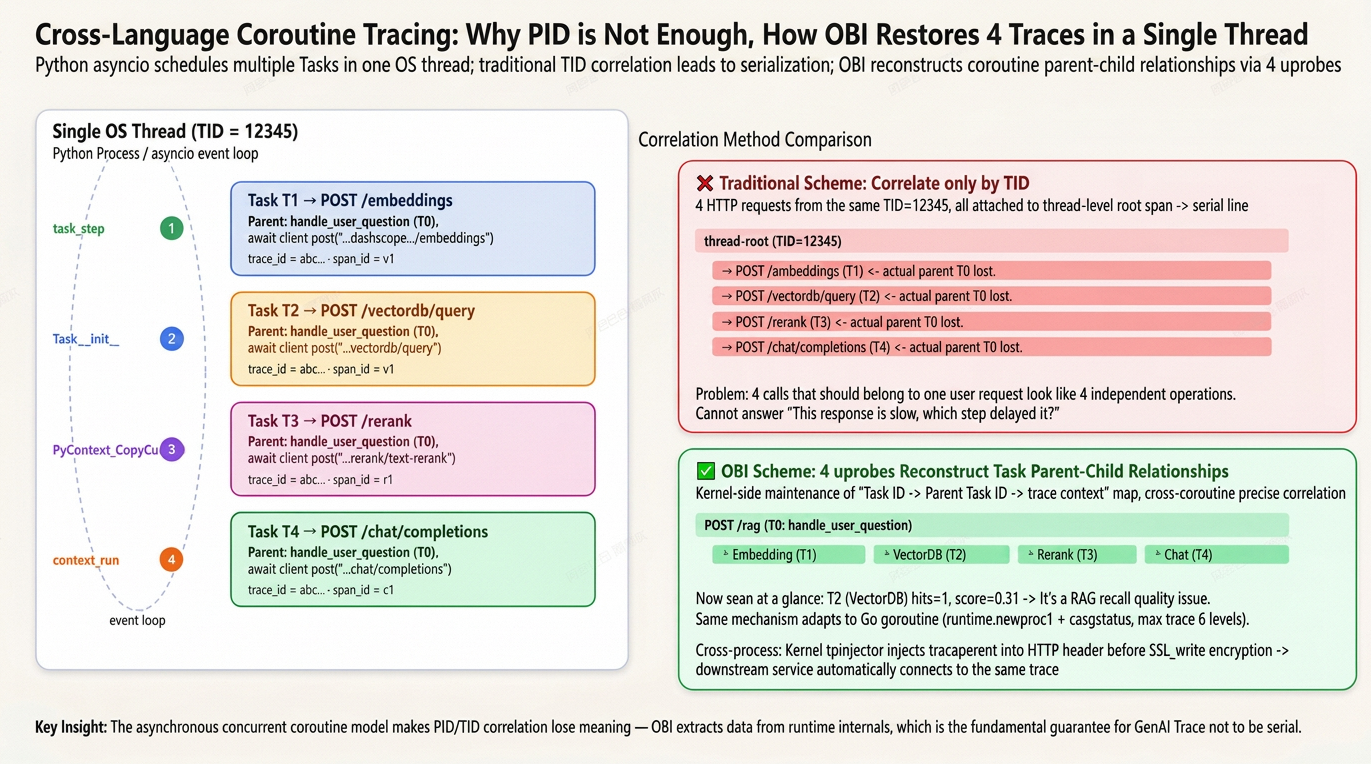
Python asyncio: Reconstructing parent-child relationships with 4 uprobes. CPython's asyncio event loop is a classic example of single-threaded multitasking—all coroutines run on the same OS thread and switch via Task.step(). OBI attaches 4 uprobes to the CPython interpreter, monitoring four critical points in a coroutine's lifecycle:
| uprobe Hook Point | Timing | Extracted Information |
|---|---|---|
| task_step | Coroutine scheduled to execute | Extracts the current Task object pointer, used as the coroutine ID. |
| Task.init | New coroutine created | Extracts parent-child lineage by recording the Task running when this new Task was created. |
| PyContext_CopyCurrent | Context copied | Takes a snapshot of contextvars, used as a data channel between coroutines. |
| context_run | Callback executed in specific context | Extracts the currently active context, linking to the correct coroutine. |
By coordinating these four points, OBI maintains a mapping table in the kernel: coroutine ID -> parent coroutine ID -> current trace context. Even if 10 coroutines are concurrently calling LLMs in a single thread, OBI accurately determines which coroutine initiated each HTTP request and which trace it belongs to.
Go goroutine: Extracting lineage from within the runtime. Go's goroutines are even harder to trace than asyncio. Scheduling is handled by the runtime, it doesn't expose any stable user-space APIs, and even the goroutine ID is intentionally hidden. OBI goes directly for internal Go runtime functions. runtime.newproc1 is the entry point where a parent goroutine forks a child. OBI records the Parent G pointer -> Child G pointer here, establishing a lineage table. runtime.casgstatus handles goroutine state machine switching, which OBI uses to detect when a G is bound to an M (OS thread) or preempted. When an outbound HTTP request triggers, find_parent_goroutine traces up the lineage table for up to 6 levels to find the nearest ancestor goroutine with a trace context—this is the key to rebuilding the Go coroutine chain.
Why 6 levels? The OBI team analyzed real Go applications and found that 6 levels cover 99% of goroutine creation depths. Going deeper usually hits internal framework worker pools, which actually blurs the business context.
Cross-process tracing: Kernel tpinjector injects traceparent. After correlating coroutines within an application, cross-service chaining must be addressed. OBI uses bpf_probe_write_user directly in the kernel on the header section of outbound HTTP requests, injecting a traceparent header into the plaintext buffer right before SSL_write encrypts it. When the downstream service receives it, it goes through a symmetrical decryption process. OBI captures this header at the SSL_read exit, thereby stitching the entire trace across processes, services, and languages. This entire process is completely transparent to the application; even the HTTP client code is unaware that a header was added to its outgoing request.
Performance overhead: How do we achieve <1% CPU usage? This set of mechanisms sounds heavy, but OBI's typical overhead on production clusters is stably under 1% CPU. There are three key reasons: First, uprobe trigger frequency is limited by actual HTTP call rates; unlike kprobes, it won't get overwhelmed by high-frequency system calls. Second, BPF ringbuf batching means the user-space reader wakes up once to consume multiple events, avoiding per-event context switches. Third, protocol parsing happens in user space, not the kernel. The kernel eBPF only does the thinnest "capture buffer + insert into ringbuf" work, offloading complex field extraction to user-space actors, avoiding BPF verifier complexity explosion.
The following diagram illustrates a scenario where 4 concurrent LLM calls run on a single Python asyncio thread. A traditional PID/TID correlation would incorrectly group them all under one parent span. By reconstructing the coroutine context via 4 uprobes, OBI correctly restores the true parent-child relationships of 4 independent traces:
Once the plaintext enters user space, OBI faces an unlabeled stream of HTTP bytes. It needs to determine in milliseconds whether it's OpenAI or Anthropic, Chat or Embedding, RAG retrieval or an MCP tool call, and then extract the GenAI fields according to their respective specs. This decision logic isn't a simple if-else; it's a three-stage state machine. Relying on any single stage alone leads to false positives, but combining all three ensures absolute precision.
Stage 1: response header signatures (highest priority). Every LLM provider leaves unique fingerprints in their response headers:
| Provider | Response Header Fields |
|---|---|
| OpenAI | Openai-Version, Openai-Organization |
| Anthropic | Anthropic-Organization-Id, Anthropic-Ratelimit-* |
| Gemini | X-Gemini-Service-Tier |
| Qwen | X-DashScope-Request-Id |
| Bedrock | X-Amzn-Bedrock-Input-Token-Count (tokens directly in the header) |
Why are response headers the most reliable? Because they are added by the provider and cannot be forged by the application layer. However, this method fails during 4xx/5xx error responses, where many providers switch to a generic error path that lacks these custom headers.
Stage 2: URL host + path two-step verification (fallback). When response headers are missing, OBI falls back to checking the request URL. For example, dashscope.aliyuncs.com + /chat/completions is Qwen, bedrock-runtime.amazonaws.com is Bedrock, and generativelanguage.googleapis.com + /models/ is Gemini. This stage covers scenarios with incomplete response headers, such as error responses or interrupted streaming responses. But looking at the URL alone can be deceiving: many companies use an internal LLM gateway (for unified auth, billing, and rate limiting). All apps might call internal-llm.example.com/v1/chat/completions. The URL looks OpenAI-compatible, but the backend could route to any provider.
Stage 3: request/response body top-level key verification (final verdict). OBI performs a final body check on the identified requests. An LLM call must have the model top-level key + messages or prompt fields. Embedding must have model + input. Rerank must have model + query + documents (matching 2 out of 3 is enough, accommodating slight differences between Cohere, Jina, Voyage, and Qwen). Vector search must hit at least two feature keys (e.g., vector + topK, namespace + includeMetadata) from the key sets of six major vector databases (Pinecone, Qdrant, Milvus, Zilliz, Chroma, Weaviate) to prevent normal KV queries from being misidentified. MCP tool calls require a JSON-RPC 2.0 structure (jsonrpc:"2.0" + method + id) + an MCP method whitelist (tools/call, resources/read, prompts/get, etc.) + an Mcp-Session-Id header; all three layers are indispensable.
By coordinating this three-stage state machine, OBI can accurately identify standard calls with normal responses, error responses, and even internal LLM gateway routing scenarios.
SSE streaming responses: "watching" a conversation inside the kernel. Streaming responses are the trickiest part of LLM interactions. A complete conversation is broken down into dozens or hundreds of SSE events, each carrying just one token fragment. OBI maintains an accumulation buffer in user space indexed by trace ID, rebuilding it event by event. Taking Anthropic streaming as an example: message_start creates the session context, content_block_start opens a content block, content_block_delta appends tokens, message_delta carries the final usage, and finally, it outputs an OTel Span that is fully equivalent to a non-streaming API call. This is why OBI can accurately calculate input/output tokens in streaming scenarios—it doesn't "guess" at the end of the request; it accumulates them in real-time, event by event.
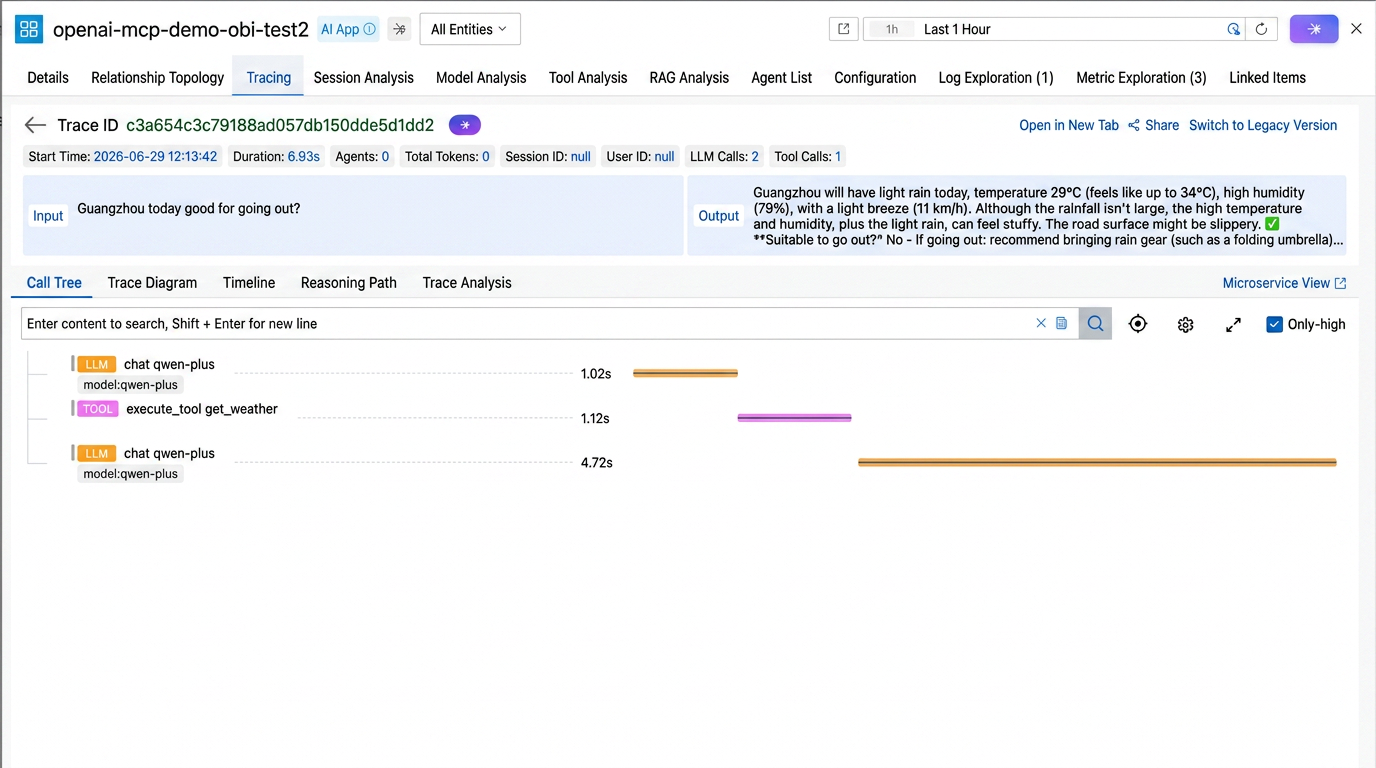
MCP tracking. MCP is the new standard for AI agents invoking external tools. The traffic is standard HTTP + JSON-RPC 2.0. OBI accurately identifies MCP calls via a three-layer disambiguation: the Mcp-Session-Id header + method whitelist + protocolVersion. Once confirmed, it extracts semantic information based on the method type: tools/call extracts the tool name, parameters, and return values; resources/read extracts the resource URI; prompts/get extracts the template name. All this information is linked to the same trace via the session ID.
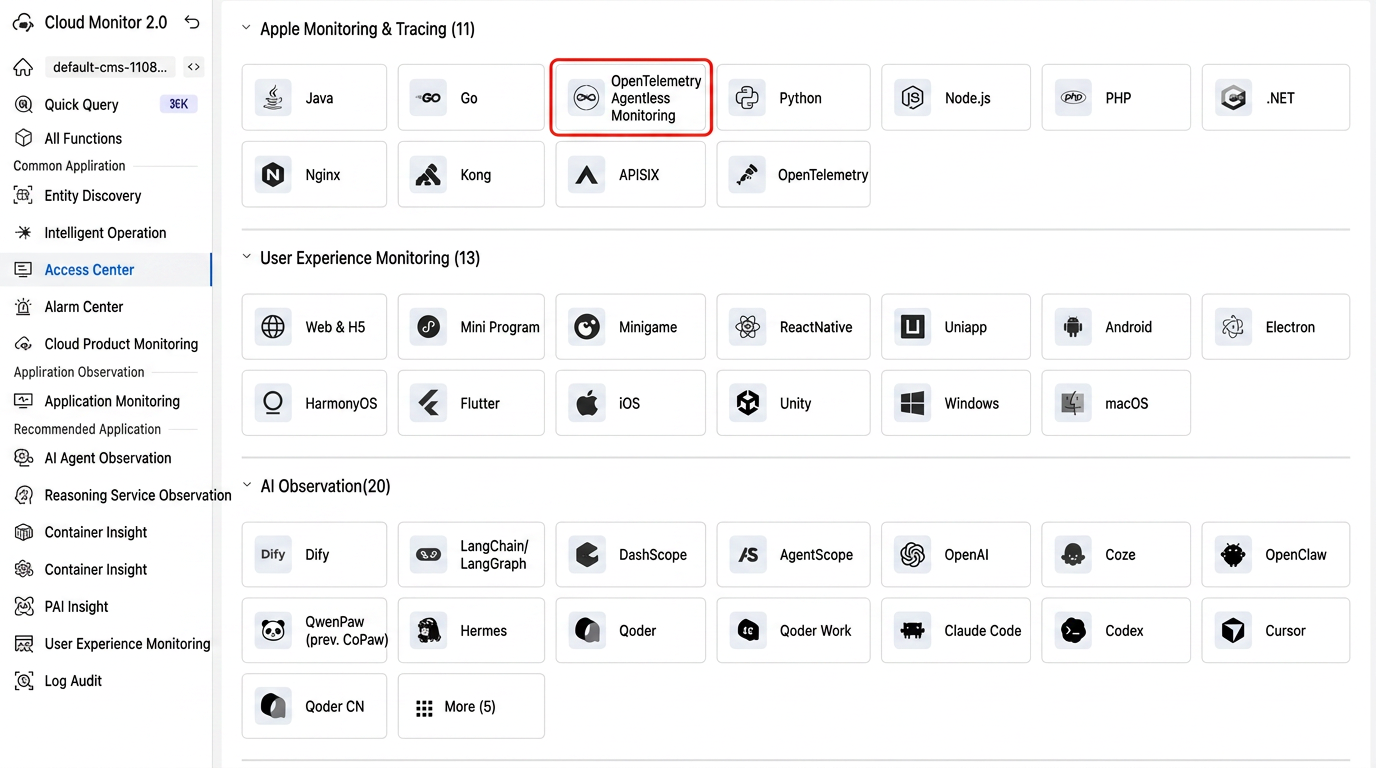
You can integrate your AI agents with a single click via the Cloud Monitor 2.0 Integration Center [1]. Once integrated, you can locate your application in the AI Agent Observability dashboard and view AI-related monitoring data:
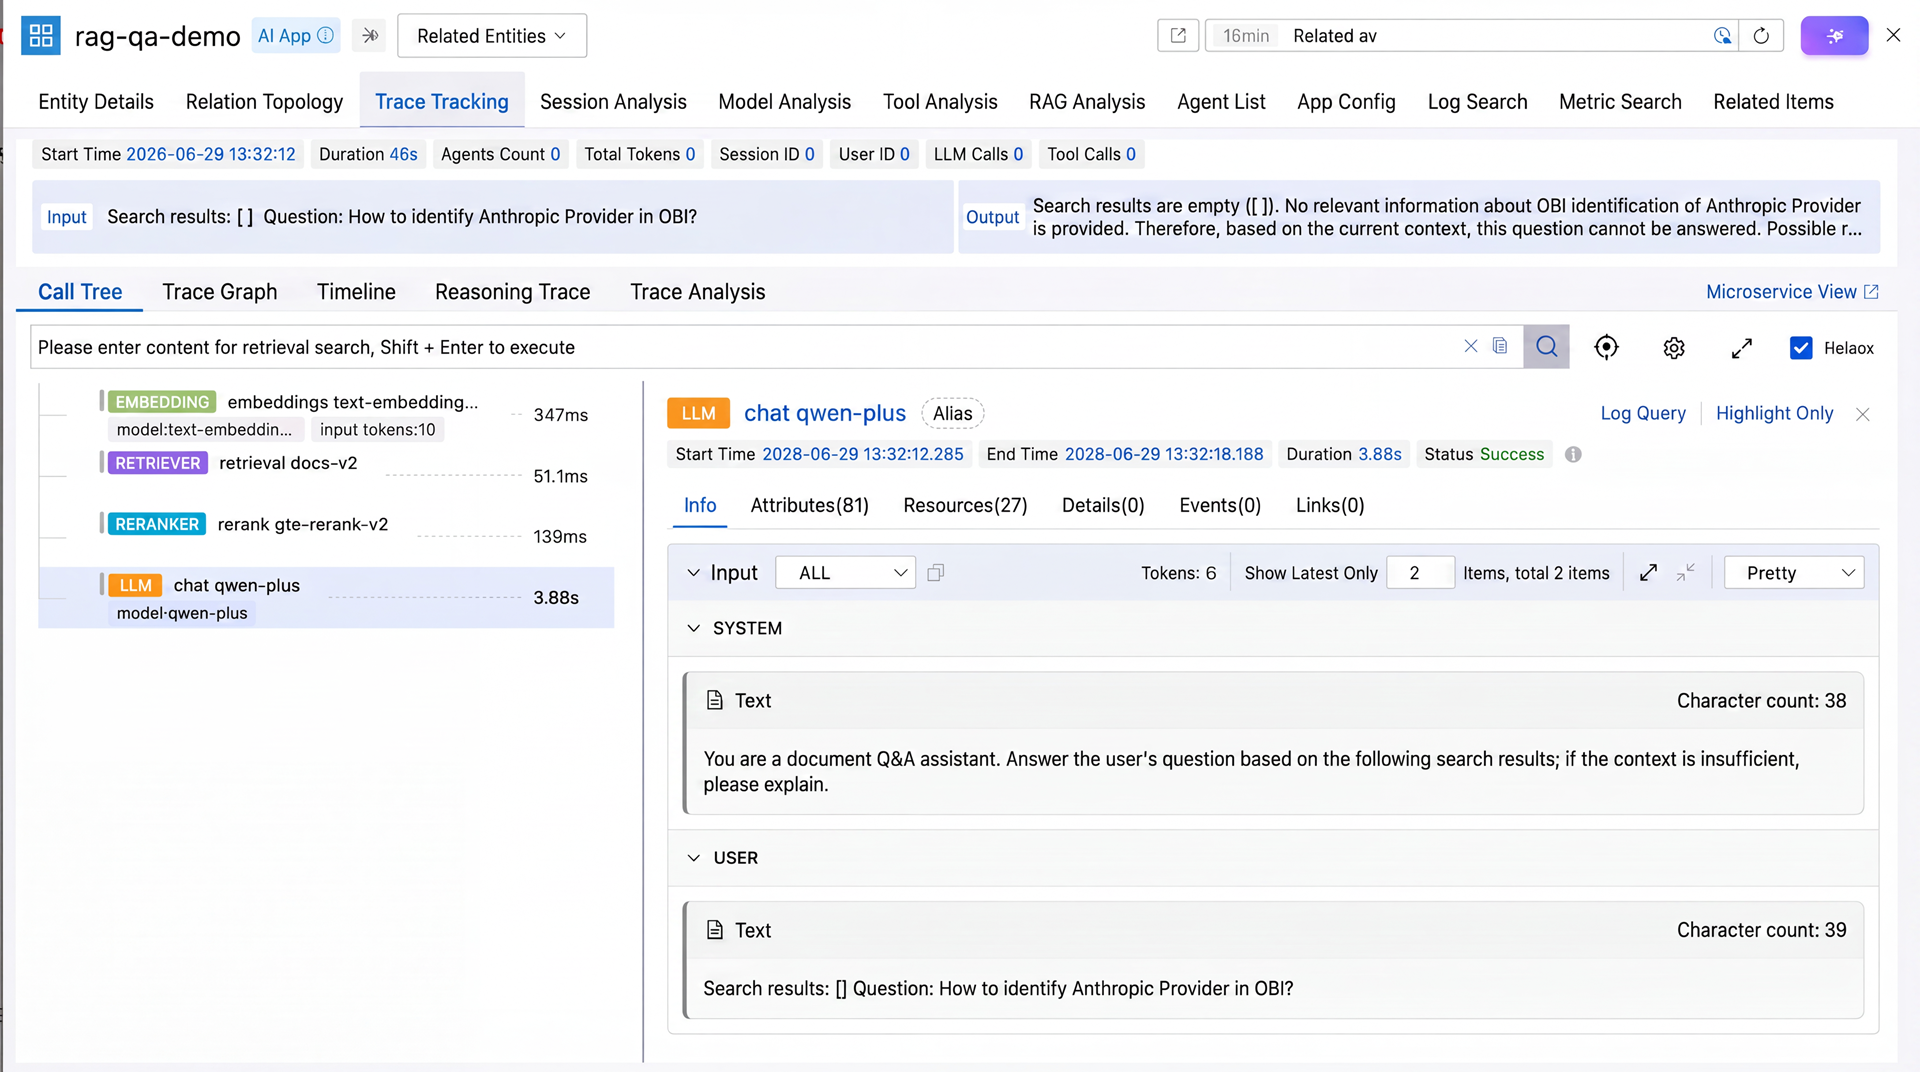
Collecting comprehensive data is only the first step. The key is whether you can pinpoint issues before users complain. The following three scenarios are typical cases collected during actual deployments, corresponding to the three types of issues OBI is most often used to "crack": recall quality, token costs, and blind spots in proprietary, self-developed apps.
A week after launching a document QA agent, users reported it was "often making things up." Developers checked APM logs and only saw a /chat/completions call taking 2.8 seconds with a status code 200. Beyond that, there were no clues—the model, vector database, and reranking were all black boxes.
OBI's RAG analysis view unfolded the entire trace: the embedding span showed the query used text-embedding-3-small. The subsequent Pinecone span revealed Top-K=5, namespace=docs-v2, hits=1, and highest score=0.31. The reranking span showed the order remained unchanged. Connecting these three pieces of data instantly pinpointed the problem: it wasn't a model hallucination. The vector database namespace was misspelled; the new version of the documents wasn't pointing to this index. The entire troubleshooting process took less than a minute. In the past, relying on added logs and binary searches would have taken at least half a day.
A business unit received their Bedrock bill at the beginning of the month: input tokens had spiked by 320% year-over-year. Developers faced dozens of microservices and several agents, and no one could say which piece of code was burning cash. Traditional APM doesn't expose token fields at all, and even if SDKs were instrumented, the data would be scattered across application logs and impossible to aggregate.
OBI aggregated all LLM calls on a dashboard by gen_ai.request.model + service.name + gen_ai.usage.input_tokens. In 30 seconds, the anomaly was locked down: an internal knowledge base agent averaged 80,000 input tokens per call—40 times higher than other apps in the cluster. Drilling down into the model call details to view the specific prompt revealed that a developer, trying to "improve accuracy," was stuffing entire PDFs directly into the system message, sending them repeatedly with every conversation turn. OBI caught this detail at the kernel layer, requiring zero cooperation from the business team to change code or add instrumentation.
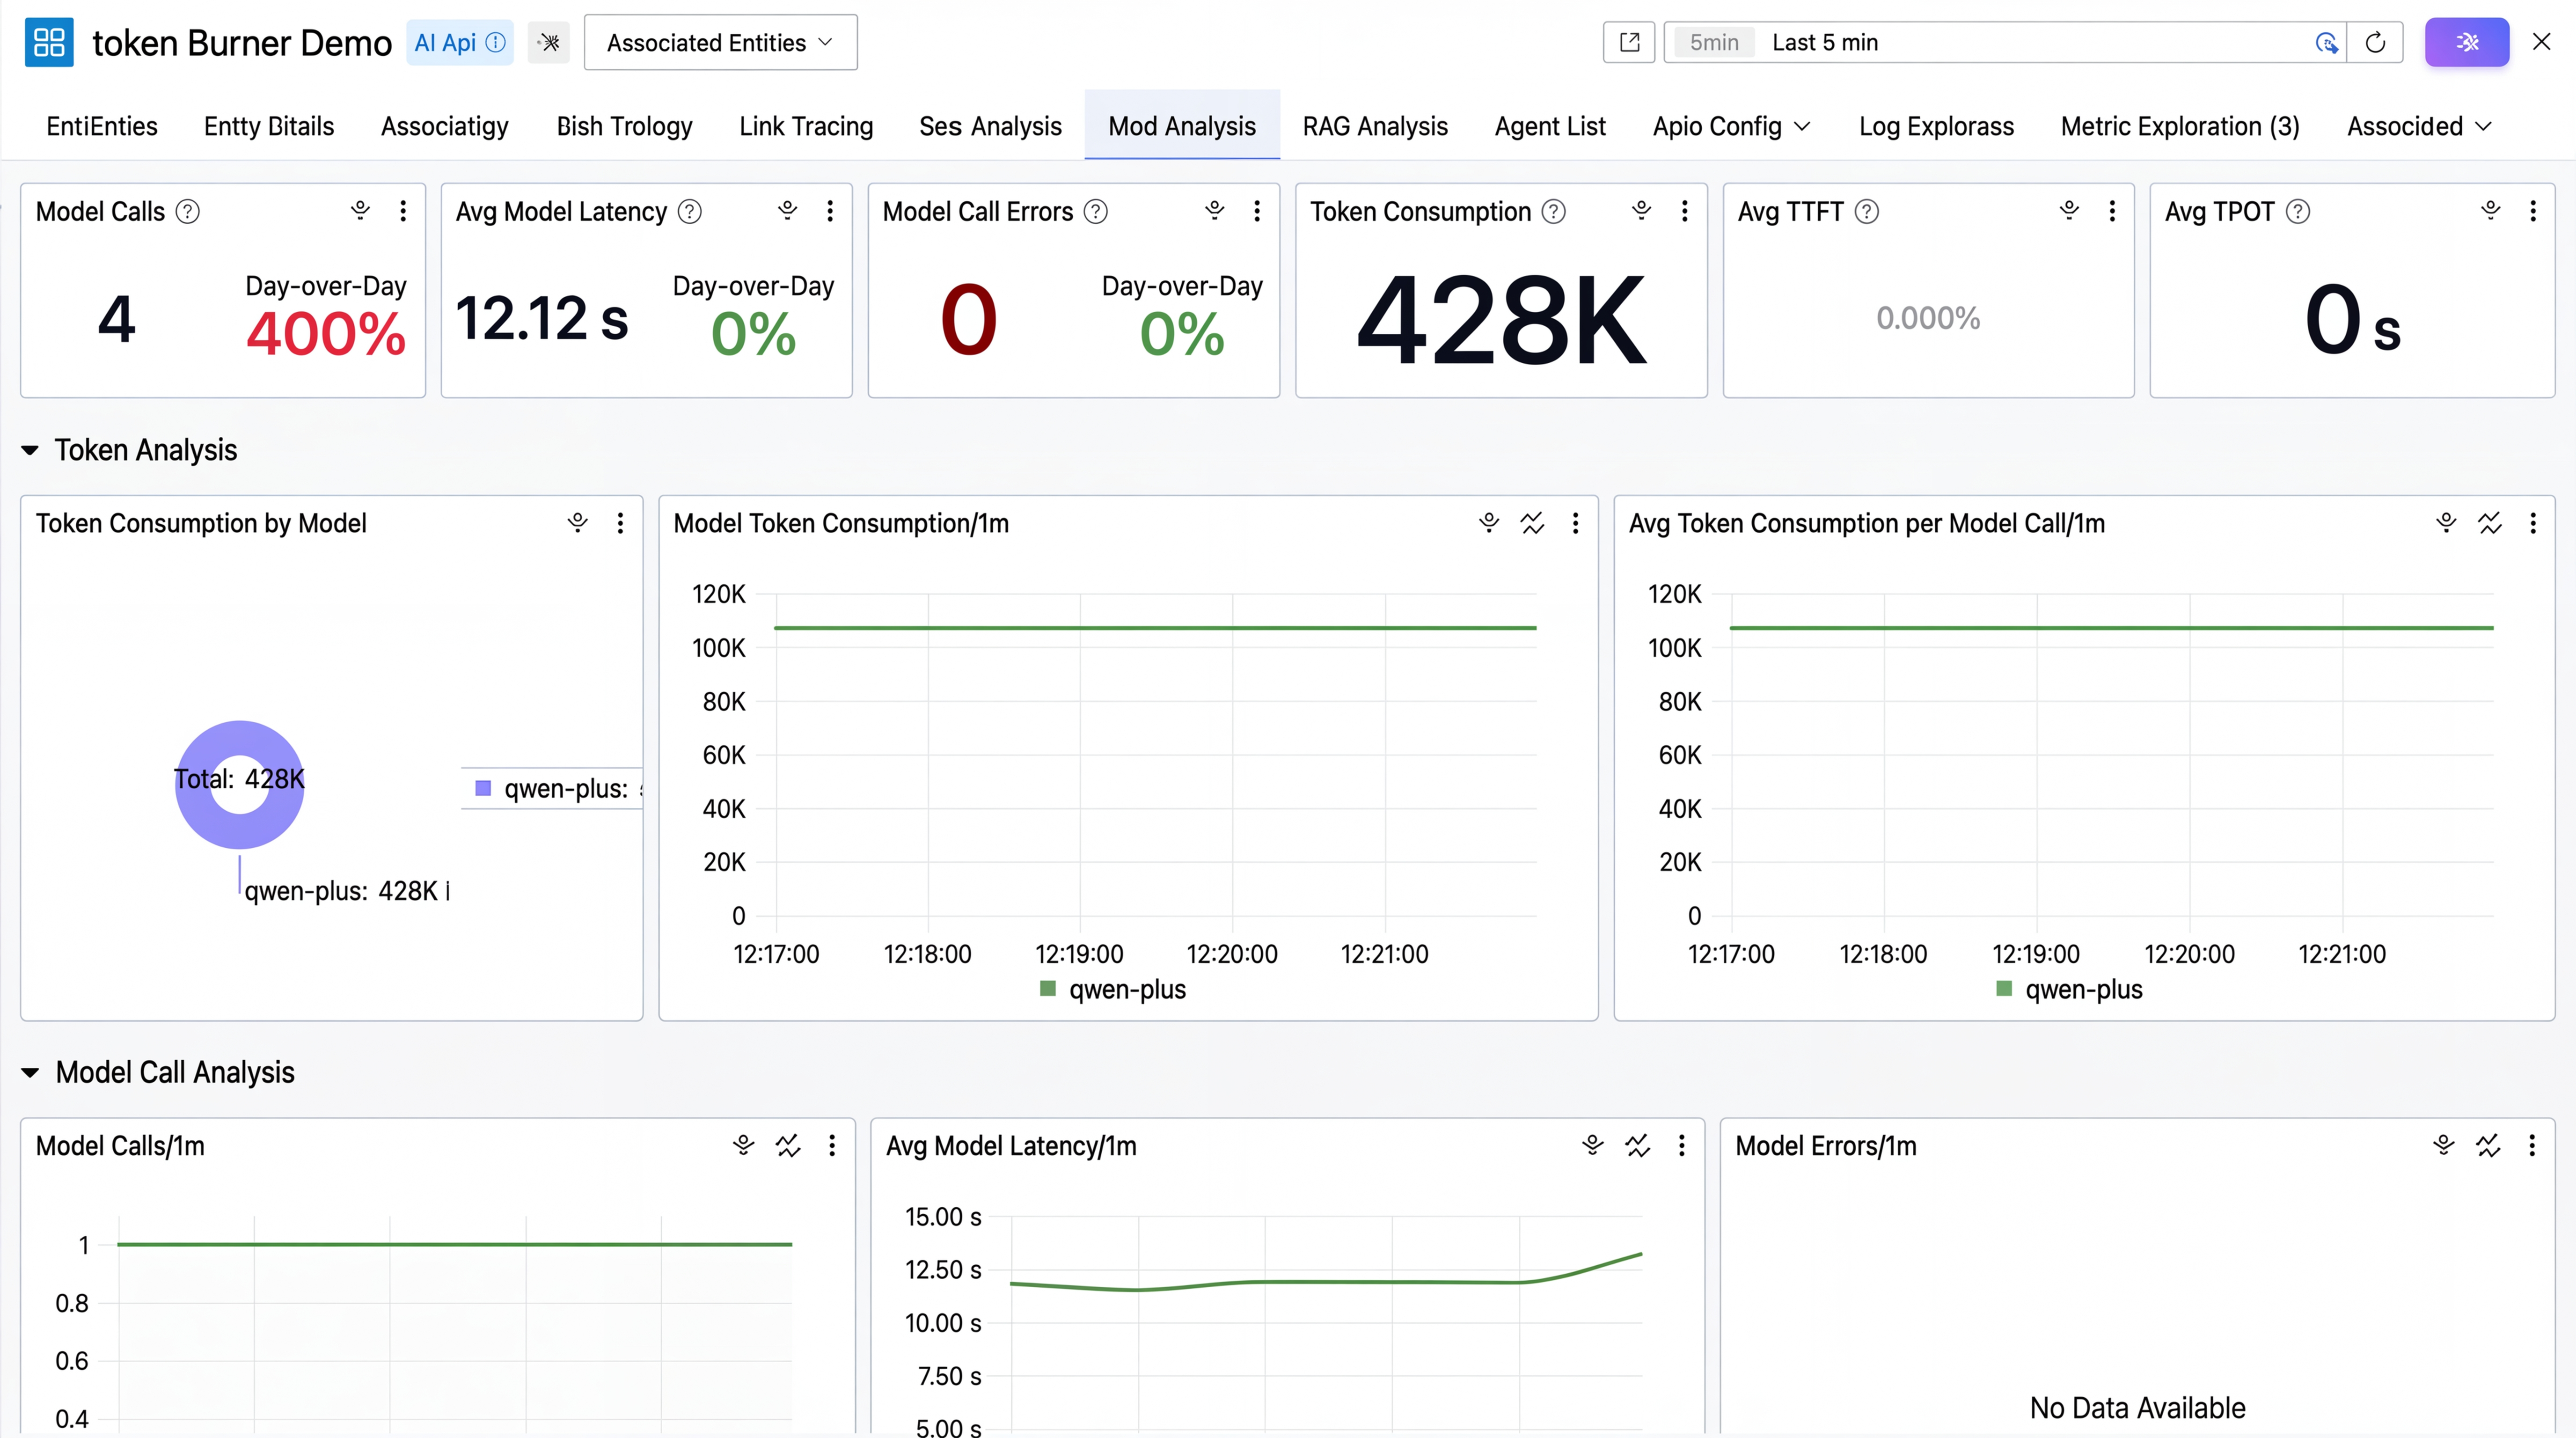
A team built a custom agent using Python requests to call Qwen's /chat/completions directly, bypassing any official SDK so they could control retry and timeout logic themselves. Under this path, all OpenTelemetry instrumentation libraries based on SDK monkey-patching stopped working entirely. The team assumed their custom agent couldn't be monitored.
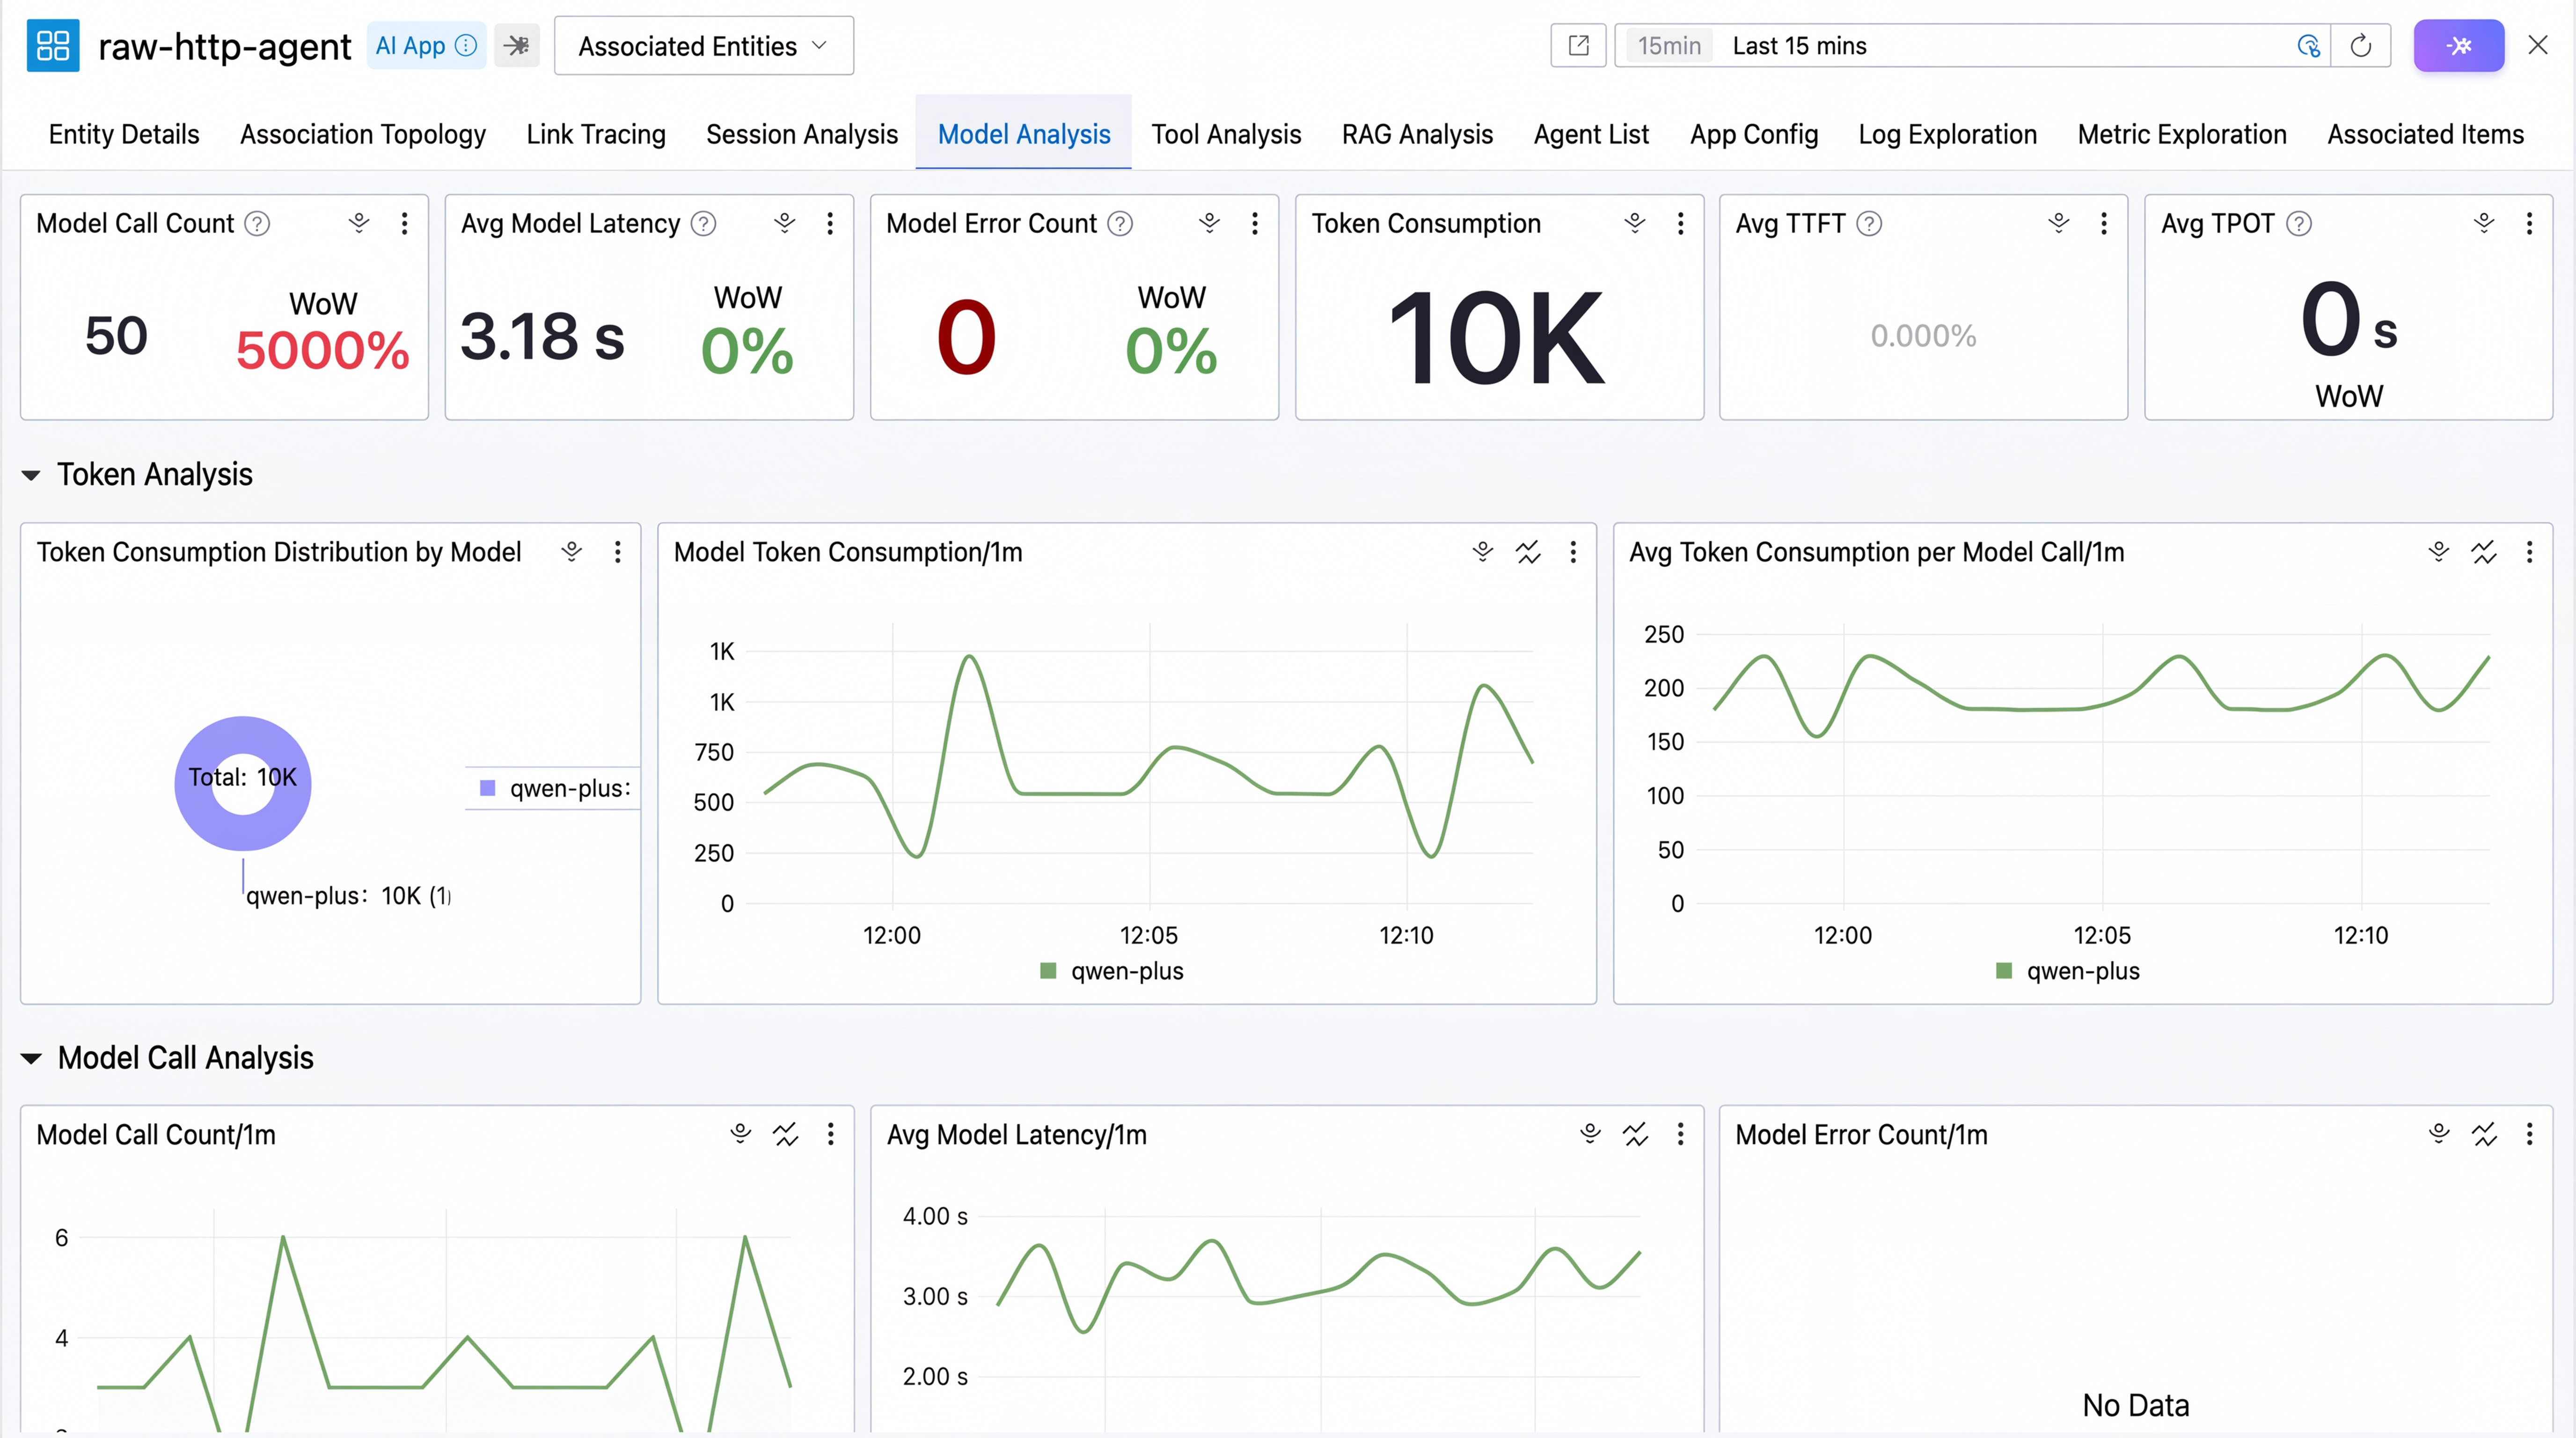
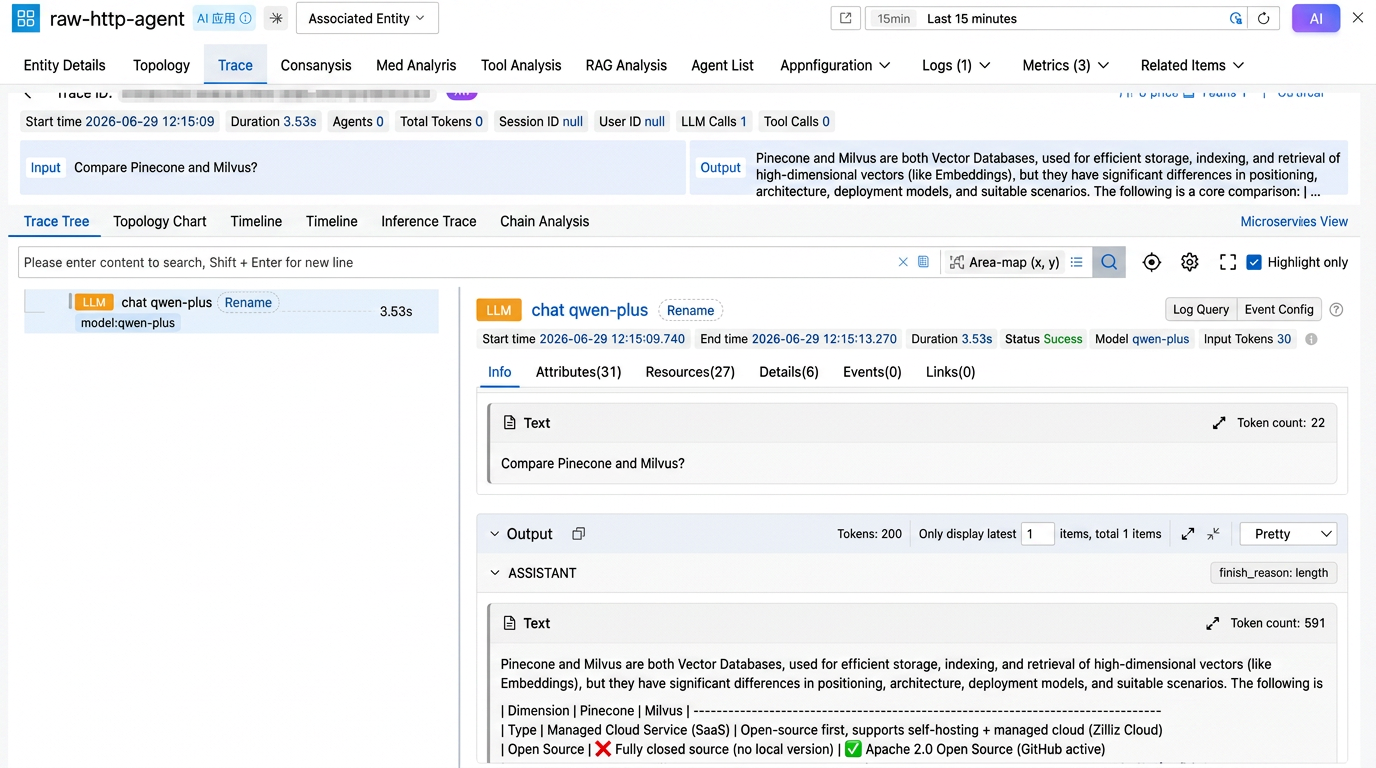
After deploying OBI, without changing a single line of code or installing any Python packages, the invocation chain immediately appeared on the AI Agent Observability dashboard. The provider was auto-identified as Qwen, and model, input/output tokens, and tool_calls were all fully populated, looking completely identical to an app using the official SDK. The reason was explained earlier: OBI looks at HTTP packets flowing over TCP and doesn't care if the app uses an SDK. This is OBI's most hardcore differentiator compared to any SDK solution: its coverage isn't "applications that integrated our SDK," but "all applications that call LLMs via HTTP."
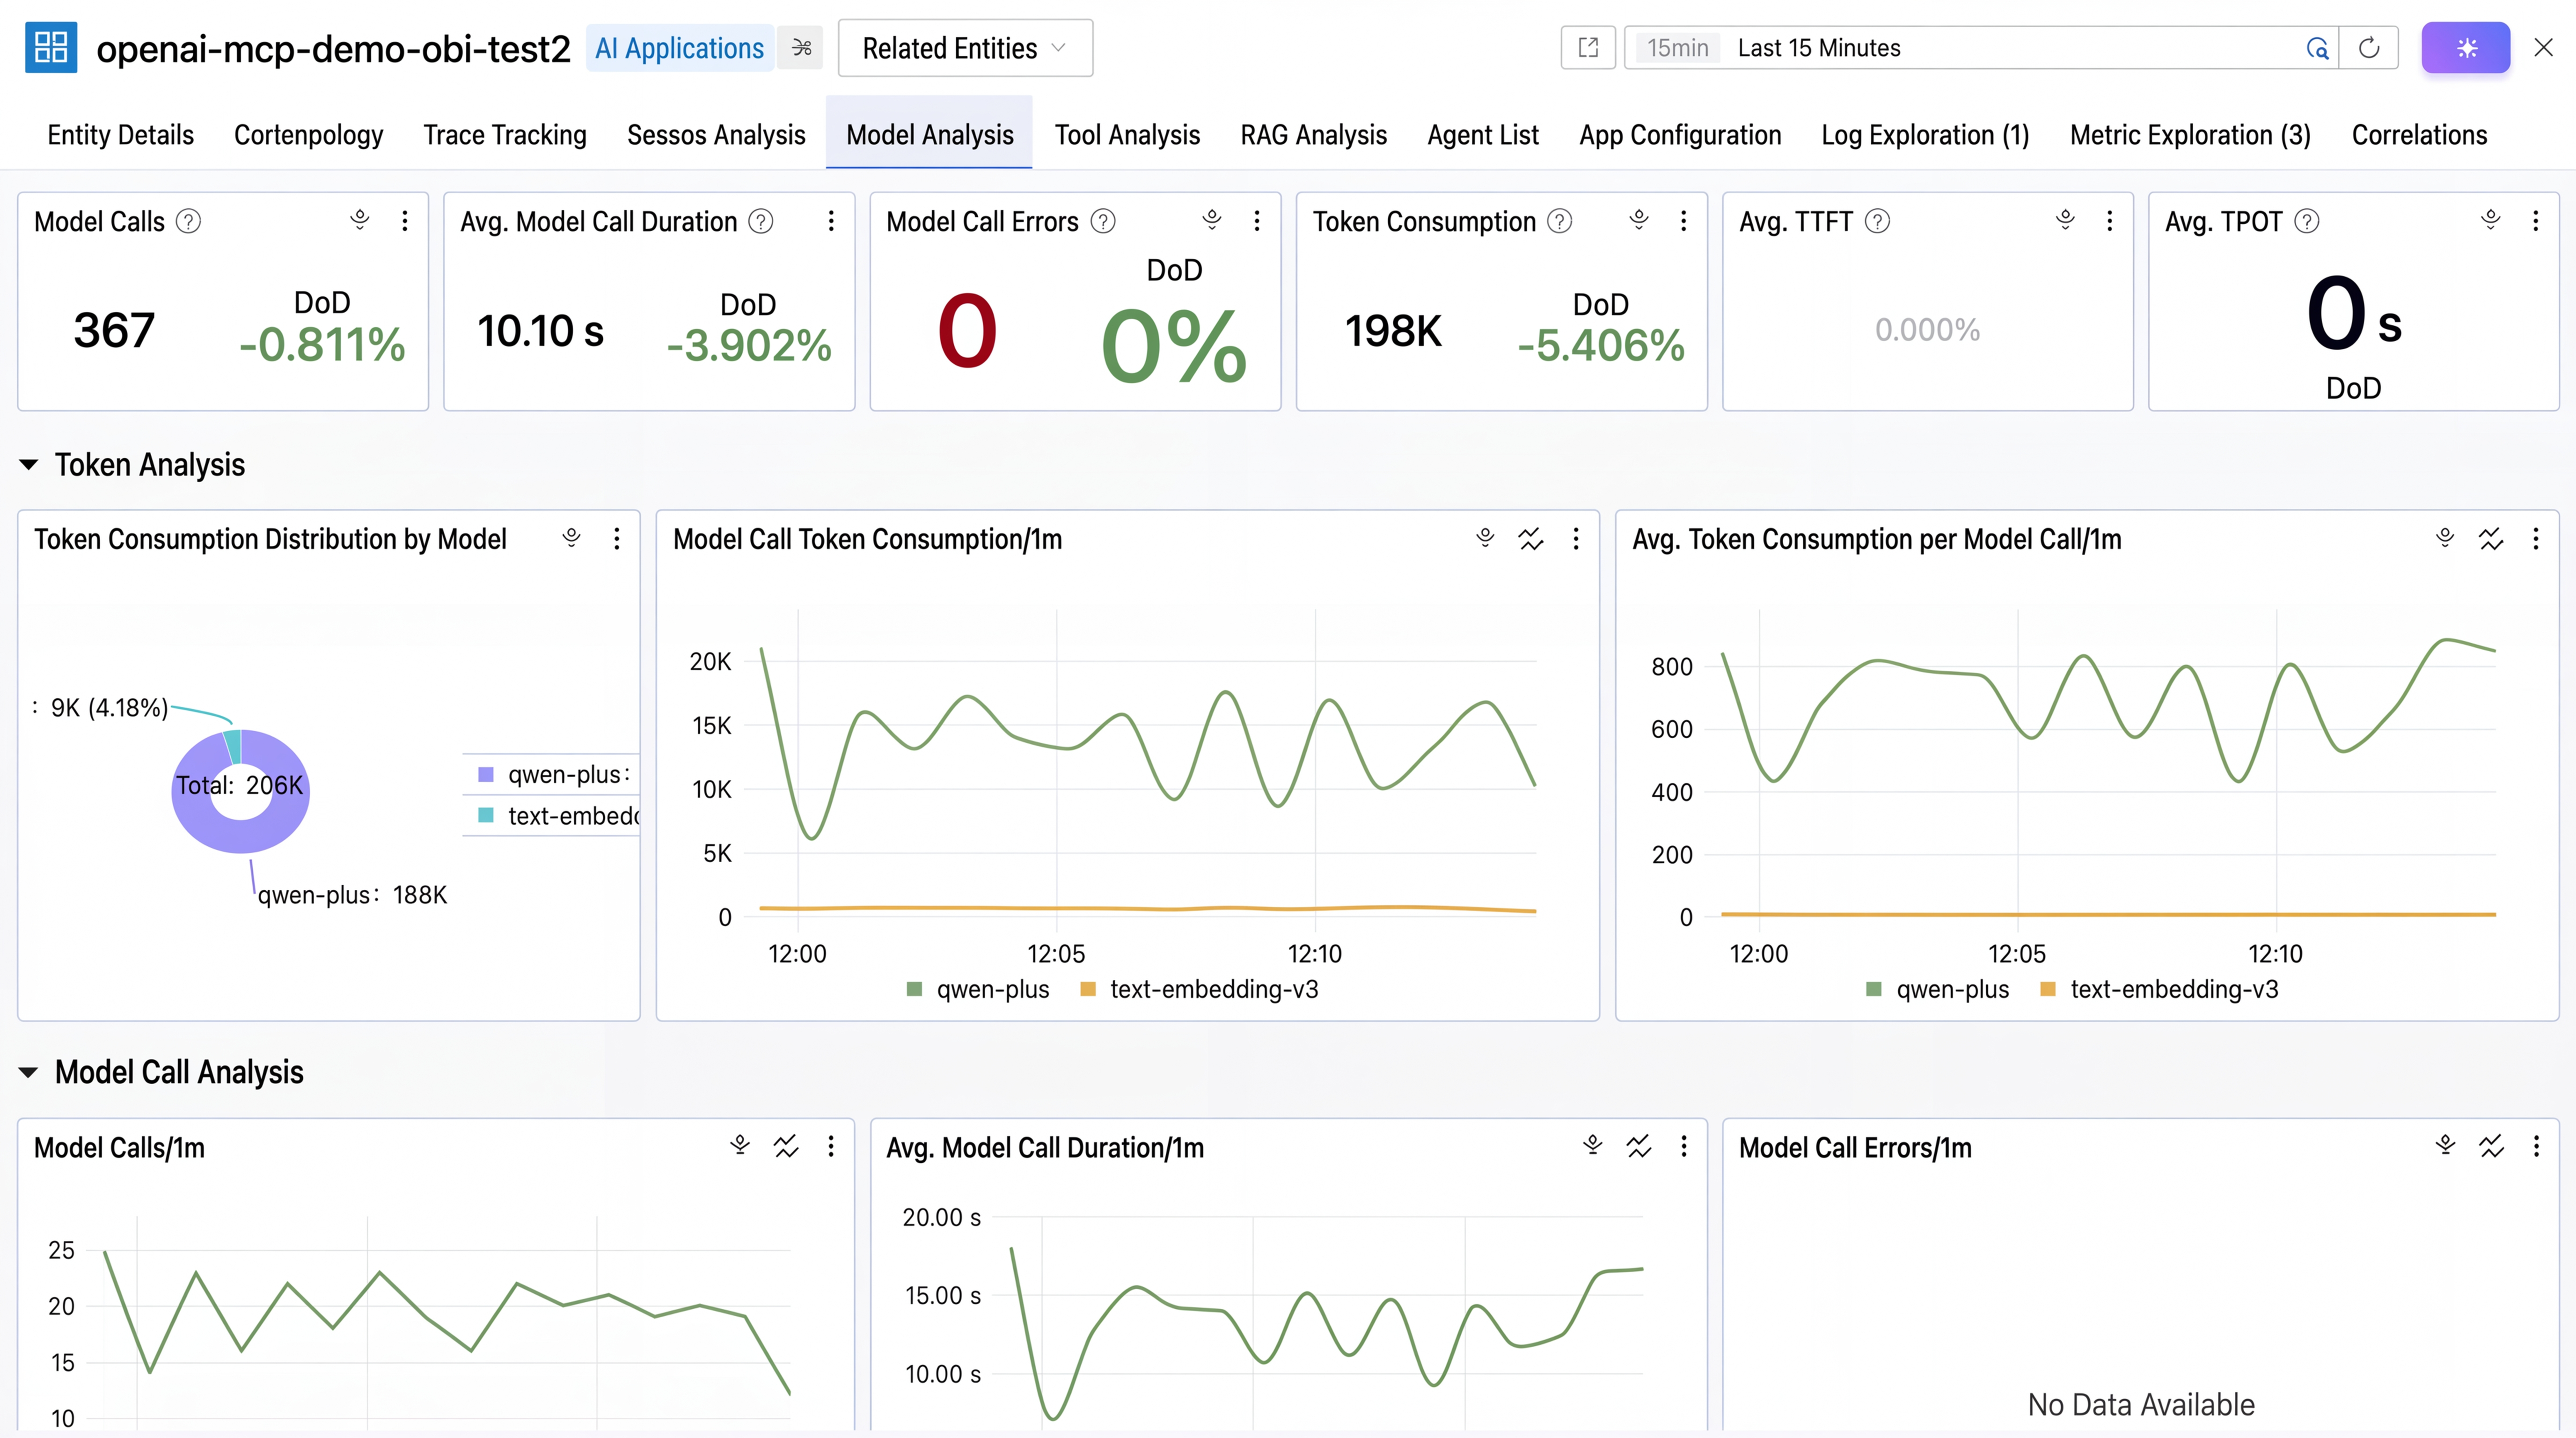
The two screenshots below are from the same OBI AI Agent Observability dashboard. One is the raw-http-agent from Scenario 3 using the standard library http.client to build requests. The other is an openai-mcp-demo using the official OpenAI SDK. The fields under the "Model Analysis" view—call volume, average latency, total tokens, model dimensions (qwen-plus/text-embedding-v3), and the distribution of latency and volume per model—are structurally identical.
| raw-http-agent | openai-mcp-demo |
 |
 |
 |
 |
The current version of OBI has already achieved comprehensive tracking of GenAI invocation chains, but this is just the beginning. Next, we will focus on advancing the following areas:
Time to First Token (TTFT): For streaming response scenarios, the latency from request to the arrival of the first SSE event is the most direct metric for user experience. OBI will accurately record this time delta at the kernel layer, helping developers pinpoint whether a "slow model response" is due to the network, queuing, or the inference itself.
GenAI-specific metrics: Beyond traces, OBI will generate a set of metrics tailored for AI scenarios. This includes token consumption rates, success/error rates aggregated by provider and model, average response latency percentiles, and Top-N tool call frequencies. These metrics can be directly plugged into Prometheus/Grafana or Alibaba Cloud ARMS, delivering an out-of-the-box AI app monitoring dashboard. We will also continuously track API signatures of emerging AI providers (like DeepSeek and Mistral) to ensure provider recognition stays ahead of users' needs.
End-to-end agent observability: As AI applications evolve from single-turn QA to multi-step agent architectures, OBI will provide end-to-end tracking capabilities for agent execution chains. This includes automatically identifying the agent's planning -> tool call -> observation -> response loop at the kernel layer, chaining each round of decision-making and tool usage into a complete agent trace. It will support MCP semantic recognition, automatically tagging tool names, parameter summaries, and return statuses. For mainstream agent patterns like ReAct and Function Calling, it will offer dedicated invocation topology views and latency waterfall charts, helping developers pinpoint "which step the agent is stuck on" or "which tool slowed down the overall response."
Multi-turn conversation context correlation: Chaining multiple LLM calls within the same session into a complete conversational flow, supporting the analysis of token consumption trends and response quality degradation at the conversation dimension.
Returning to the "crime scene with no surveillance footage" from the beginning: when users complain about "wrong answers," developers no longer need to guess, simulate, or write custom instrumentation wrappers for every provider. As long as it runs on Linux, OBI can automatically capture every LLM call, every tool call, and every vector search at the kernel layer, outputting standard telemetry data that complies with GenAI semantic conventions. It's not about burying probes inside your application; it's about turning the operating system into a holographic flight recorder for your AI agents. Whether you use an official SDK or a raw HTTP request, whether it's Python, Go, Java, or Node.js—they all submit the same data format and flow into the same dashboards. Semantic convention updates only require a DaemonSet upgrade with zero app modifications. For teams moving toward multi-step agents, multi-model orchestration, and hybrid provider deployments, this means observability is no longer an afterthought patched on post-launch, but foundational infrastructure present from the very first packet.
[1] Cloud Monitor 2.0 Integration Center: https://help.aliyun.com/en/cms/cloudmonitor-2-0/access-center
Can the Log Be Changed? SLS Logstore Adds Native Support for Log Updates and Deletes
Why Is Your AI Agent Slow? Node.js Agent Connects Models, Tools, and Service Traces in One Go

756 posts | 60 followers
FollowAlibaba Cloud Native Community - April 9, 2026
Alibaba Cloud Native Community - June 10, 2026
Alibaba Cloud Native Community - April 15, 2026
Alibaba Cloud Native Community - September 4, 2025
Alibaba Cloud Native Community - July 30, 2026
Alibaba Cloud Native Community - June 4, 2026
756 posts | 60 followers
Follow Token Plan
Build more, spend less. One plan, every modality.
Learn More
Alibaba Cloud Model Studio
A one-stop generative AI platform to build intelligent applications that understand your business, based on Qwen model series such as Qwen-Max and other popular models
Learn More Qwen
Qwen
Full-range, open-source, multimodal, and multi-functional
Learn More Cloud-Native Applications Management Solution
Accelerate and secure the development, deployment, and management of containerized applications cost-effectively.
Learn MoreMore Posts by Alibaba Cloud Native Community

