Since 2025, the AI Coding Agent has entered an outbreak period. Cursor, Claude Code, Codex, Qoder -these tools are no longer "early adopters," but productivity tools that more and more developers and teams rely on every day. They can understand the code context, autonomously invoke tools, refactor across files, and even complete functional development independently.
But when we try to answer some basic questions, we find ourselves almost nowhere to start:
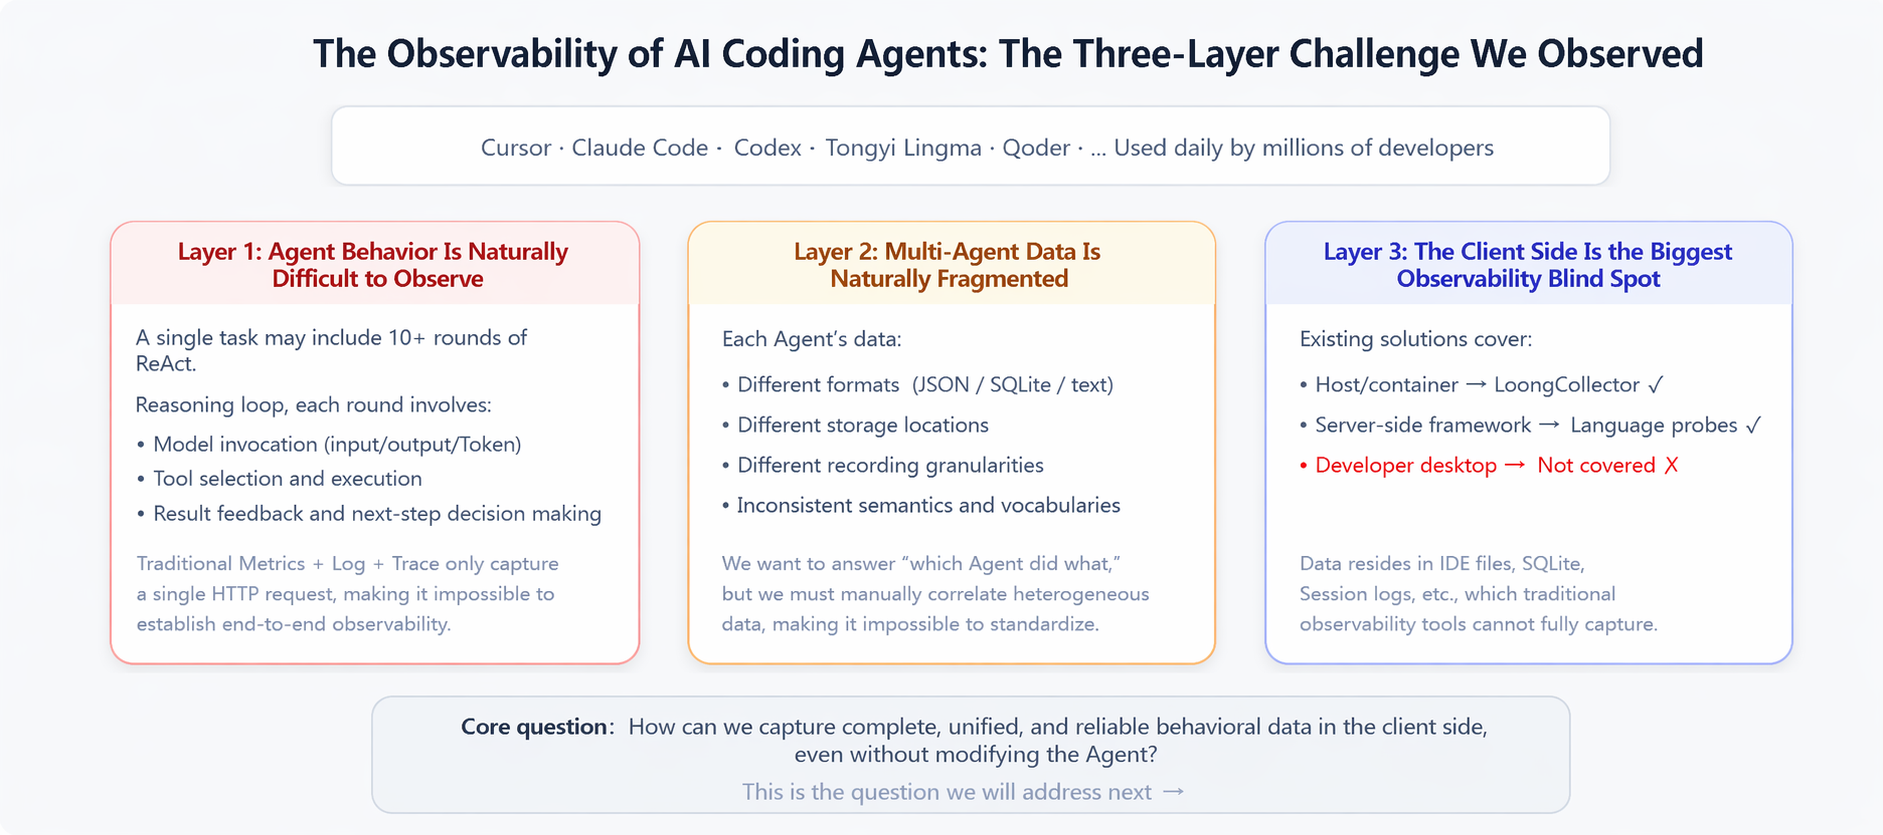
These questions point to a common fact that our AI Coding Agent operational behavior is hardly observable. This is not a small problem-when companies spend tens of thousands or even hundreds of thousands of budgets on AI Coding tools every month, but cannot quantify whether the money is worth it, it becomes a business problem.
We carefully analyzed the problem and found that the difficulties came from three levels:
Agent behavior is naturally difficult to observe. Different from traditional API calls, a task execution of an AI agent may contain more than 10 rounds of ReAct inference loops. Each round involves model calls, tool selection, and result reflection. The traditional Metrics, Log, and Trace methods can only see a bunch of independent HTTP requests and cannot restore this hierarchical and orderly decision-making process.
Multi-agent data is naturally fragmented. Each agent has different data format, storage location, and record granularity. Cursor's data is in one place and Claude Code's is in another. It is almost impossible to make horizontal comparisons.
The end side is an observable dead zone. Existing observability solutions-whether host probes such as LoongCollector or process probes such as Python/Go/Java language agents-are server-oriented. However, the AI Coding Agent runs on the developer's local machine, and the data is scattered in various corners such as IDE history files, local SQLite databases, and Session logs, which are completely untouched by traditional solutions.
In the face of these challenges, we made some key design choices. The trade-offs behind these choices may be valuable for developers who are also exploring this area.
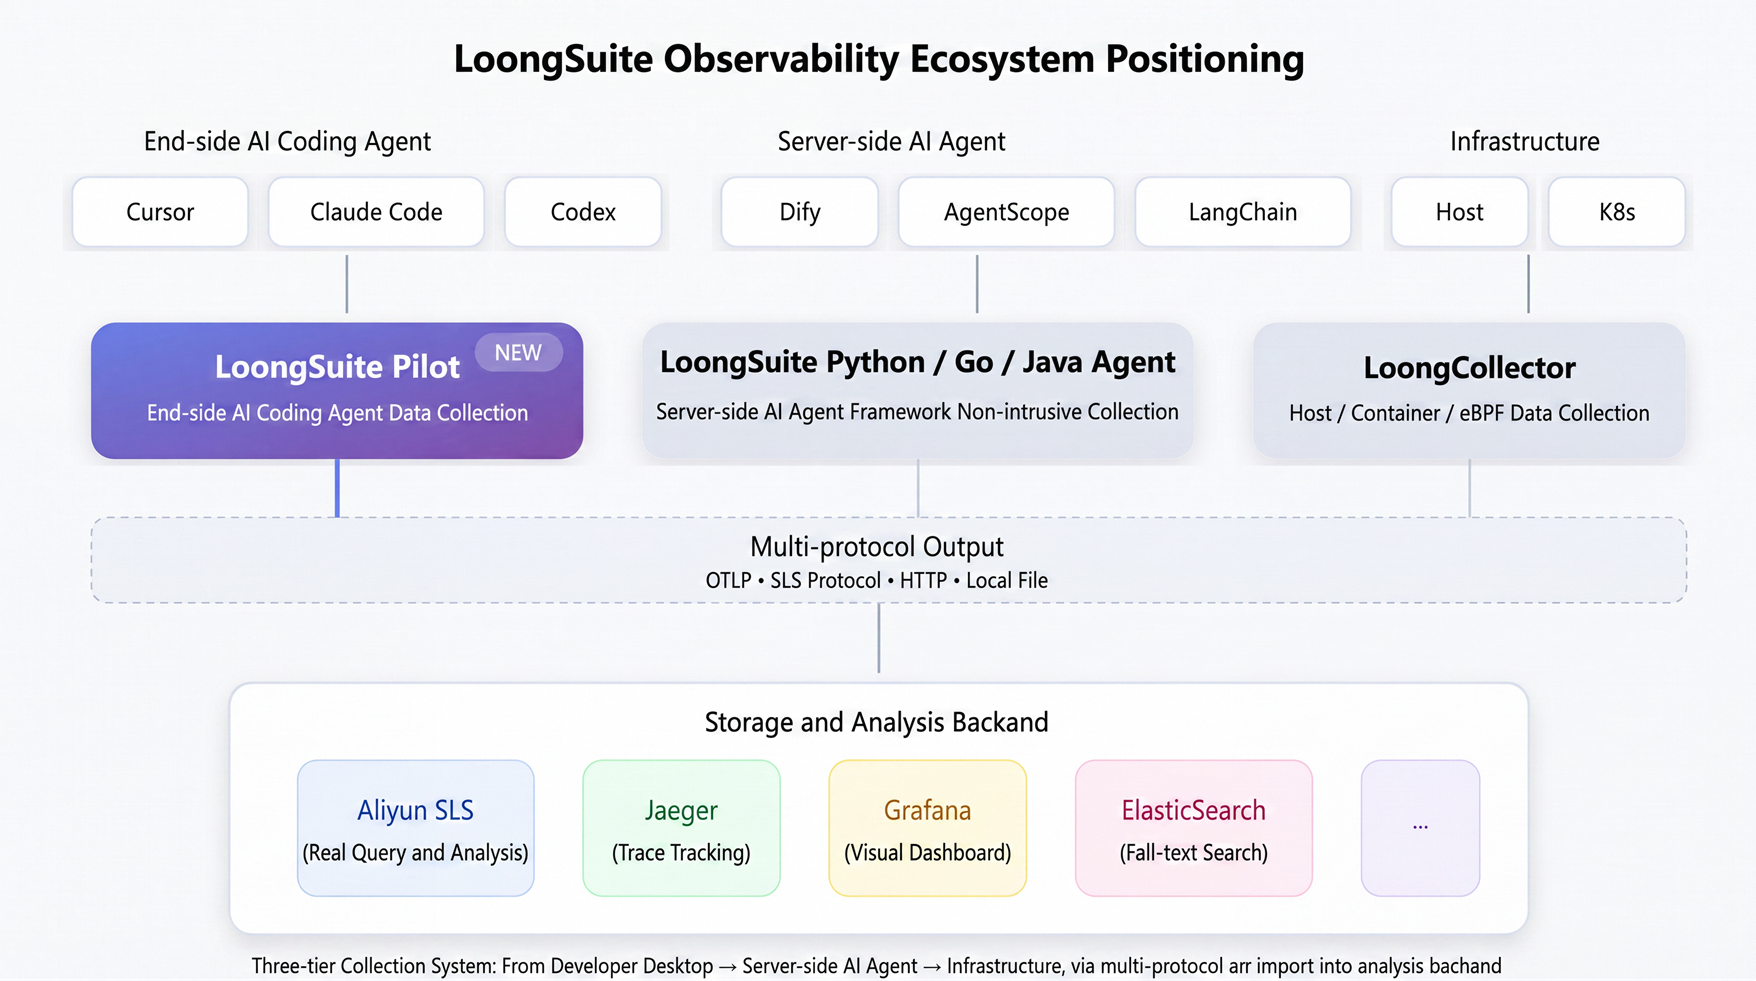
The easiest way to think of is to write a dedicated data extraction script for each agent. However, the Coding Agent ecosystem iterates extremely fast, and new agents will appear in a few months. The single-point solution cannot be sustained. Our choice is to do a unified collection platform-one deployment, automatically covering all installed AI Coding Agent on the device.
This requires that the architecture must be sufficiently scalable. We declare the detection rules, deployment modes, and collection configurations for each agent in the agents.d/*.json file:
{
  "id": "claude-code",
  "displayName": "Claude Code",
  "deployMode": "hook",
  "detection": {
    "paths": ["~/.claude"],
    "commands": ["claude"]
  },
  "hook": {
    "settingsPath": "~/.claude/settings.json",
    "events": ["UserPromptSubmit", "PreToolUse", "PostToolUse", "Stop", ...],
    "hookCommand": "$PILOT_DATA/hooks/claude-code-loongsuite-pilot-hook.sh"
  },
  "input": {
    "type": "hook-jsonl",
    "logDir": "$PILOT_DATA/logs/claude-code"
  }
}
To add a new agent, the core workload is to understand its data format and write conversion logic, without changing the framework code.
The server can be observed with a mature paradigm-automatic tracking through in-process injection such as Java Agent and Python Agent. However, the end-side AI Coding Agent are third-party closed-source products, and we cannot modify their run time, nor can we require each agent vendor to expose a standardized telemetry interface. Moreover, each Agent leaves data in a completely different way: Claude Code supports Hook callbacks, Qoder's history is in the SQLite database, and some Agents only leave Session log files.
Therefore, the core principle is to adapt the collection capability to the native running mode of the AI agent, rather than requiring the agent to adapt itself to the collection tool. We abstract these differences into five collection base classes, each encapsulating a set of incremental extraction strategies. The new Agent simply chooses the appropriate base class and implements 2-3 methods:
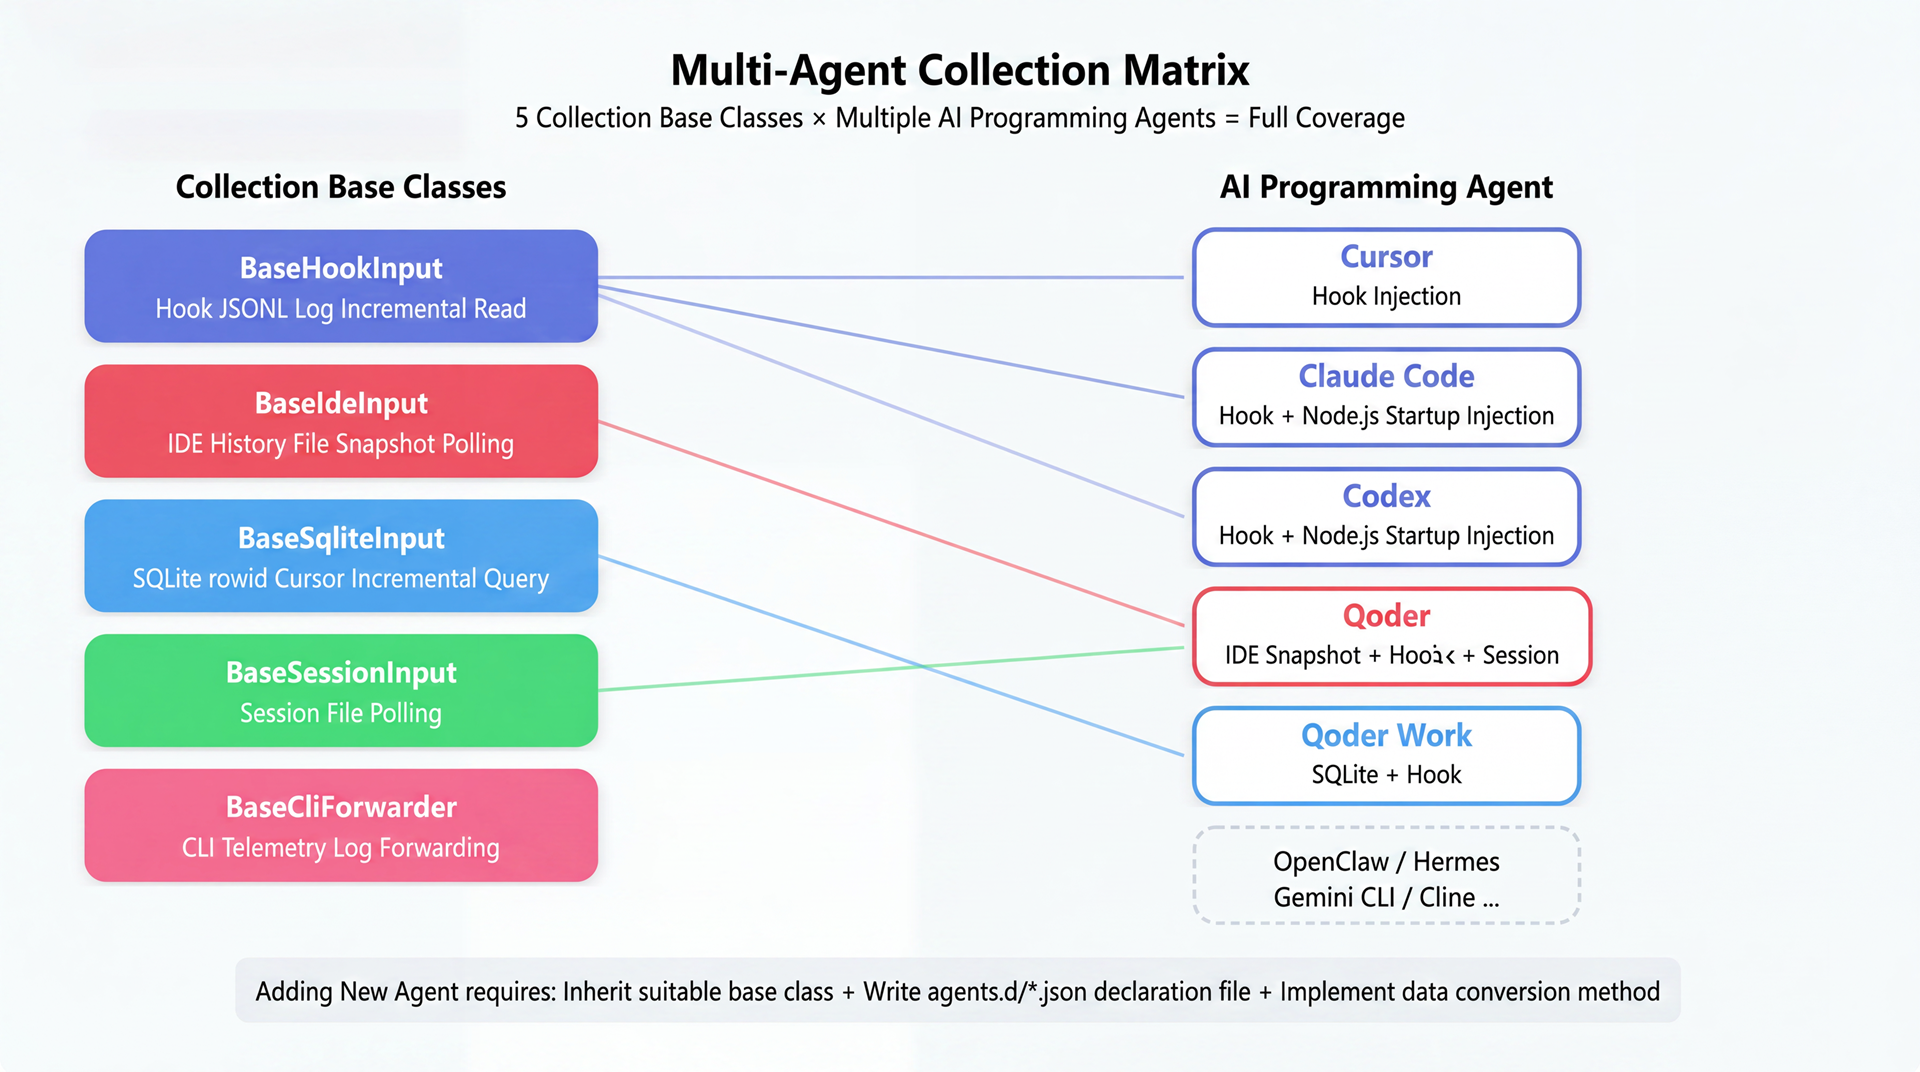
| Collection base class | Policy | Usage notes |
|---|---|---|
| BaseHookInput | Hook JSONL log incremental reading | Agents that support the hook mechanism (Cursor, Claude Code, and Codex) |
| BaseIdeInput | IDE History File Snapshot Polling | IDE Plug-in Class Agent |
| BaseSqliteInput | SQLite rowid cursor incremental query | A native database for agents. |
| BaseSessionInput | Session File Polling | Session Log Agent |
| BaseCliForwarder | CLI Telemetry Log Forwarding | CLI class Agent |
The underlying layer uses the Checkpoint mechanism to ensure data reliability-StateStore records read offsets and SnapshotStore stores deduplication snapshots. Network fluctuations, device restarts, and terminal shutdowns on local devices are normal. Resumable mining ensures that no data loss or duplication occurs after the process is abnormally interrupted.
Currently, the agents that have been adapted and their coverage capabilities:
| Agent | Overwrite events |
|---|---|
| Claude Code | Complete event chain including user questions, tool calling (before/after), job completion, context compression, sub-agent lifecycle, and notifications |
| Codex | Session startup, user questions, tool calling (before/after), and job completion |
| Cursor | 12 types of event coverage, including session lifecycle, tool calling, questions, and sub-agents |
| Qoder / Qoder Work | Hook log + IDE history + database + session file multi-channel parallel collection |
Collecting data is only the first step. If Cursor data is in one format and Claude Code is another, each downstream analysis capability must be connected to multiple data sources. This path is unsustainable.
Our approach is to normalize all raw data into a uniform AgentActivityEntry event format, following the LoongSuite GenAI observable semantics specification. This specification is based on OpenTelemetry GenAI Semantic Conventions extensions and supplements AI Coding Agent scenarios that are not yet covered by community standards.
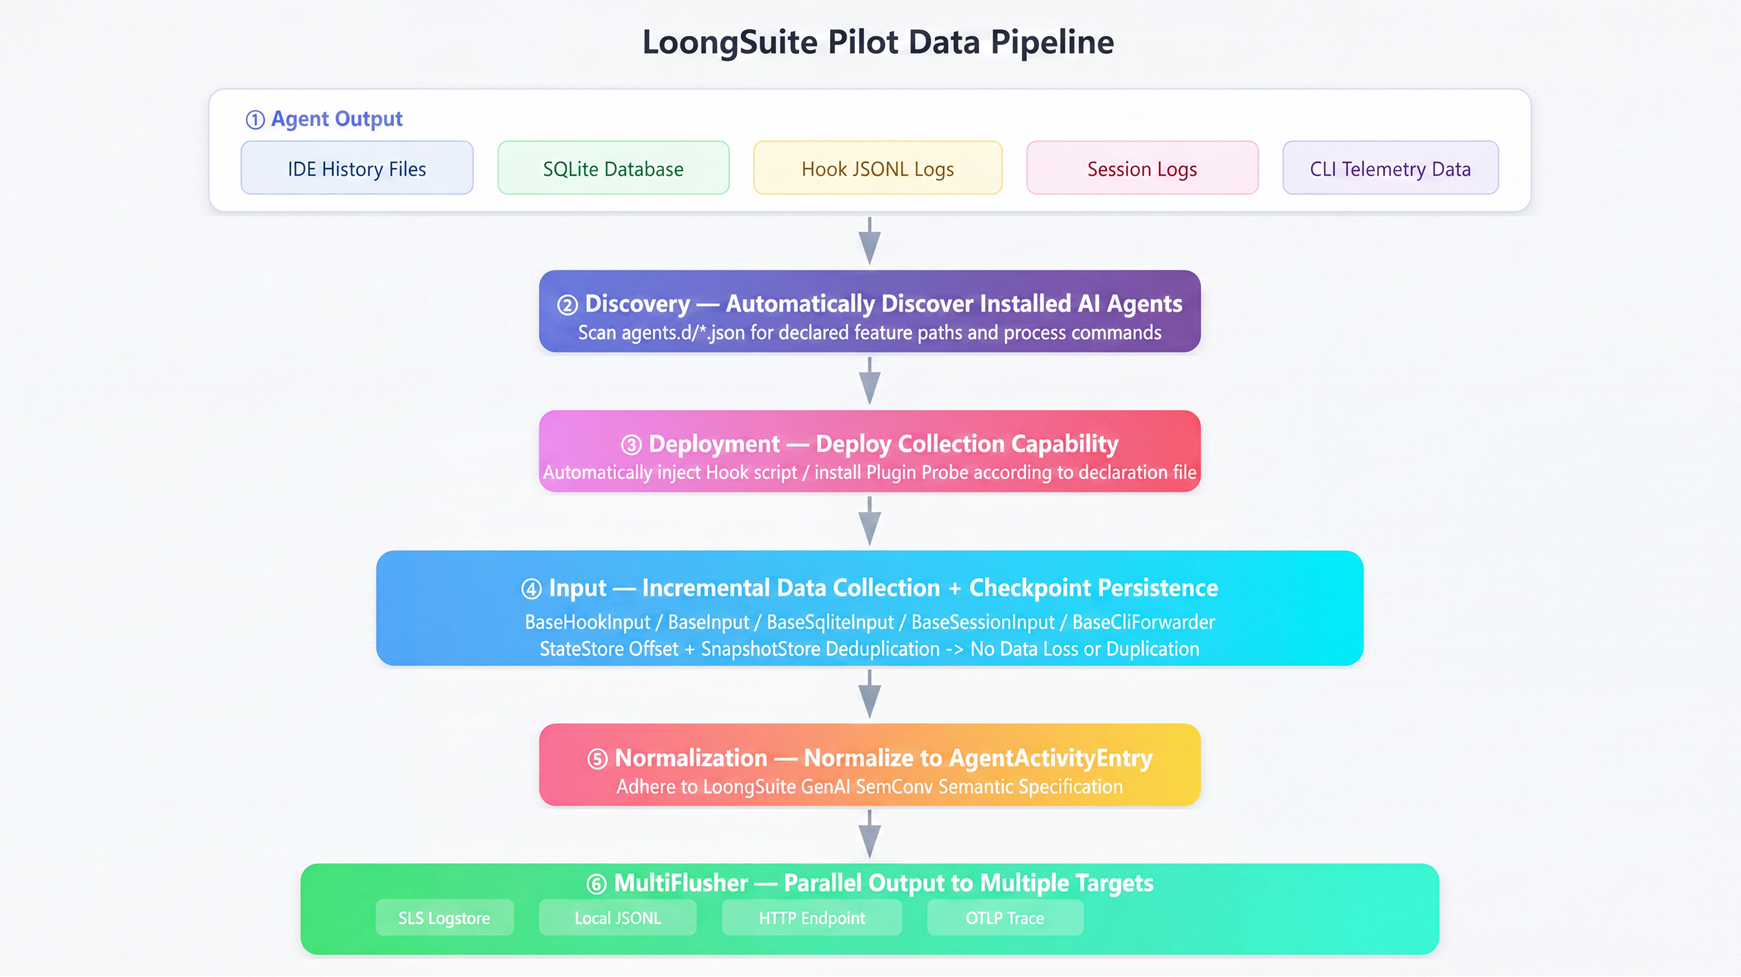
The value of unified semantics lies in:
Alignment: The data of all agents uses the same field names and semantic definitions, such as gen_ai.usage.input_tokens, gen_ai.session.id, and gen_ai.tool.call.id. In downstream analysis, you do not need to detect differences in data sources.
Hierarchical link: The session → turn → step → response/tool_call retains the complete hierarchy and restores the complete execution link from the receipt of input to the final output of the agent, including the thinking, tool invocation, and inference processes in each round of the React loop.
Infrastructure reuse: When a new agent is added, downstream capabilities such as dashboard, alerting, analysis, and query automatically take effect. You do not need to re-develop the agent.
Not all teams need to collect the full amount of data. In some scenarios, only cost analysis (token usage and model invocation times) is required. In other scenarios, complete audit (message content, tool parameters, and execution results) is required.
We provide security controls at two levels:
Collection granularity control. You can configure whether to collect large fields such as message content, tool parameters, and model input and output by agent type. After you disable this parameter, only structured metadata such as model name, token consumption, duration, and tool name is reported.
Automatically de-identify sensitive information. AI Coding Agent dialogue content often contains sensitive credentials such as API Key, cloud vendor AK/SK, database connection string, private key, etc. Developers paste a configuration file when asking questions, or Agent writes the content into tool call parameters after reading the .env file, which will cause sensitive information to enter the collection link. Pilot has a built-in rule-based automatic desensitization engine that scans and replaces sensitive content before data is distributed to any output channel:
| Algorithm type | Coverage | Replace Tag |
|---|---|---|
| Cloud AccessKey | Alibaba Cloud LTAI, AWS AKIA/ASIA, Tencent Cloud AKID | [ACCESSKEY_MASKED] |
| API Key | OpenAI compatible sk- 、GitHub PAT ghp_/gho_/ghs_ | [APIKEY_MASKED] |
| The connection string of the database. | MySQL/PostgreSQL/MongoDB/Redis URI and JDBC with password | [DATABASEURL_MASKED] |
| Private key | PEM / OpenSSH private key block | [PRIVATEKEY_MASKED] |
You can configure the de-sensitivity switch (mask.mode: none | all | custom ). By default, de-sensitivity is disabled. After de-sensitivity is enabled, it takes effect on all output channels (SLS, JSONL, HTTP, and OTLP).
Different teams consume data in different ways: security compliance requires structured logs for audit queries, and SRE requires Trace views for link analysis. Local developers may only want to take a look at the original JSONL. To avoid binding a single backend, the collected data is written to multiple targets at the same time through parallel fan-out, and the failure of a single target does not block other channels:
Data is stored and consumed entirely in the user's own infrastructure and does not depend on any agent vendor.
Having talked about so many design ideas, it is better to run them again. The following is the complete process from scratch to seeing the data on the dashboard.
curl -fsSL https://loongcollector-community-edition.oss-cn-shanghai.aliyuncs.com/loongsuite-pilot/installer.sh | bash -s -- install \
  --sls-endpoint "https://cn-xx.log.aliyuncs.com" \
  --sls-project "my-project" \
  --sls-logstore "my-logstore" \
  --sls-ak-id "your-ak-id" \
  --sls-ak-secret "your-ak-secret" \
The installation script automatically downloads the latest version, deploys to the ~/.loongsuite-pilot/, installs the hook script, and starts a background process. After the installation is completed, Pilot immediately starts scanning AI Coding Agent and automatically injects acquisition capabilities. Pilot supports both log and trace data output, which can be configured together during installation. The two channels work in parallel without blocking each other.
Log data: Log data is exported to a local JSONL file or Log Service Logstore for structured query and cost analysis.
Trace data: Each session is restored to a complete trace call tree through --collect-trace true opening-from user questions to model inference, tool calls, and final responses-and can be exported to the OTLP backend.
After the installation is complete, use Claude Code, Cursor, or another agent as usual. Pilot runs silently in the background without popping up windows or changing your operating habits.
Pilot has a built-in local dashboard, which allows you to view the collection status and agent activity without any external dependencies:
loongsuite-pilot monitor start
# Visit http://127.0.0.1:8765 in the browser.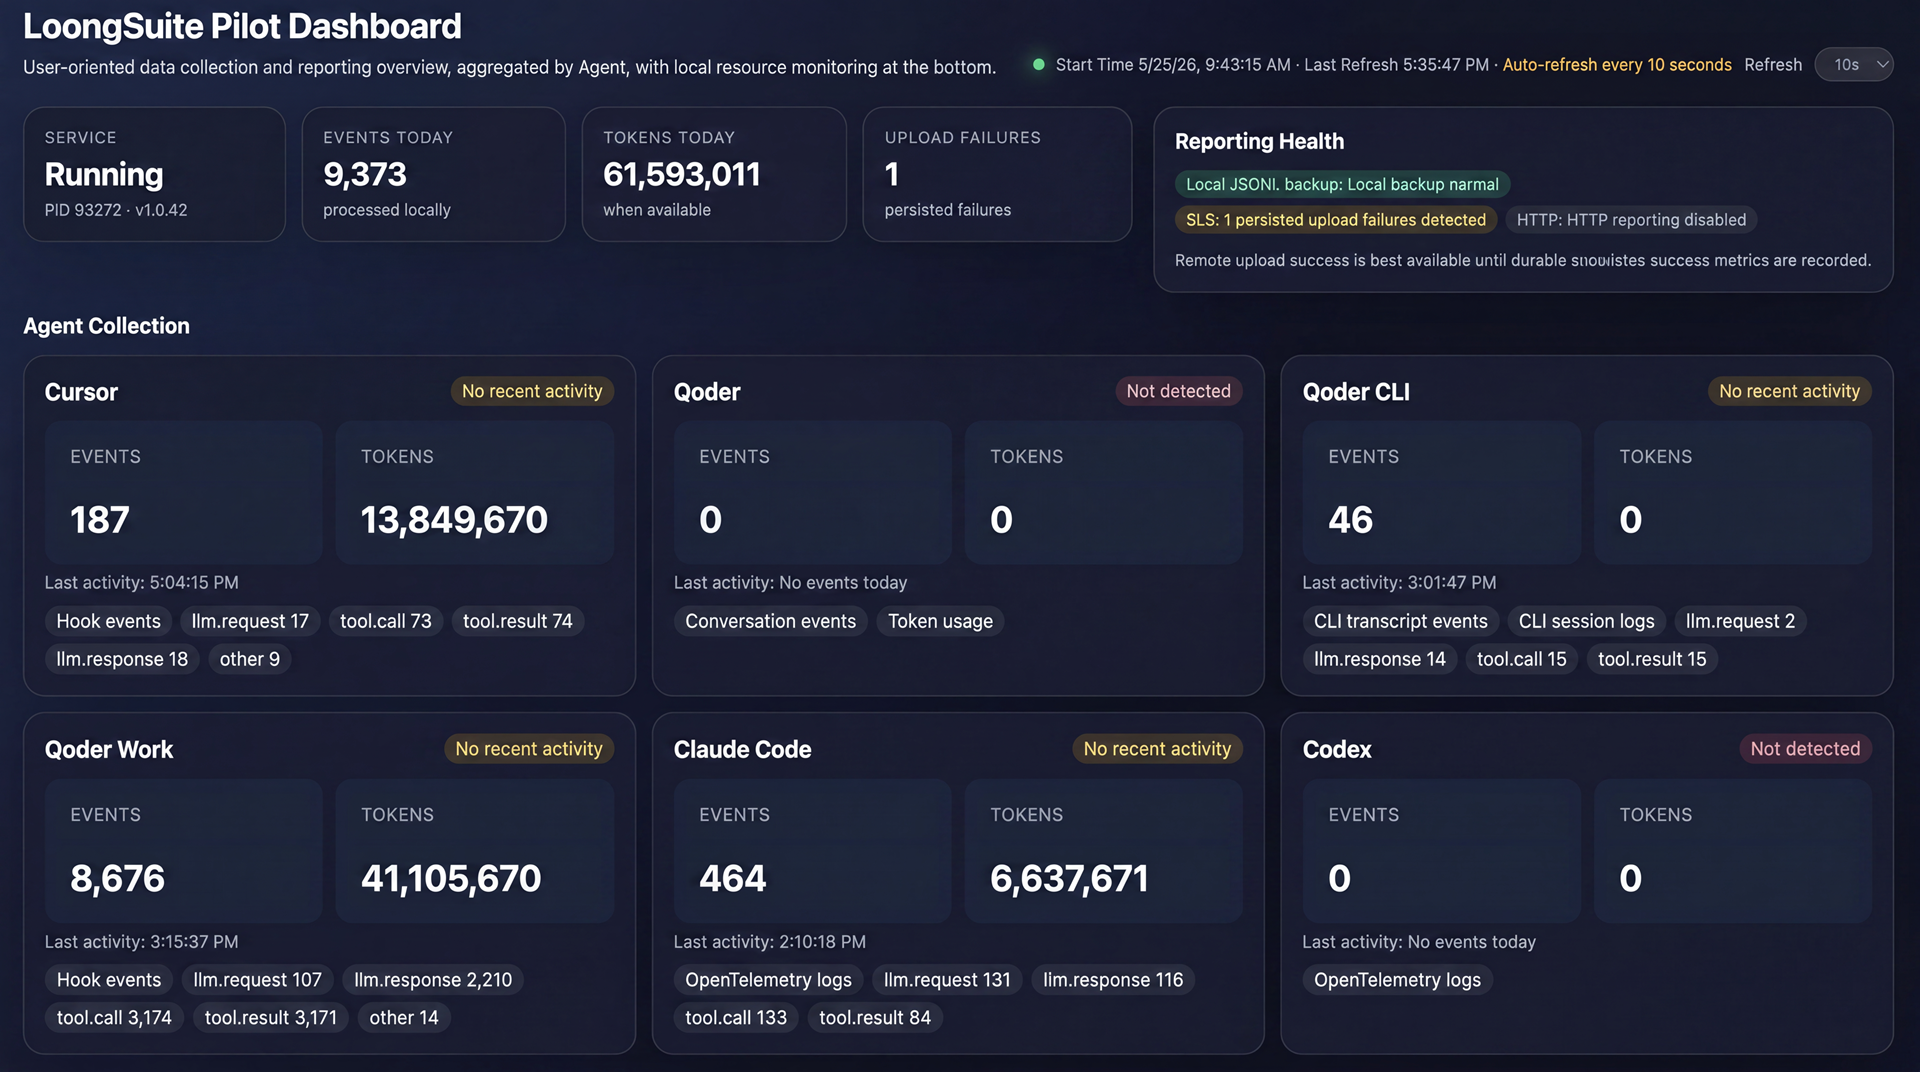
The Dashboard provides a collection overview of the Agent dimension-the number of events per Agent, the most recent active time, the success rate of reporting, and the trend of CPU /memory resource usage of the Pilot process itself. This is especially useful for the first verification after installation: you can confirm at a glance which agents were successfully discovered and whether data is flowing normally.
Each collection event is stored in a local JSONL file (~/.loongsuite-pilot/logs/output/ ). Let's look at a set of real Claude Code events-Agent calls Bash tools to execute ls commands and the corresponding execution results:
Event 1: **tool.call**- Agent Initiates Tool Call
{
  "event.name": "tool.call",
  "gen_ai.agent.type": "claude-code",
  "gen_ai.session.id": "8e06a611-d9ae-4c43-b03d-a285e8bda3ab",
  "gen_ai.turn.id": "8e06a611-d9ae-4c43-b03d-a285e8bda3ab:t1",
  "gen_ai.step.id": "8e06a611-d9ae-4c43-b03d-a285e8bda3ab:t1:s3",
  "gen_ai.tool.name": "Bash",
  "gen_ai.tool.call.id": "toolu_vrtx_0115QdGCWqoQ4Mnj6aKwcEuy",
  "gen_ai.tool.call.arguments": "{\"command\":\"ls /workspace/agent-data-collection/docs/\",\"description\":\"List docs directory\"}",
  "trace_id": "09f11db9fca4348e70ad34aa620e810c",
  "span_id": "dc688dbb763a7f4c",
  "parent_span_id": "d5afbe7a280d0d52"
}
Event 2: **tool.result** -Tool Execution Result
{
  "event.name": "tool.result",
  "gen_ai.tool.name": "Bash",
  "gen_ai.tool.call.id": "toolu_vrtx_0115QdGCWqoQ4Mnj6aKwcEuy",
  "gen_ai.tool.call.result": "E2E-REMOTE-TEST-GUIDE.md\n...",
  "gen_ai.step.id": "8e06a611-d9ae-4c43-b03d-a285e8bda3ab:t1:s3",
  "trace_id": "09f11db9fca4348e70ad34aa620e810c",
  "span_id": "dc688dbb763a7f4c"
}
A lot of information can be read from this set of data:
**session.id → turn.id → step.id** (t1:s3 ): The three-level identification goes through layers-conversation → round 1 dialogue → step 3 ReAct to accurately locate the position of this tool call in the whole conversation link**tool.name**+** tool.call.arguments**: Agent calls what tools, what parameters, complete records-this is essential for security audit**tool.call.id**: tool.call and tool.result are concatenated with the same ID to form a pair.**trace_id**+ **span_id** + **parent_span_id**: OTel link ID, which is used to connect all events of the same task into a complete call tree.After the data is reported to SLS, you can directly use SQL for analysis. The following are examples of useful queries:
Query the total token consumption of a user in the past seven days:
SELECT
  "user.id",
  "gen_ai.agent.type",
  SUM(CAST("gen_ai.usage.input_tokens" AS BIGINT))  AS total_input,
  SUM(CAST("gen_ai.usage.output_tokens" AS BIGINT)) AS total_output,
  SUM(CAST("gen_ai.usage.total_tokens" AS BIGINT))  AS total_tokens
FROM log
WHERE "event.name" = 'llm.response'
  AND "user.id" = '${userID}'
GROUP BY "user.id", "gen_ai.agent.type"
ORDER BY total_tokens DESC
Call the Top 10 Statistics Tool by Agent Type:
SELECT
  "gen_ai.agent.type",
  "gen_ai.tool.name",
  COUNT(*) AS call_count,
  AVG(CAST("gen_ai.tool.call.duration" AS DOUBLE)) AS avg_duration_ms
FROM log
WHERE "event.name" = 'tool.result'
GROUP BY "gen_ai.agent.type", "gen_ai.tool.name"
ORDER BY call_count DESC
LIMIT 10
Find sessions with abnormal token consumption (a single request exceeds 50K tokens):
SELECT
  "gen_ai.session.id",
  "gen_ai.agent.type",
  "user.id",
  "gen_ai.request.model",
  CAST("gen_ai.usage.total_tokens" AS BIGINT) AS total_tokens
FROM log
WHERE "event.name" = 'llm.response'
  AND CAST("gen_ai.usage.total_tokens" AS BIGINT) > 50000
ORDER BY total_tokens DESC
LIMIT 20
These queries directly use the normalized standard field names, regardless of whether the data comes from Claude Code, Cursor, or Codex, the same SQL eat-all-this is the actual value of unified semantic specifications in downstream analysis.
On this basis, you can further build a visual dashboard and consolidate these queries into a dashboard that is refreshed in real time. That's what we're going to discuss next-what key questions can be answered with this data.
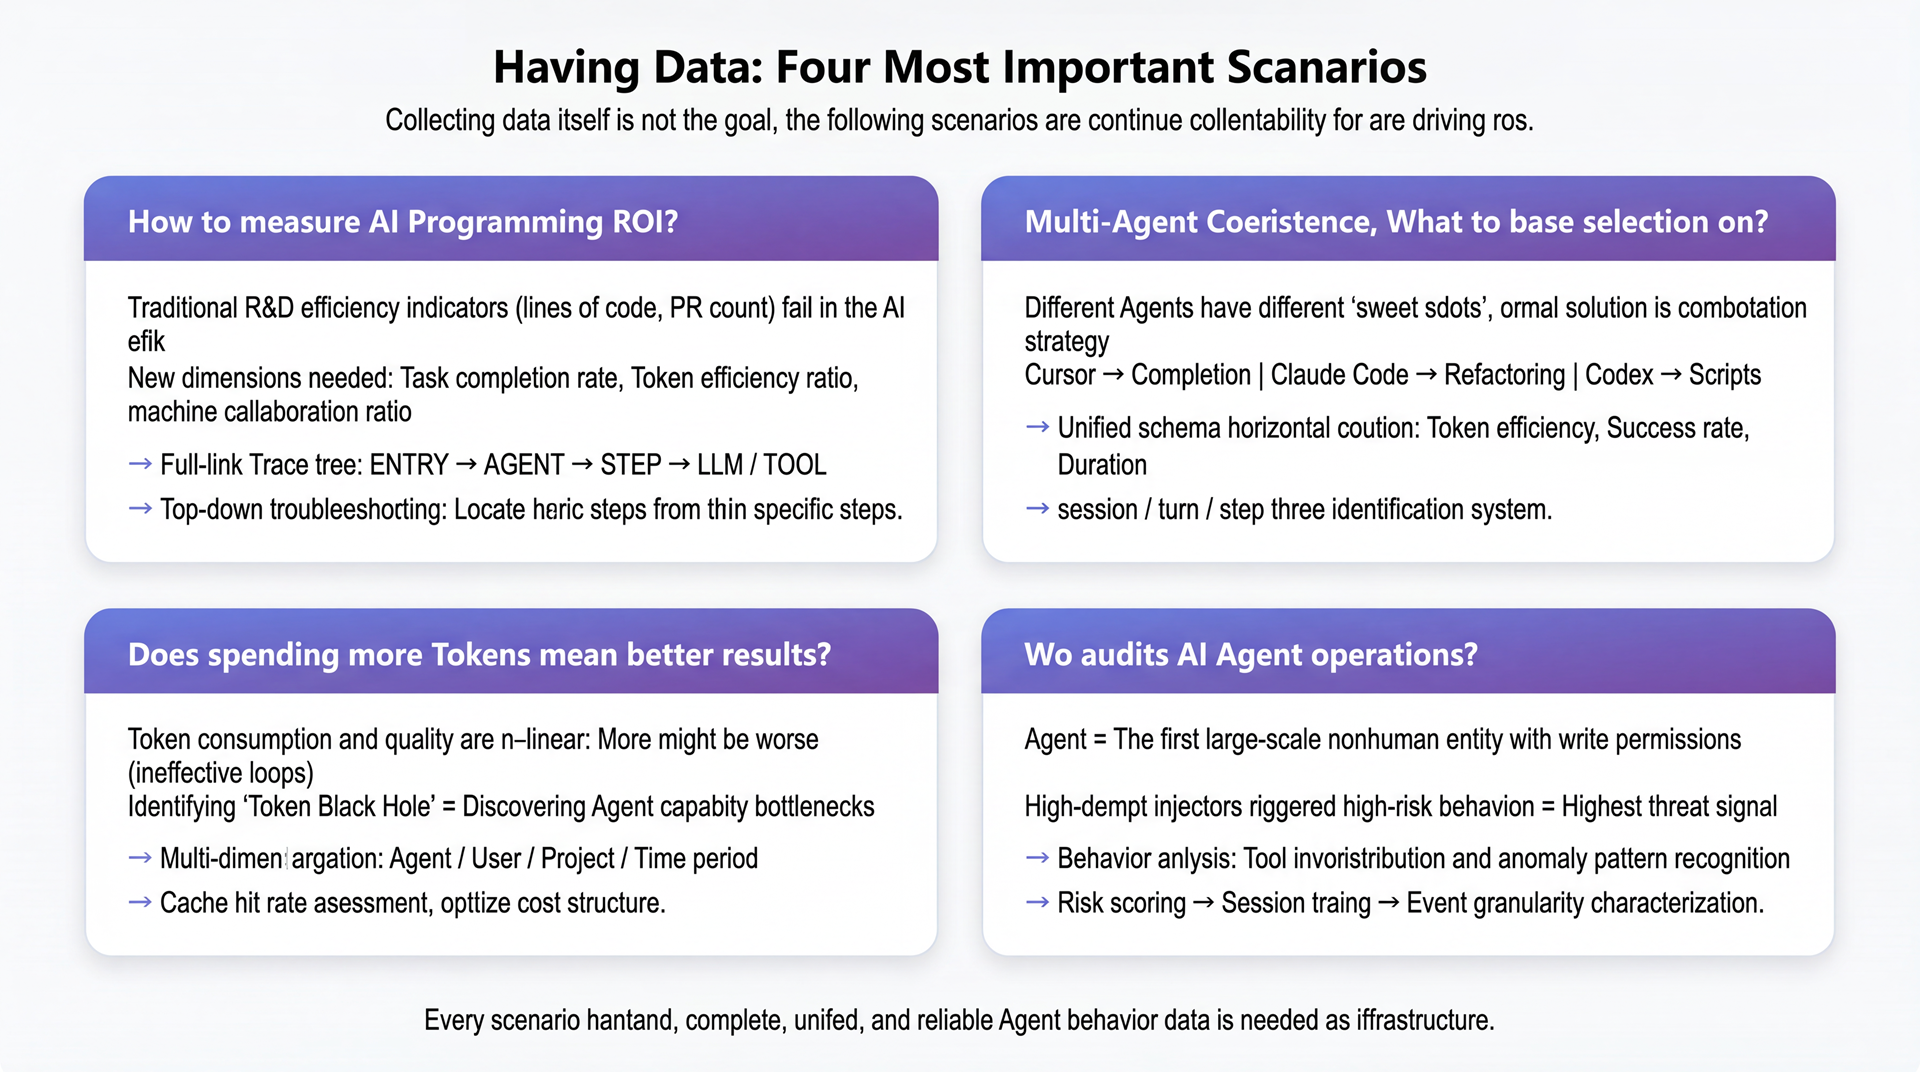
The previous two chapters solved the problem of "how to get data"-from installation and deployment to data collection to SLS query, this link has already run through. But collecting data is not an end in itself. The real value lies in: What questions can these data help us answer that we couldn't answer before?
In actual use, we found that the team's core concerns about AI Coding Agent can be boiled down to four questions. These four questions are also the core motivation that drives our continuous optimization of collection capabilities-every time the discovery that "the existing data is not enough to answer this question" will in turn push us to add new collection fields or expand new agent adaptations.
The investment of enterprises in AI Coding tools is rising rapidly-according to the subscription fee of $20-200 per person per month and the API call fee of million-level Token, a 50-person research and development team can easily exceed one million per year. But when asked "is this money worth it", most teams can't answer it.
Traditional R&D effectiveness metrics are completely ineffective in the AI era. Lines of code? AI writing 500 lines may just be a trial and error in a loop. Number of PR: An Agent session may generate 5 PR, or only 5 sessions may generate 1 valid PR. Commit frequency? AI-generated commits cannot be equated with manually refined commits. What we lack is not indicators, but a data base that can correlate "what AI did" with "what the results were".
The full-link data collected by Pilot makes this association possible. The complete process of each Agent execution task is presented in the form of a trace tree-from the user request entry (ENTRY) to the Agent decision (AGENT), inference step (STEP), LLM call (LLM), and tool execution (TOOL). The hierarchical relationship is clear at a glance:
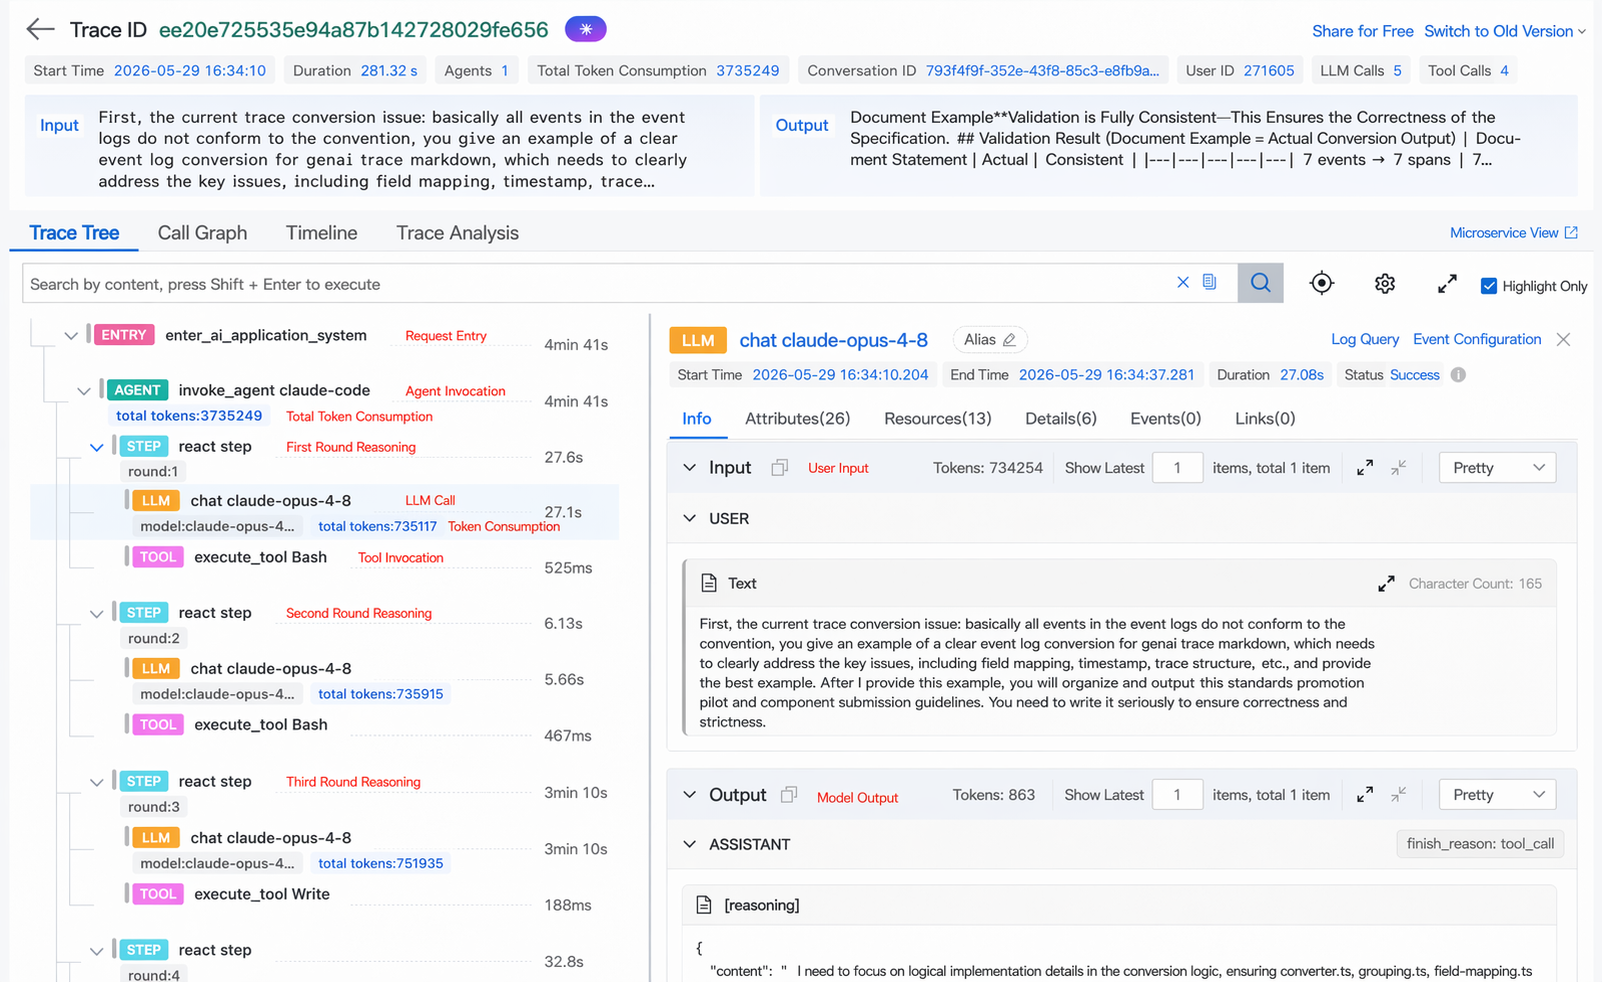
Give a specific example. In a Claude Code session, the user asked to "refactor the authentication module". The Trace tree shows that the Agent has gone through 12 rounds of ReAct inference, of which the first 4 rounds are reading and understanding the existing code (tool calls are mainly Read and Grep), the 5-10 rounds are implementing modifications (mainly Write and Edit), and the 11-12 rounds are running test verification. As can be seen from Step Span, Agent wrote a piece of code in the 7th round but then rewrote it on its own in the 8th round-this "self-correction" consumed about 15% Token, but finally produced the correct implementation.
Aggregating this information, a new ROI measurement system can be constructed.
In a team, some people are used to using Cursor, some people prefer Claude Code, and some people have just started to try Codex. Technical leaders are often asked, "Which one should we use uniformly?" But the question itself is wrong-the correct question is " What agents should be used for what scenarios? ".
When there is no unified data perspective, the team can only "stand in line" by personal sense. And somatosensory is often biased-one's good impression of Cursor may come from a particularly smooth completion experience, ignoring its inefficiency in cross-file refactoring.
Pilot's unified schema makes cross-agent horizontal comparisons possible for the first time. Through the gen_ai.session.id → turn.id → step.id three-level identification system, we can give the same task to different agents or different models under the same measurement framework to observe the real differences in their behavior.
We performed an experiment in which the same task-"Supplementing a unit test for a module"-was assigned to Claude Code, Cursor, and Qoder respectively, and the pilot was used to collect the full-link data of the three executions. The three agents have successfully completed the task. However, the analysis panel of the pilot shows the differences in behavior patterns.
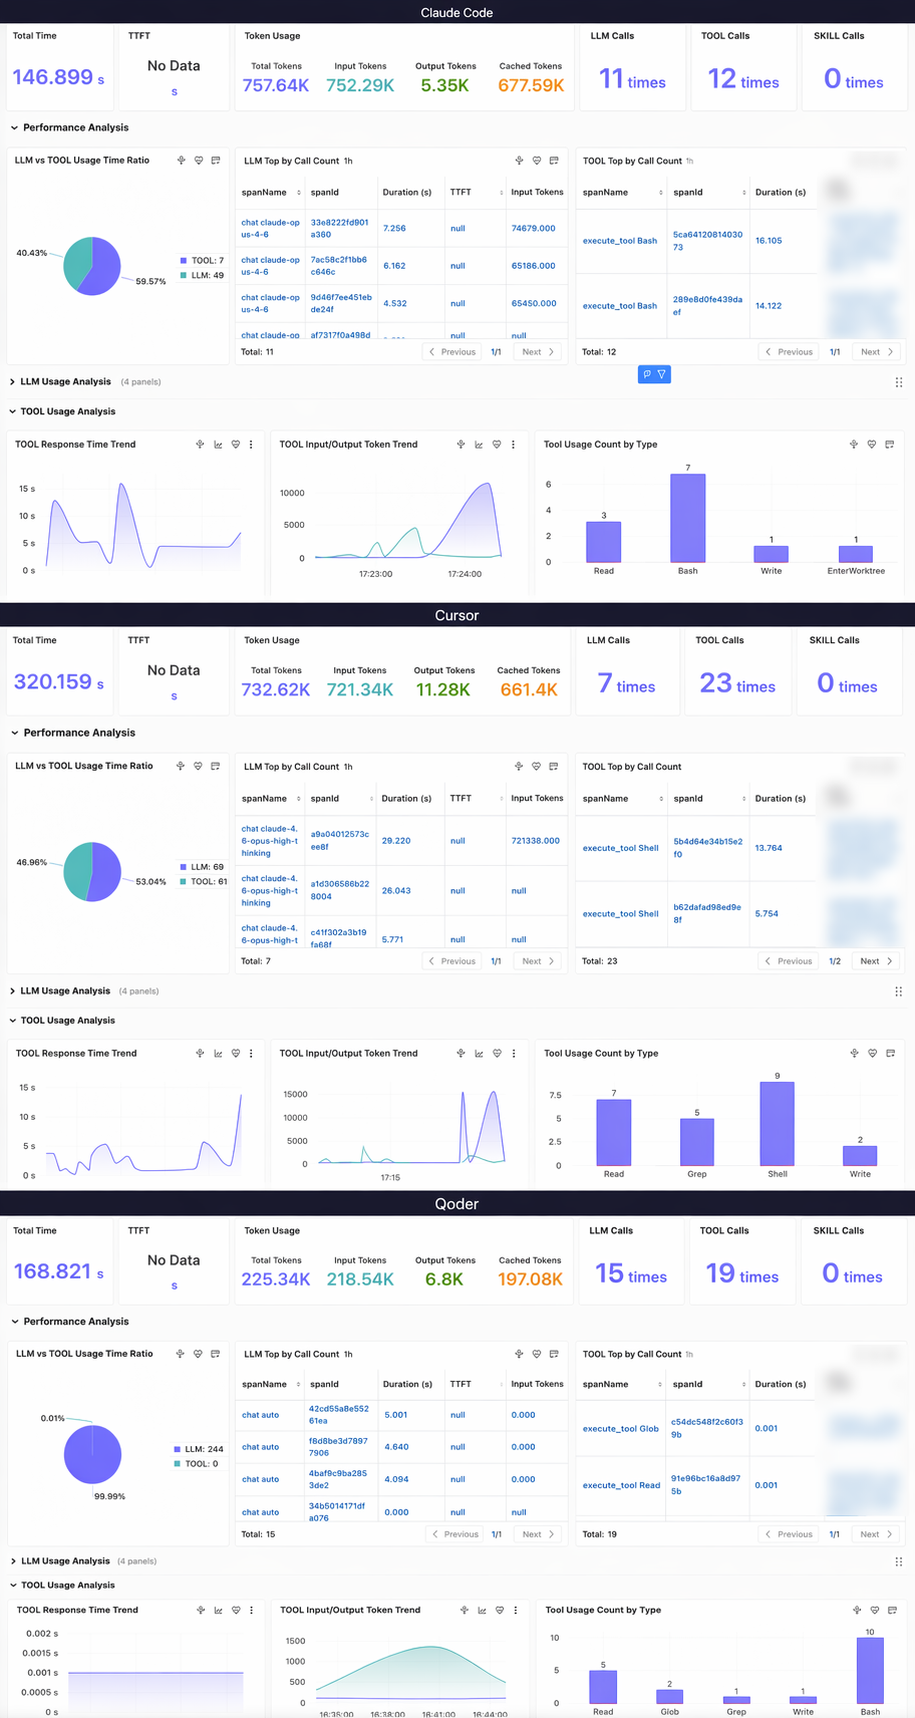
The total Claude Code: time is the shortest, and the LLM single-round inference speed is the fastest. The tool calls are mainly Bash, and the style is like a senior engineer working in a terminal-quickly locate the target file through find and Read, confirm the context and write out the test at a time. LLM reasoning and tool execution take half of the time, indicating that it maintains a good rhythm between "thinking" and "action".
Cursor: LLM has the least number of calls but the longest single round of reasoning-it enables high-thinking mode, and each round is doing deeper reasoning. The tool calls are the most diverse (Shell + Read + Grep + Write), presenting a typical "search-read-understand-write" four-step workflow, more like a developer working in an IDE. Although it takes the longest total time, it also outputs the most tokens and generates more detailed test code. It is suitable for scenarios that require deep understanding and high code quality.
Qoder: Token consumption is much lower than the other two, context management is the most compact. The most notable feature is that the tool duration is almost zero-all tool calls are lightweight APIs (Glob, Read), and almost all of the time is spent on LLM inference. LLM calls the most rounds but the slowest single-round reasoning, showing a "small step run" style-each round of processing has a smaller context and progresses through more rounds. It is suitable for scenarios that are sensitive to the cost of tokens or require frequent iterations.
These differences are completely submerged in the subjective impression of "feeling the same" before there is no unified data collection. The real value is not to draw a universal conclusion, but to let each team find its own "sweet spot" based on its own actual data-because the optimal solution not only varies by agent, but also by the team's technology stack, code base characteristics and working methods. The final answer is often not A vs B vs C, but a set of data-driven agent combination strategies.
This is the most counter-intuitive phenomenon we have found in practice: the token consumption and output quality have an obvious non-linear relationship. In most cases, sessions that consume the most tokens have the worst output quality.
We traced a set of real cases and found three typical "token black hole" patterns:
Mode 1: cyclic trial and error. Agent tries a solution → fails to run the test → changes the solution → fails again → repeatedly loops. The trace tree is represented as a large number of consecutive STEP. Each STEP contains a tool call pair of Write + Bash(test), but the Bash result always contains error output.
Mode 2:Context expansion. As the conversation becomes longer, the context carried by each round of conversation becomes larger and larger, resulting in a stepped increase in input_tokens. This growth is sometimes necessary (complex tasks require a large amount of context), but more often it is due to the lack of effective context management-the Agent takes all the complete output of the previous round into the next round, and most of the information is no longer relevant.
Mode 3:Excessive caution. Agent spends a lot of Token to confirm and reason repeatedly before execution, and "thinking" accounts for far more than "action". In the trace tree, the token consumption of LLM Span accounts for more than 80%, while TOOL Span accounts for very few.
Based on fields such as gen_ai.usage.input_tokens, gen_ai.usage.output_tokens, gen_ai.usage.total_tokens, and gen_ai.usage.cache_read.input_tokens, you can build a multi-level cost visualization:
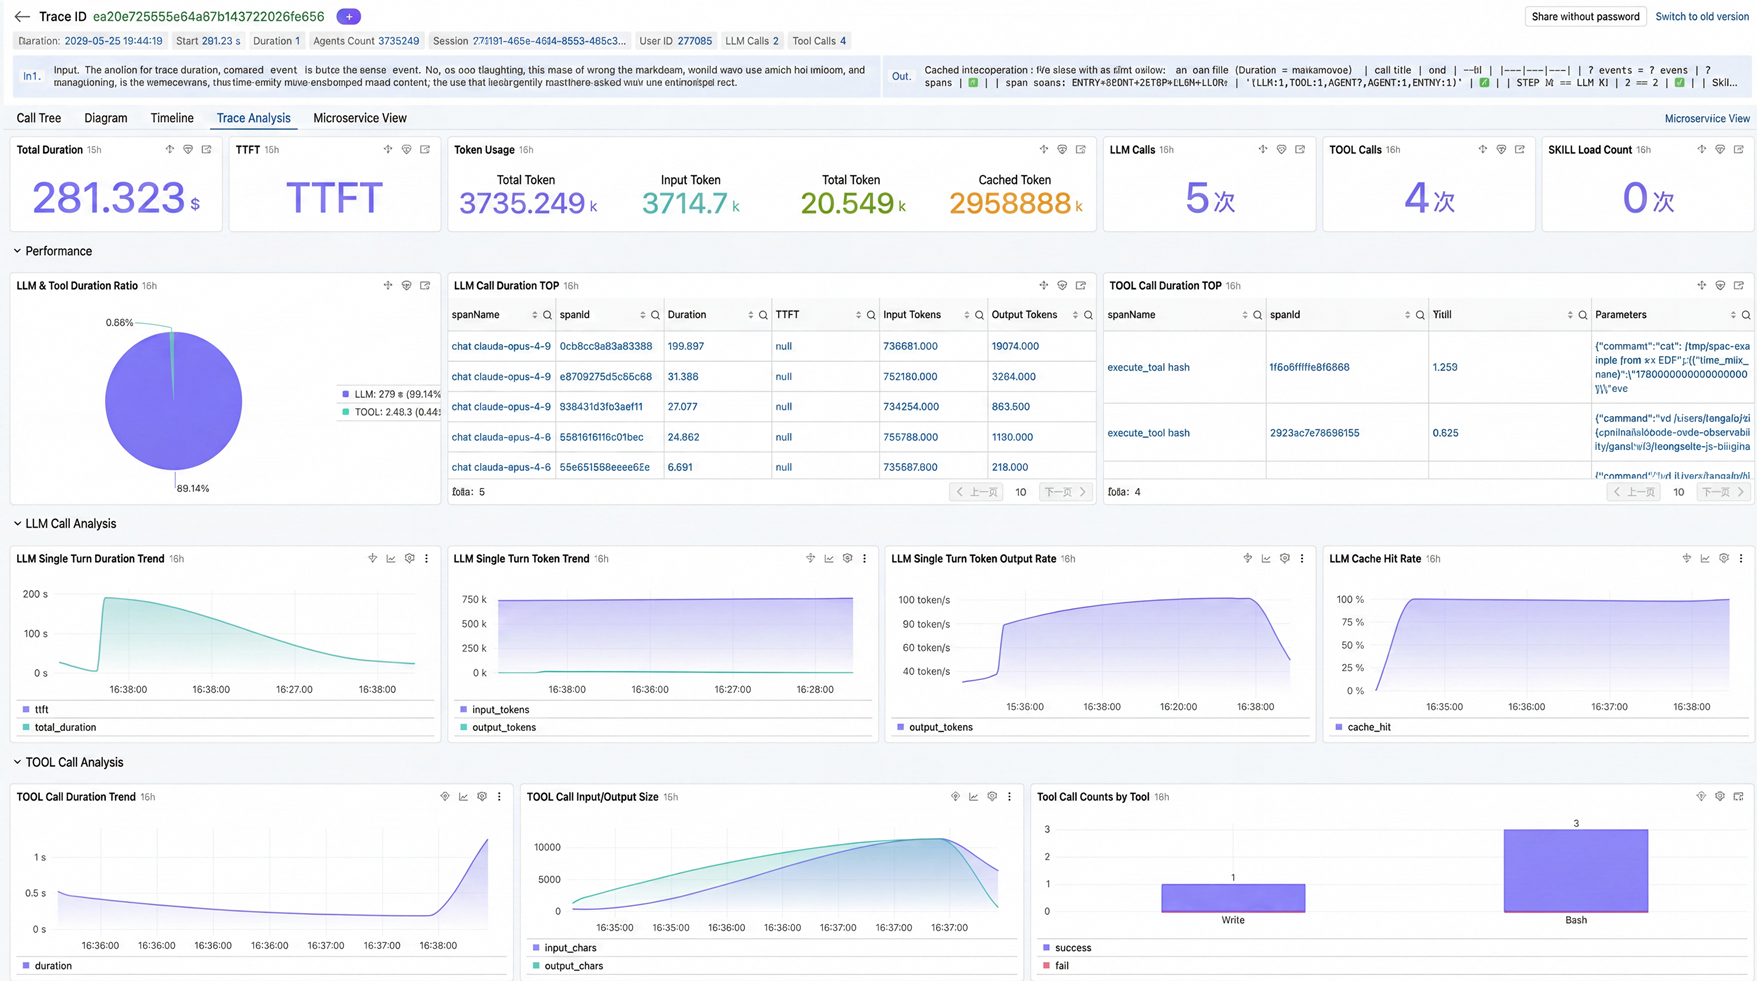
The value of identifying these patterns is not only in cost optimization-they are essentially signals to the boundaries of agent capabilities. Which task types are likely to trigger cyclic trial and error? Which code base context management needs to be optimized? Which scenarios should be decisively switched to manual intervention? These decisions used to rely on intuition, but now they are supported by data.
The first three issues are related to efficiency and cost, and this issue is related to the bottom line of safety.
We are witnessing an unprecedented phenomenon: AI agents are the first large-scale non-human entities in human history to have code write permissions. A single agent can modify dozens of files, execute dozens of shell commands, and access hundreds of code paths in minutes. More critically, the initiators of these operations are not people-they are the decisions made by the model based on probabilistic reasoning, and the model can be manipulated.
Prompt injection is one of the most serious security threats facing AI agents. Attackers can implant malicious instructions into code comments, issue descriptions, and even file content to induce agents to perform unexpected operations, such as deleting critical files, disclosing environment variables, and sending sensitive data to external addresses. These operations appear to be indistinguishable from normal tool calls in the log, and are almost unrecognizable by traditional security auditing methods.
This is the value of full-link behavioral data. Based on the complete Agent behavior data collected by Pilot, a multi-layer security audit system from management to investigation can be constructed:
Layer 1: audit management and run time monitoring. All connected agent applications (Claude Code, Cursor, Codex, and Qoder) are included in a unified audit management view. The active trends of each application are clear at a glance. At the same time, AI system run time audit is enabled to monitor the types and behavior status of agents running on each host in real time.
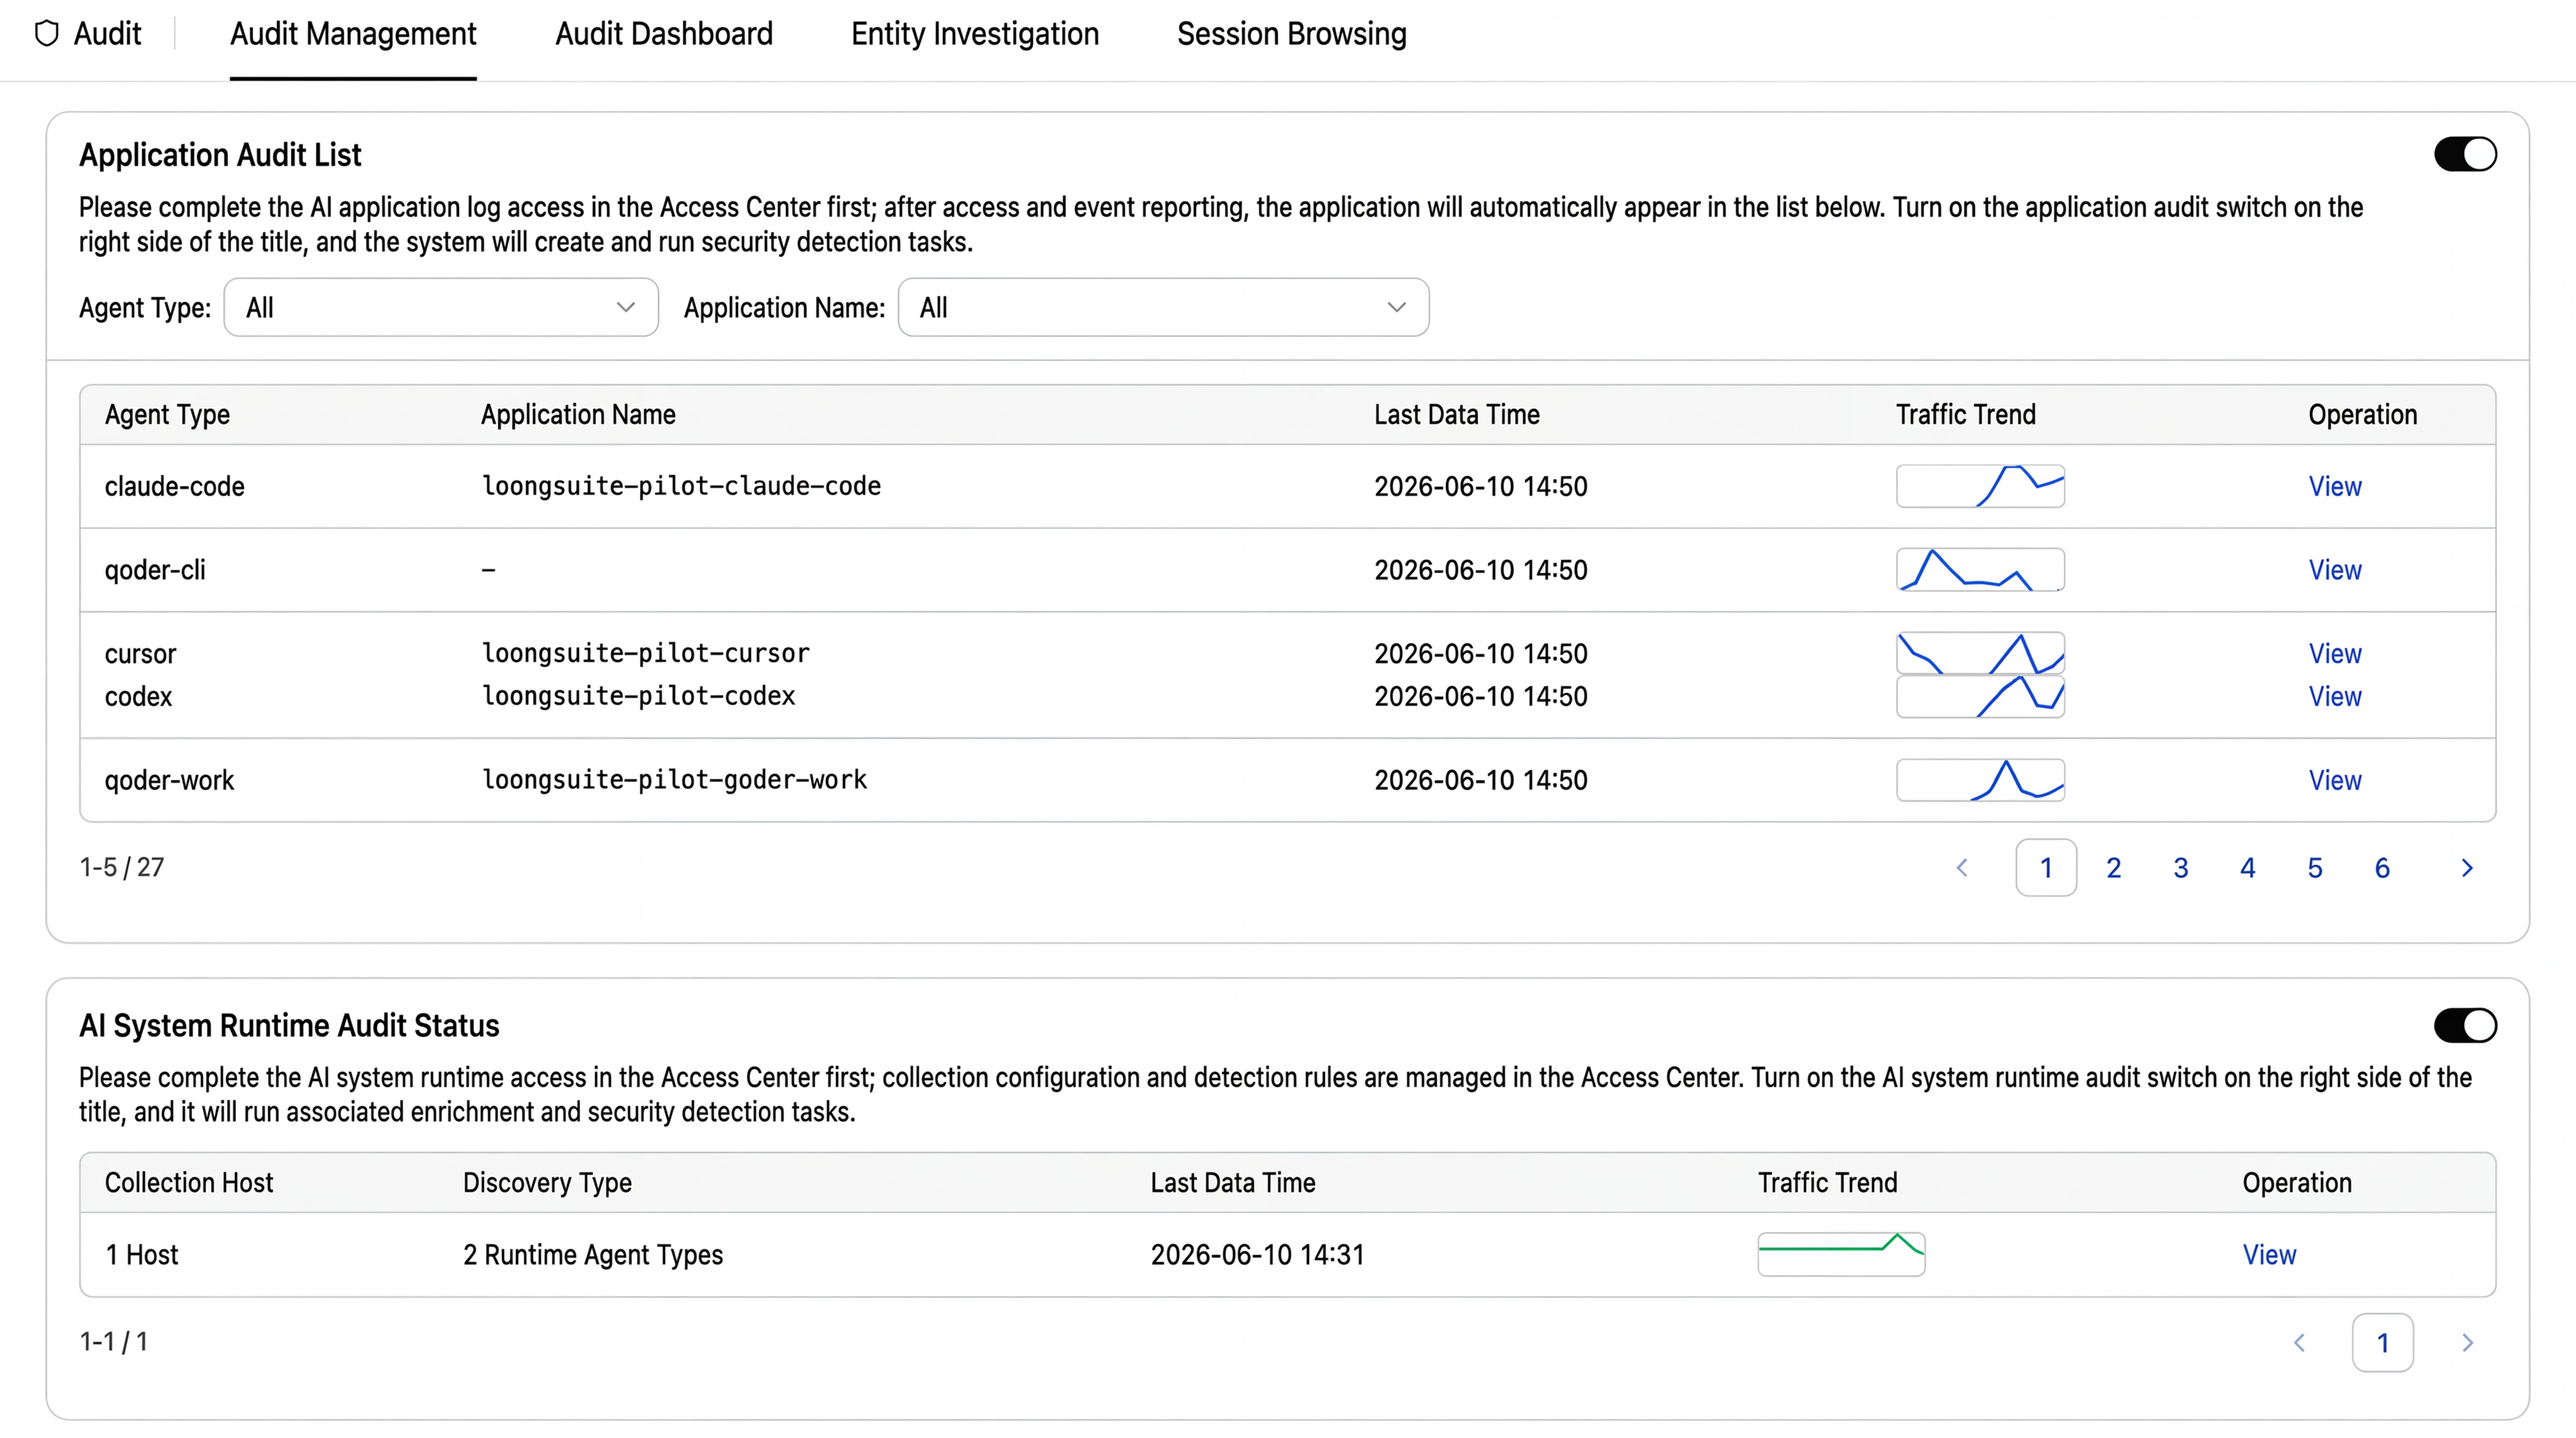
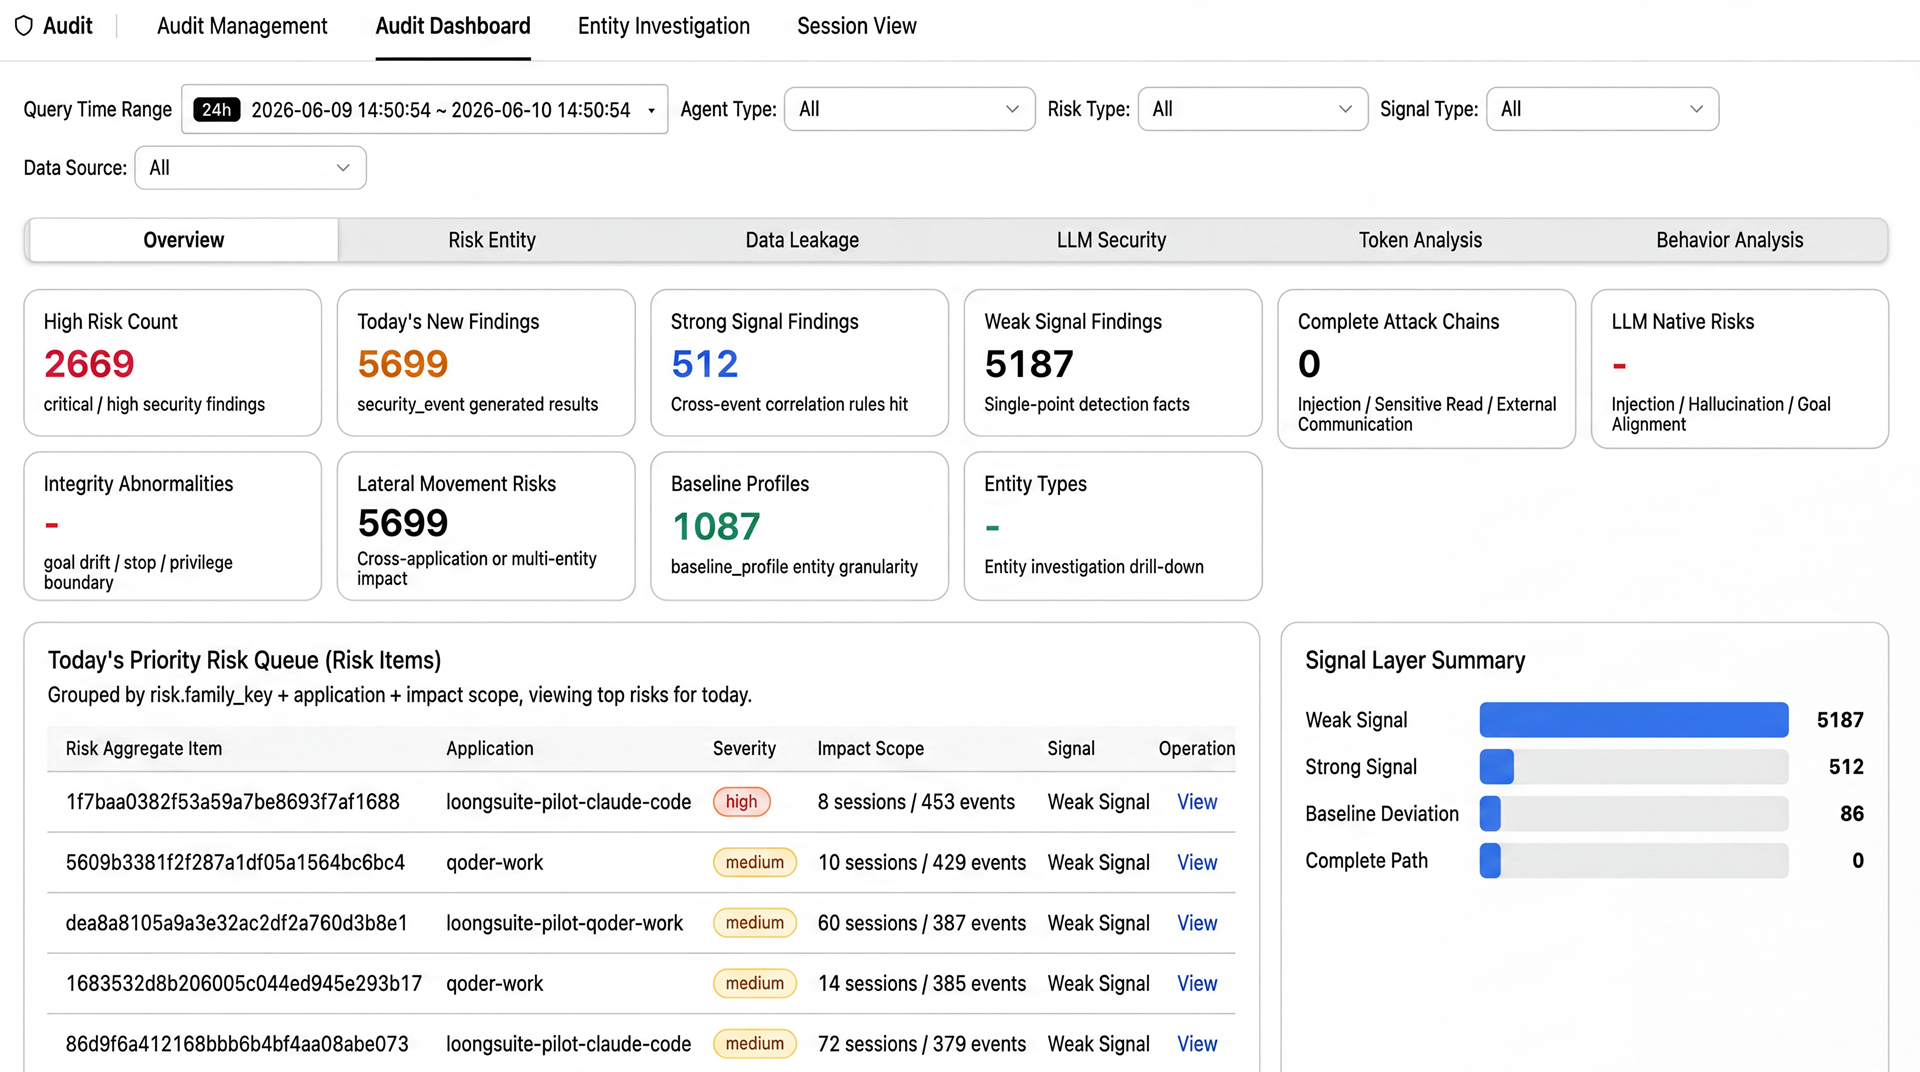
Layer 2: risk situation dashboard. Global view displays core metrics such as the number of high-risk events, the number of operations performed today, the number of sensitive writes, and the total number of security events. Quickly determine the current security situation through the hierarchical summary of signals (high /medium /low). Today's prioritized risk queues are automatically sorted by application and severity, placing the risk items that need the most attention at the top.
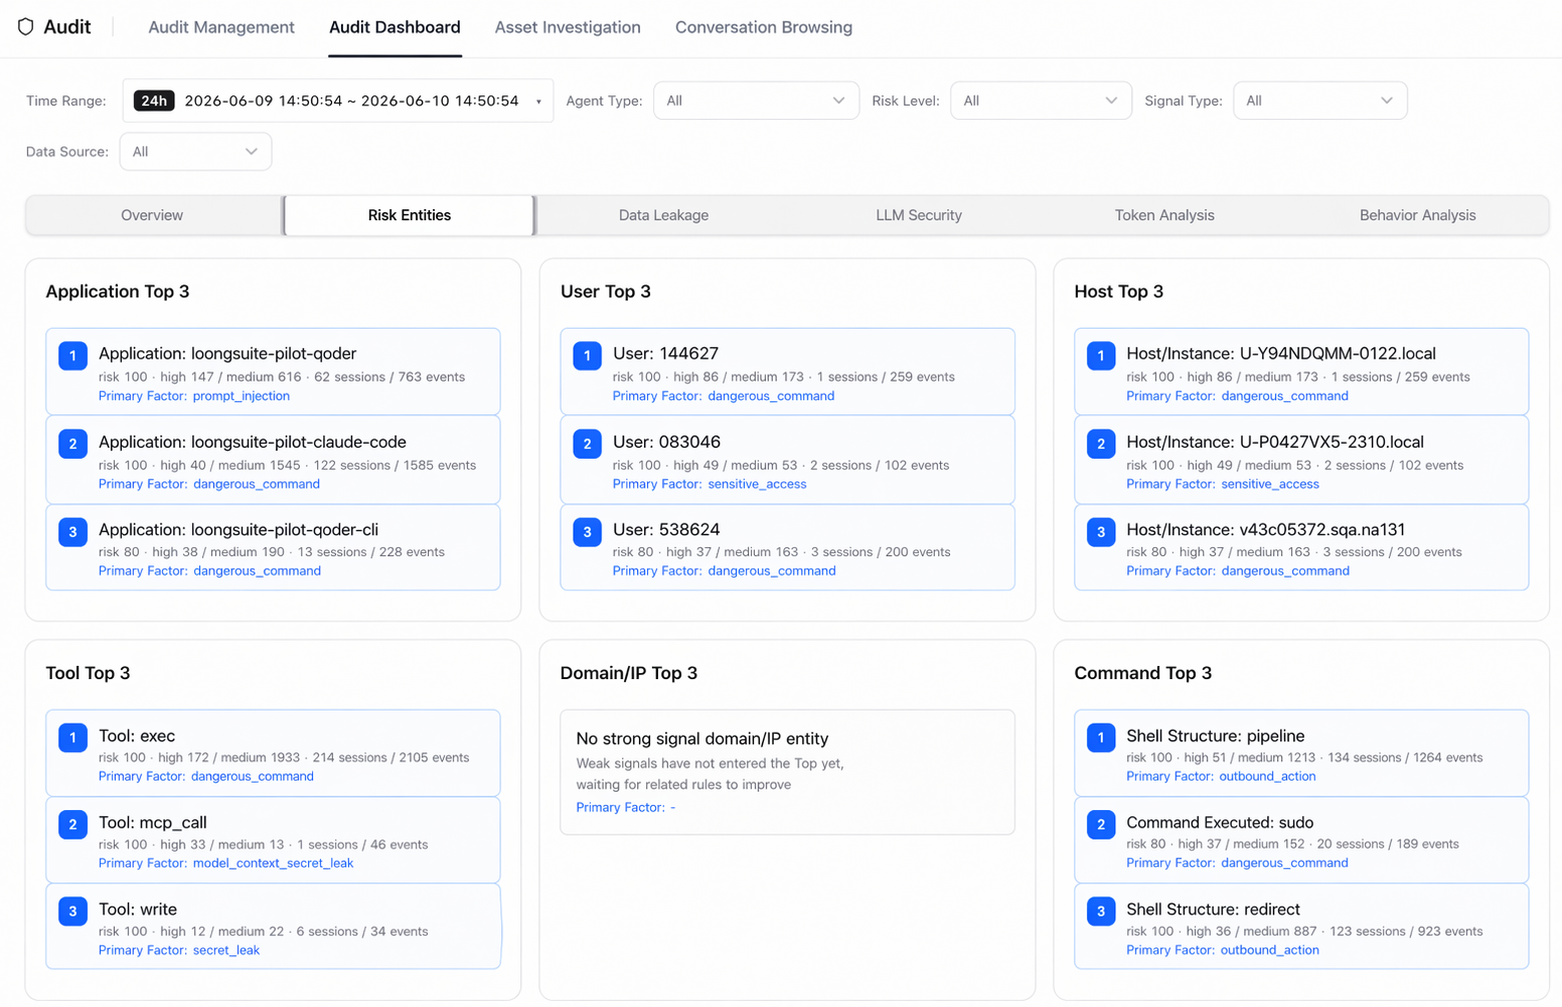
Layer 3: risk subject positioning. The top three risk entities are listed from six dimensions, including application, user, host, tool type, external domain name /IP address, and command. Each subject is labeled with its main risk label (such as dangerous_command, sensitive_access, and model_context_secret_leak) to help the security team quickly target the objects that need to be focused on.
Layer 4: data breach link analysis. This is the most critical in-depth analysis perspective. Data transmission risks are divided into three links: attack-driven transmission links (data theft triggered by malicious instructions), model context leakage links (sensitive information flows through the model context), and sensitive data type distribution (data types involved in identification, such as keys and credentials). The leak detection queue presents all suspicious DLP incidents in a centralized manner, correlating outgoing links, context overflow, and sensitive data matching results to support quick characterization.
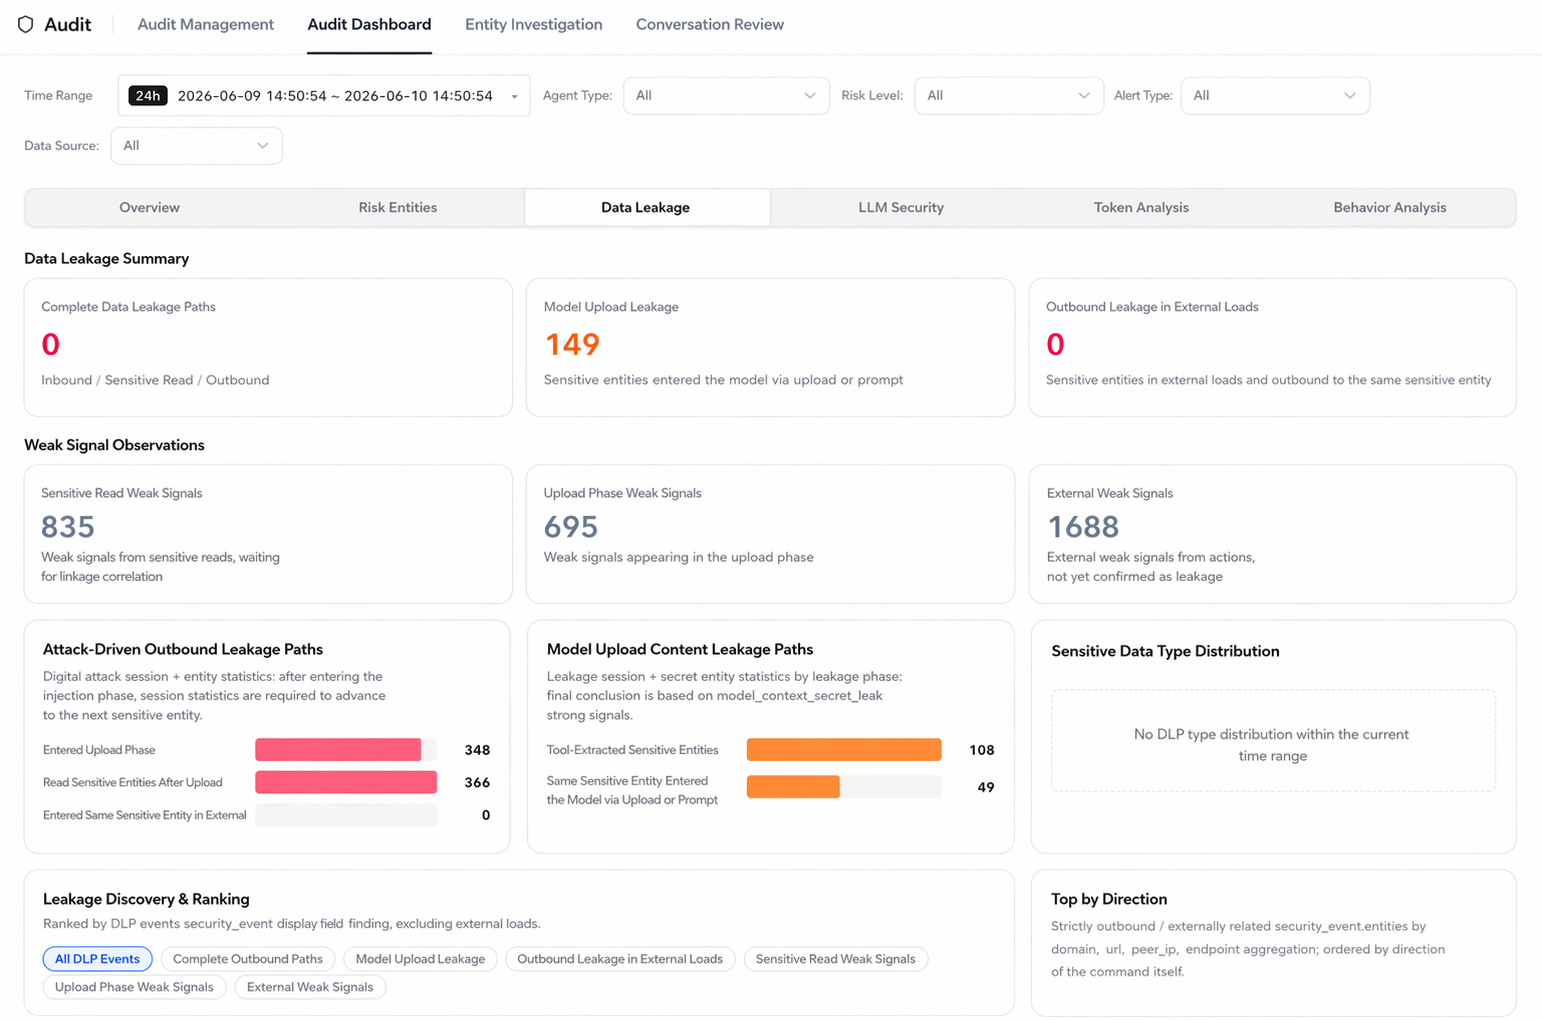
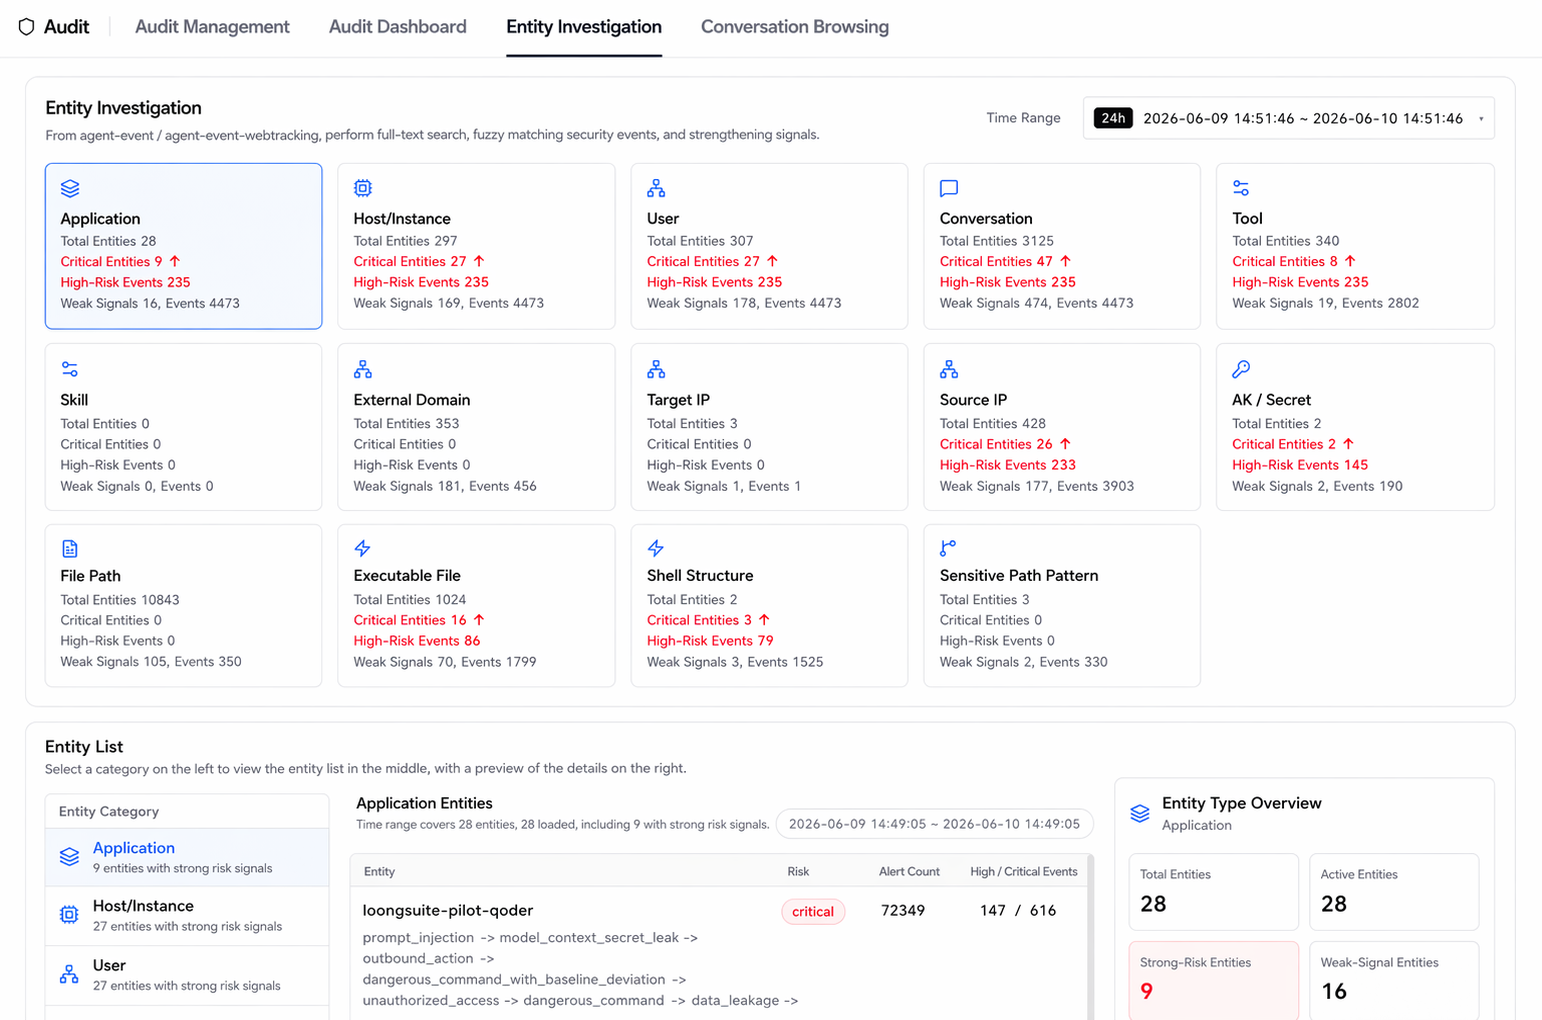
Layer 5: entity association investigation. After the suspicious target is locked, enter the entity investigation view. This view displays all entities involved in Agent behaviors-applications, hosts, users, sessions, tools, external domain names, target IP addresses, AK/Secret, file paths, commands, and sensitive path patterns-in a panoramic manner. The proportion of abnormal quantities for each entity type is marked. After you drill down to a specific entity, you can see the complete behavior profile and associated security events for that entity.
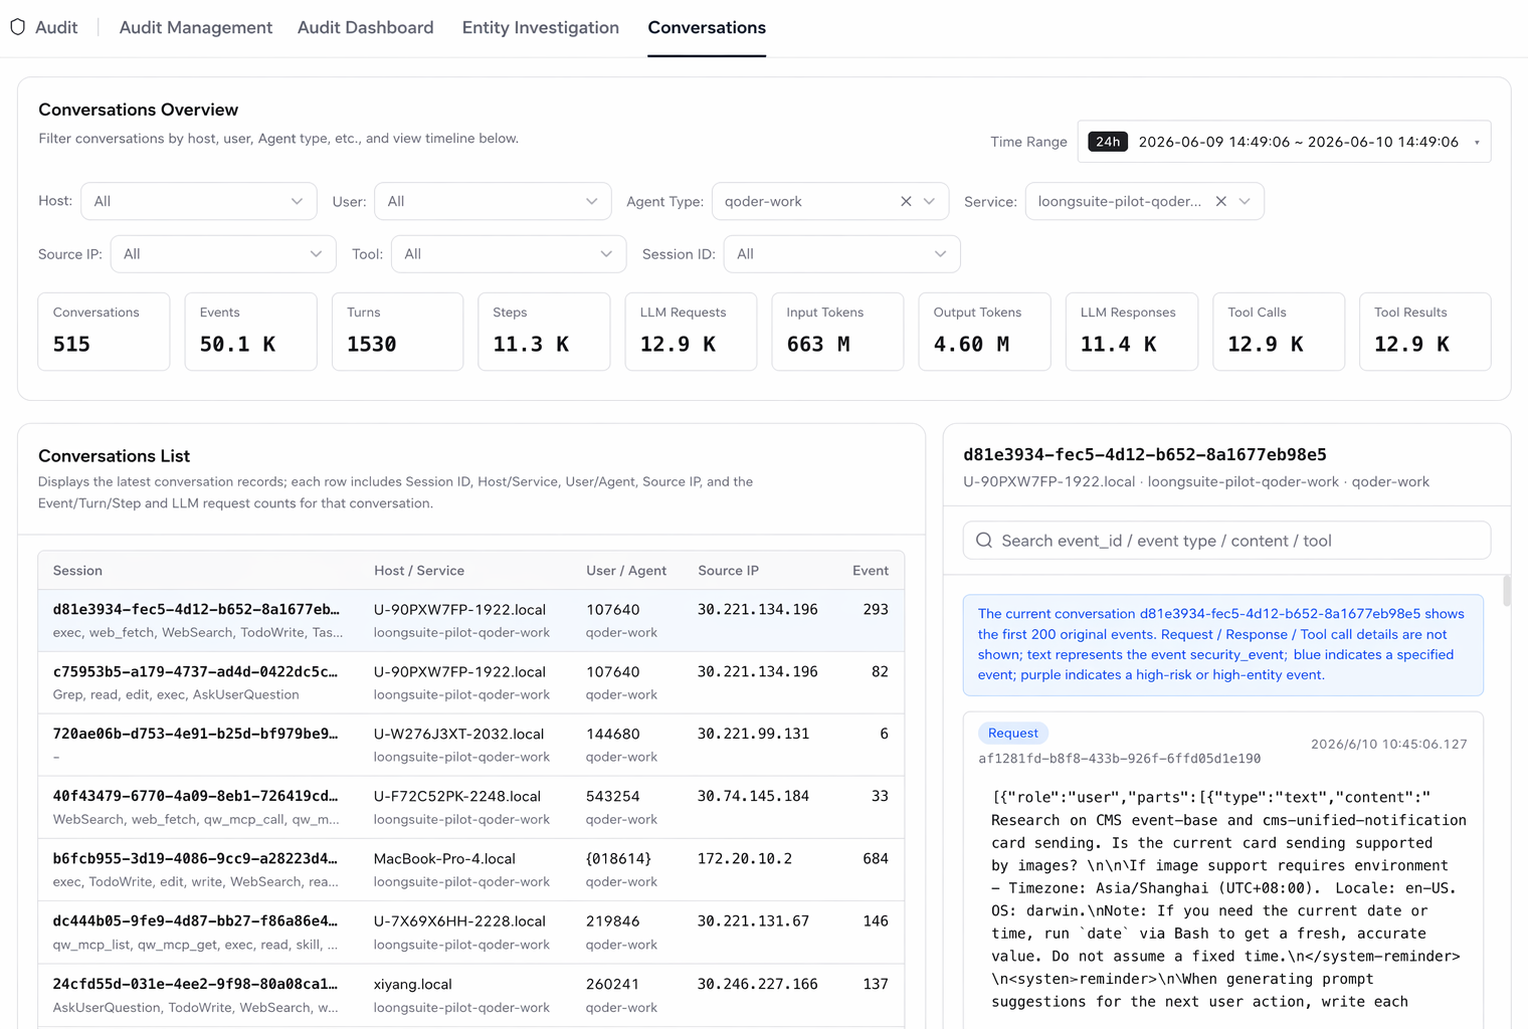
Layer 6: Session-level tracing. Eventually, all surveys converge to a specific session. The complete event timeline is displayed in sessions-the type, parameters, involved tools, and complete context of each event are at a glance. The security team can replay the behavior trajectory of the agent on an event-by-event basis to accurately determine whether it is a normal operation or an abnormal behavior driven by malicious instructions, providing original evidence for the final characterization.
Today, we are officially LoongSuite Pilot open source. As an extension of the LoongSuite observability suite on the end side, Pilot complements the observability blind area of AI Coding Agent-making the behavior of agents running on the developer's local, like the model calls and infrastructure metrics on the server side, be collected, queried, and analyzed.
Also welcome to follow other open source projects of the LoongSuite ecosystem:
What we plan to do next:
How to participate:
agents.d/ under Declarative Files and Existing ImplementationsAI Coding Agent are redefining how software is developed. We believe that observability is the critical infrastructure that allows these agents to move from "usable" to "useful"-and that infrastructure should be open, standardized, and community-owned.
Electron Monitoring: Making Desktop Agent Monitoring Accessible
Can the Log Be Changed? SLS Logstore Adds Native Support for Log Updates and Deletes

756 posts | 60 followers
FollowAlibaba Cloud Native Community - June 10, 2026
Alibaba Cloud Native Community - July 16, 2026
Alibaba Cloud Native Community - July 30, 2026
Alibaba Cloud Native Community - September 8, 2025
Alibaba Cloud Native Community - January 19, 2026
Alibaba Cloud Native Community - April 15, 2026
756 posts | 60 followers
Follow Managed Service for Prometheus
Multi-source metrics are aggregated to monitor the status of your business and services in real time.
Learn More Qwen
Qwen
Full-range, open-source, multimodal, and multi-functional
Learn More Token Plan
Build more, spend less. One plan, every modality.
Learn More
Alibaba Cloud Model Studio
A one-stop generative AI platform to build intelligent applications that understand your business, based on Qwen model series such as Qwen-Max and other popular models
Learn MoreMore Posts by Alibaba Cloud Native Community

