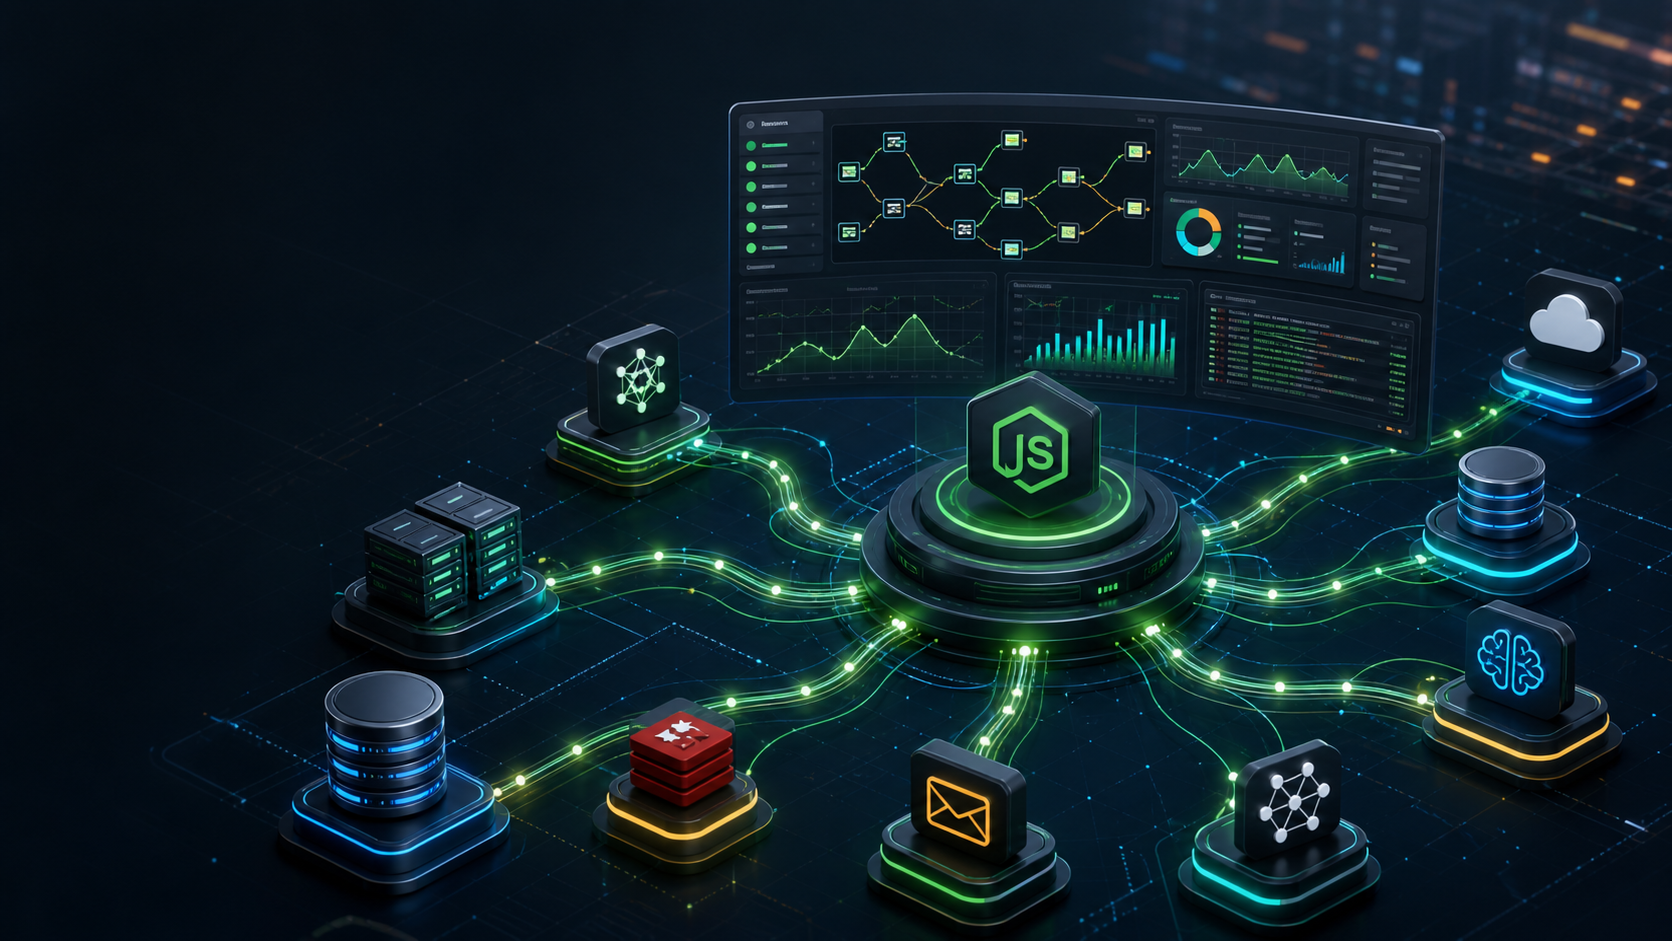
Today's development teams are not short on server-side monitoring.
You probably already have logging platforms, basic metrics, and APM tools in place. The real headache isn't a lack of data; it's whether you can put all this data into the same context when an issue arises.
For example, a user complains: "The AI assistant took forever to answer this time."
You check the entry API and find the response time is indeed high. You check the database—no slow SQL queries. You check Redis—the hit rate is normal. You sift through logs—no errors. Digging deeper, the root cause might be hiding in a LangChain tool call, a sudden spike in the model's time-to-first-token (TTFT), or perhaps the Node.js event loop was blocked for 200 ms by a piece of synchronous logic.
Server-side monitoring is common, but modern Node.js services do much more than just "receive requests, query databases, and return JSON." They increasingly serve as Backend for Frontend (BFF), API gateways, real-time communication hubs, queue consumers, and AI Agent orchestration layers. A single request might simultaneously traverse HTTP, databases, caches, RPCs, message queues, runtime resources, and LLMs.
Therefore, this article won't debate whether you need server-side monitoring. The answer is an obvious yes.
What we really want to discuss is this: When a Node.js application becomes the convergence point for business traffic, asynchronous orchestration, and AI invocations, how can you use a single agent to integrate entry requests, dependency calls, runtime states, log contexts, and AI invocations into a unified troubleshooting trace?
It's not that server-side monitoring doesn't exist, but rather that the problems teams need to solve have changed.
First, Node.js is becoming a "trace convergence layer," and issues are no longer confined to a single API.
Many enterprises use Node.js for BFFs, API gateways, frontend-backend adaptation layers, and AI service orchestration. While it might not be the heaviest business system, it often stands directly between user experience and backend dependencies. If the entry point slows down, users immediately perceive the Node.js service as slow, yet the root cause might lie in the database, cache, downstream RPC, message queue, or model invocation.
Making matters more complex, Node.js is inherently built around Promises, async/await, timers, callbacks, and the event loop. After a user request enters the service, it might cross multiple asynchronous boundaries before accessing databases, caches, or downstream services. If the trace ID gets lost across an async/await boundary, the trace breaks into pieces, leaving you with nothing but isolated spans and scattered logs.
Second, runtime health is increasingly impacting business experience.
A slow API isn't always caused by slow SQL. It could be due to the event loop being blocked by synchronous tasks for 200 ms, a continuous spike in V8 heap memory, garbage collection (GC) jitter, abnormal CPU usage, or process resource exhaustion. Traditional API logs struggle to answer whether the Node.js runtime itself is healthy.
Third, AI applications bring new observability targets.
More and more Node.js services are beginning to host AI capabilities. A single request isn't just HTTP + DB anymore; it might involve OpenAI calls, LangChain/LangGraph orchestration, streaming generation via the Vercel AI SDK, tool calls, embeddings, and RAG retrievals. Without AI-native observability, developers struggle to figure out if the bottleneck is in the model, the tools, the retrieval, or their own business logic.
Fourth, combining multiple tools introduces new costs and complexities.
Traditional APMs excel at APIs and databases but often overlook AI calls. AI observability tools are great at prompts, tokens, and model traces, but typically lack runtime metrics and core APM features. Meanwhile, a self-managed OpenTelemetry setup requires you to maintain exporters, plugins, sampling strategies, resource attributes, and console capabilities. As you stitch more tools together, troubleshooting paths and operational costs multiply.
This is exactly where the Node.js agent provides value. It isn't just another monitoring tool offering raw data; it is a one-time integration that brings traditional APM, AI observability, runtime health, and production configuration operations into a single troubleshooting loop.
Our solution is the Alibaba Cloud ARMS Node.js agent. Built on the core OpenTelemetry data model, it is seamlessly integrated end-to-end with ARMS. Its core design philosophy can be summarized in one sentence:
One integration, automatic instrumentation before the business code runs, effortlessly connecting your Node.js application's traces, metrics, logs, and context propagation.
The integration package is named @loongsuite/cms_node_sdk (where "cms" is a legacy naming convention), but on the product side, it functions as the ARMS Node.js agent package.
For CommonJS projects, you can use the preloading method:
ARMS_APP_NAME=your-app \
ARMS_REGION_ID=cn-hangzhou \
ARMS_LICENSE_KEY=your-license-key \
node -r @loongsuite/cms_node_sdk/register app.js
For ESM projects, you can use the Loader method:
node --experimental-loader=@loongsuite/cms_node_sdk/import-hooks app.mjsIf you prefer explicit lifecycle management within your code, you can also use the programmatic approach:
const { NodeSDK } = require('@loongsuite/cms_node_sdk');

const sdk = new NodeSDK({
  serviceName: 'your-app',
  licenseKey: 'your-license-key',
  regionId: 'cn-hangzhou',
  workspace: 'your-workspace',
});
sdk.start();
Additional configurations, such as sampling strategies, plugin toggles, and resource attributes, can be added on demand during programmatic initialization.
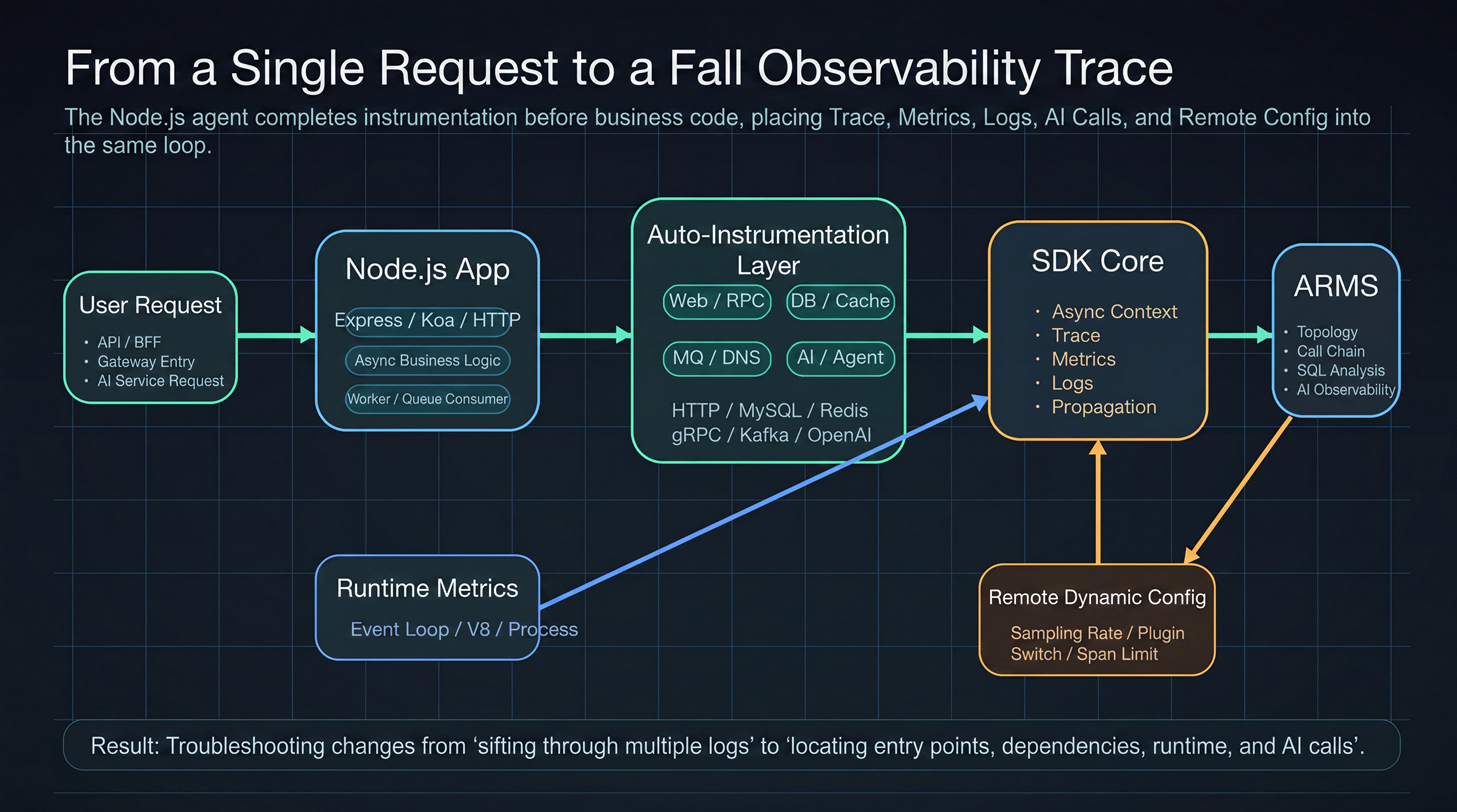
During startup, the agent performs several key initialization tasks: creating the Context Manager, Tracer, Propagator, Exporter, Meter, and Log Manager, and registering built-in auto-instrumentation plugins.Thereafter, as requests enter the application, database queries are executed, downstream services are called, and runtime metrics are triggered, all this telemetry is mapped to a unified observability data model and reported to ARMS, while generated logs are seamlessly injected with trace contexts for end-to-end correlation.
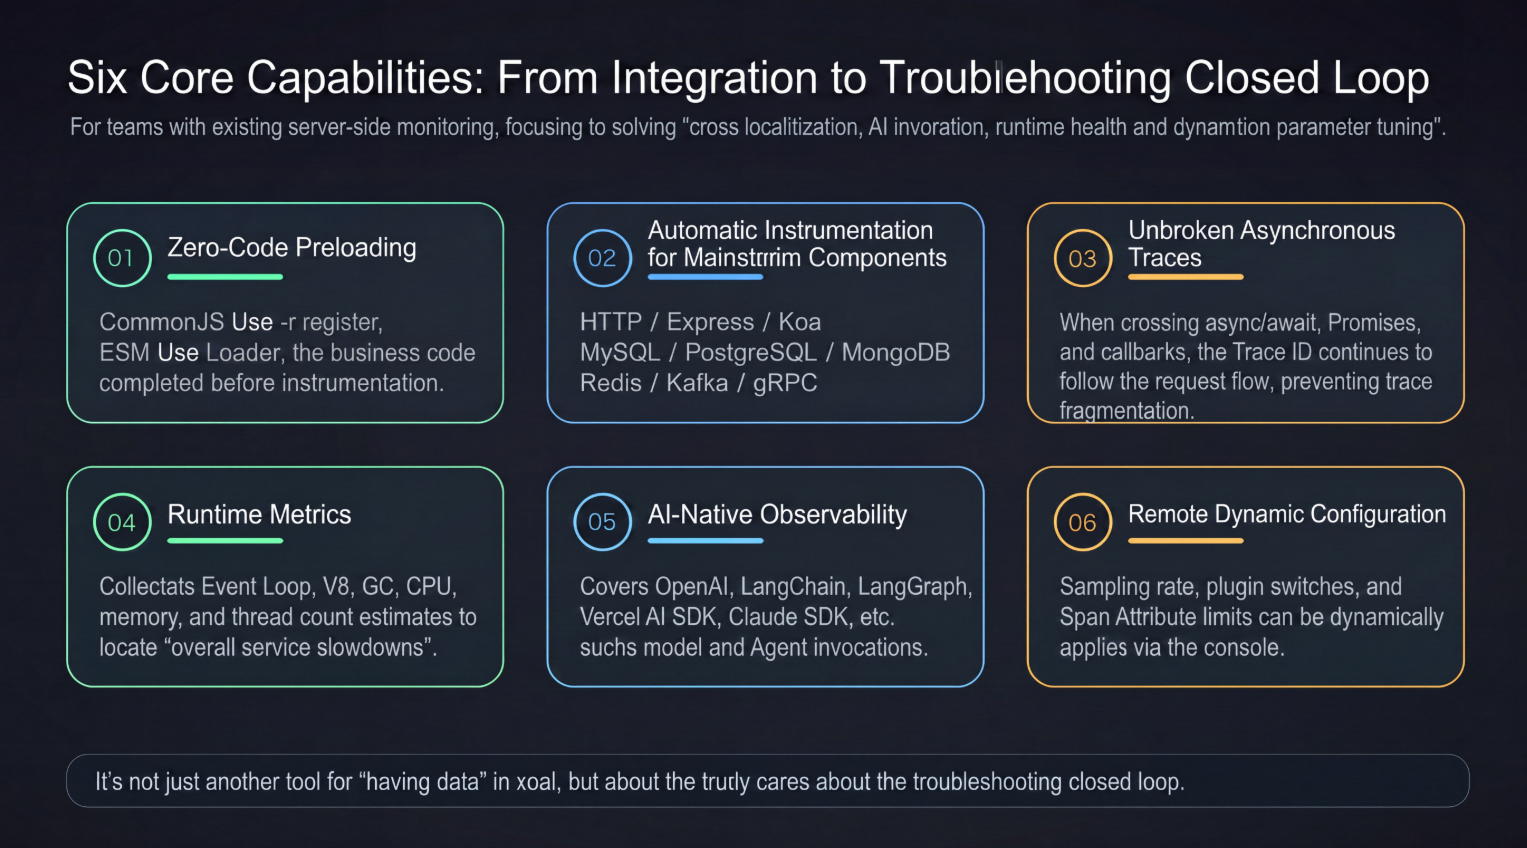
For many production systems, the hardest part of integrating monitoring isn't "writing a few lines of code," but rather ensuring it doesn't alter business logic, impact the startup method, or disrupt the existing engineering structure.
The ARMS Node.js agent supports two mainstream integration paths:
| Project Type | Recommended Method | Characteristics |
|---|---|---|
| CommonJS Projects | node -r @loongsuite/cms_node_sdk/register app.js |
Automatically loads the agent before business code execution. |
| ESM Projects | --experimental-loader=@loongsuite/cms_node_sdk/import-hooks |
Injects automatically during the module loading phase. |
| Projects Requiring Fine-Grained Control | new NodeSDK(...).start() |
Allows customization of sampling, exporters, plugins, and resource attributes. |
This means whether you're running a traditional Express/Koa service, a BFF, a gateway, or an ESM project, you can choose the integration method that fits best.
The ESM mode uses import-in-the-middle to achieve module interception and supports automatic instrumentation for ESM dependencies. If your project contains a complex combination of loaders, we recommend verifying the module loading sequence in a testing environment first.
A special note: If you opt for the programmatic approach, the agent must be initialized before any business modules are imported or required. This ensures that HTTP, database, cache, and other modules are properly instrumented during the loading phase.
The call chain of a Node.js application is rarely a single HTTP request; it's a web composed of frameworks, middleware, databases, caches, RPCs, and message queues.
The ARMS Node.js agent comes with built-in automatic instrumentation covering core server-side paths:
| Category | Supported Targets |
|---|---|
| Web and Network | HTTP/HTTPS, Express, Koa, Undici, Net, DNS |
| RPC and Real-Time Communication | gRPC, Socket.IO |
| Database | MySQL, MySQL2, PostgreSQL, MongoDB, Mongoose |
| Cache | Redis, ioredis |
| Message Queue | Kafka |
When a request enters the application, the agent automatically creates a server-side span. As the request proceeds to access a database, a cache, or a downstream HTTP service, these child calls are merged into the same trace. There is no need to manually add instrumentation points throughout your business code, let alone rush to patch them after an incident occurs.
For logging scenarios, the agent injects the trace context into logging outputs like Console, Pino, Winston, and Bunyan, allowing logs and traces to be queried together within the same context.
On the ARMS console, you can view the complete path of a request from entry to downstream dependencies. Which API was slow? Which SQL query dragged? Which Redis operation was too frequent? Which downstream service timed out? Everything appears in a single, unified context.
Node.js's asynchronous model is a boon for service performance, but it's a major hurdle for distributed tracing.
The ARMS Node.js agent uses AsyncLocalStorage by default to manage context. In preload mode, it automatically downgrades to the AsyncHooks solution for older runtimes that do not support AsyncLocalStorage. It preserves the current span across asynchronous boundaries, ensuring that sub-operations within Promises, async/await, callbacks, and timers can still find their parent traces.
Additionally, the agent features built-in support for W3C Trace Context and Baggage propagation. Entry requests can extract upstream trace contexts, and exit requests can automatically inject trace headers. Thus, your Node.js service is no longer an isolated island; it can be seamlessly integrated with Java, Go, Python, frontend applications, gateways, and downstream services to form a complete topology.
When a user reports "occasional slowness in the payment API," troubleshooting no longer stops within the Node.js process. You can trace it all the way down to the database, cache, third-party APIs, and even backend microservices.
Many Node.js performance issues do not immediately manifest as business errors.
If the event loop is blocked by CPU-intensive tasks, all APIs will slow down globally. A continuous increase in V8 heap memory might eventually trigger frequent GC. Abnormalities in process CPU, RSS memory, or thread pool resources could make the service unstable during peak hours.
The ARMS Node.js agent includes built-in capabilities to collect runtime metrics, covering:
These metrics are periodically collected by the MeterManager and reported to ARMS via gzip + protobuf. This allows you to identify "which trace is slow" from an API perspective and "why the entire service is slow" from a runtime perspective.
The thread count provided is an estimate based on CPU cores and the libuv thread pool size, which is useful for trend observation. If exact thread counts are required, they can be supplemented via system-level or native capabilities.
This is especially critical for high-concurrency APIs, long-lifecycle services, real-time communication systems, and AI inference orchestration. Often, the true root cause isn't found in a specific line of business code, but rather in the shifting trends of runtime resource states.
Node.js is rapidly becoming a vital server-side runtime for AI applications. Growing numbers of teams are using frameworks and SDKs like OpenAI SDK, LangChain.js, LangGraph, Vercel AI SDK, and Anthropic Claude SDK to build intelligent customer service systems, coding assistants, data analysis agents, and internal productivity tools.
Troubleshooting AI applications differs greatly from traditional web services. You need to know:
The ARMS Node.js agent includes built-in AI-oriented automatic instrumentation that covers scenarios like OpenAI, LangChain, LangGraph, Vercel AI SDK, and Anthropic Claude SDK. By incorporating GenAI semantics, it captures model invocations, token usage, streaming responses, tool calls, and error details.
This means you no longer have to cross-reference model platform logs, business logs, and trace logs separately when troubleshooting your AI application. A single user query can be analyzed within the same trace, seamlessly following the flow from the Node.js API entry point, through Agent orchestration and model invocations, all the way to tool and database accesses.
Monitoring configurations in production environments need to be agile and dynamic.
The ARMS Node.js agent supports remote configurations pushed from the console. Approximately 60 seconds after startup, the agent pulls the remote configuration for the first time, and polls it every 60 seconds thereafter. Configuration changes take effect without requiring an application restart. Currently supported dynamic capabilities include:
This is incredibly useful for troubleshooting in production.
During traffic spikes, you can temporarily lower the sampling rate to manage costs and overhead. If a specific plugin has a compatibility risk with a certain business library version, you can disable it temporarily. If you need to debug a complex issue, you can briefly increase the sampling rate and revert it once the issue is resolved.
Monitoring systems should never be a bottleneck for business rollouts. Dynamic configuration transforms the agent from a static SDK into an operable production tool.
Logs are important, but logs are not traces.
| Dimension | Logs Only | ARMS Node.js Agent |
|---|---|---|
| Request Path | Requires manual stitching | Automatically generates complete traces |
| Asynchronous Context | Breaks easily | Transmitted via AsyncLocalStorage/AsyncHooks |
| Databases and Caches | Relies on manual logging | Automatically captures critical calls |
| Runtime Health | Usually missing | Event Loop, V8, and Process metrics |
| AI Invocations | Requires custom business logs | Automatically observes models, tokens, and tool calls |
| Production Configuration | Requires code or environment changes followed by a restart | Dynamic push from the console |
Logs are great for recording business events, whereas the agent is ideal for reconstructing system behaviors. By combining the two, troubleshooting efficiency improves significantly.
OpenTelemetry JS is an excellent open-source standard with an open ecosystem and universal protocols. However, for enterprise users trying to implement it, there is often a whole new set of engineering challenges to resolve: Which exporter to use? How to configure sampling? Which plugins to select? How to standardize resource attributes? How to correlate logs? How to observe AI applications? And how to push dynamic configurations from a console?
The ARMS Node.js agent is built on the core OpenTelemetry data model and features end-to-end integration tailored for Alibaba Cloud ARMS. For teams already using the Alibaba Cloud observability ecosystem, it functions more like an "out-of-the-box agent" rather than a bundle of low-level components requiring manual assembly.
In short, OpenTelemetry provides standard building blocks; the ARMS Node.js agent delivers a complete, production-ready integration path.
Traditional APM agents typically excel at web, database, and basic tracing. However, facing the evolving landscape of modern Node.js applications, they struggle to cover new scenarios: ESM, AI SDKs, Agent frameworks, token statistics, streaming responses, remote dynamic configuration, and cross-language semantic consistency.
The advantages of the ARMS Node.js agent include:
Node.js 16.x or above is recommended. Node.js 18 or 20 LTS is recommended for production environments.
Projects using npm, yarn, or pnpm.
The build environment can access the Internet or the Alibaba Cloud intranet, and security groups allow outbound traffic on ports 80 and 443.
You have obtained your ARMS LicenseKey and Region ID.
npm install @loongsuite/cms_node_sdkYou can also use yarn or pnpm:
yarn add @loongsuite/cms_node_sdk
pnpm add @loongsuite/cms_node_sdkexport ARMS_APP_NAME=your-app
export ARMS_REGION_ID=cn-hangzhou
export ARMS_LICENSE_KEY=your-license-keyThe agent is also backwards compatible with legacy environment variables using the CMS_ prefix, making it easy for existing teams to migrate gradually. For new projects, we recommend using the ARMS_ prefix exclusively.
For Docker environments, add these to your Dockerfile:
ENV ARMS_APP_NAME=your-app
ENV ARMS_REGION_ID=cn-hangzhou
ENV ARMS_LICENSE_KEY=your-license-keyFor CommonJS projects, preloading is recommended:
node -r @loongsuite/cms_node_sdk/register app.jsFor ESM projects, using a Loader is recommended:
node --experimental-loader=@loongsuite/cms_node_sdk/import-hooks app.mjsWhen programmatic control is needed:
const { NodeSDK } = require('@loongsuite/cms_node_sdk');

const sdk = new NodeSDK({
  serviceName: 'your-app',
  licenseKey: 'your-license-key',
  regionId: 'cn-hangzhou',
  workspace: 'your-workspace',
});
sdk.start();After the application starts, you'll be able to see the integrated application within about one minute on the ARMS console under "Application Monitoring > Applications". By entering the Application Details page, you can view the application topology, API invocations, trace links, SQL analysis, runtime metrics, and more.
The true value of a monitoring SDK is to help discover problems, not to become a problem itself.
By design, the ARMS Node.js agent follows the principles of being "low-intrusion, sample-enabled, switchable, and recoverable":
| Mechanism | Purpose |
|---|---|
| Batch Export | To reduce network requests and export frequency |
| gzip + protobuf | To minimize data transmission size |
| Sampling Strategies | To control trace data volume in high-traffic scenarios |
| Plugin Toggles | To enable only the specific collection capabilities required by the business |
| Exception Protection | To ensure automatic instrumentation failures do not affect the main business flow |
| Shutdown/Unpatch | To gracefully close and revert patches when the application exits |
| Remote Configuration | To allow dynamic parameter tuning in production without restarts |
Furthermore, the agent enables environment, process, host, and Kubernetes resource detection by default. This automatically populates resource attributes like service name, host, process, container, and workload, eliminating the manual overhead of maintaining labels post-integration.
When the application exits, the preload mode listens for SIGINT and SIGTERM signals. It then calls shutdown() to sequentially close the automatic instrumentation plugins, TracerManager, MeterManager, and LogManager, ensuring buffered data is flushed and patches are safely reverted.
In standard business scenarios, the agent's impact on application performance is minimal. For highly concurrent or highly sensitive traces, we recommend combining load-testing results to set a reasonable sampling rate and turn off unused plugins as needed.
Enterprise-Grade Node.js Web Services
Ideal for Express, Koa, BFF, API gateways, and internal corporate systems, helping teams rapidly build API performance, error rate, dependency call, and topology views.
Microservices and Distributed Systems
Perfect for systems with numerous services, complex downstream dependencies, and requirements for cross-language tracing. Via Trace Context and Baggage propagation, your Node.js services can join Java, Go, Python, and other services to form a complete trace network.
Database and Cache-Intensive Applications
Designed for systems heavily utilizing MySQL, PostgreSQL, MongoDB, Redis, and ioredis. Slow SQL queries, cache hotspots, and slow downstream dependencies are all merged into a single request trace.
AI/Agent Server-Side Applications
Suitable for intelligent customer service, AI coding assistants, RAG Q&A, and data analysis Agents. It tracks OpenAI, LangChain, LangGraph, and Vercel AI SDK invocations to analyze tokens, tool calls, streaming responses, and model execution times.
Long-Lifecycle Node.js Services
Ideal for real-time communication, queue consumption, background tasks, and daemon workers. Runtime metrics assist in diagnosing blocked event loops, memory bloat, GC anomalies, and process resource exhaustion.
Production Systems Requiring Dynamic Operations Monitoring
Made for mission-critical businesses where frequent restarts are out of the question. Sampling, span limits, and plugin toggles can be dynamically pushed from the console, allowing monitoring strategies to adapt instantly to current business states.
Node.js has made server-side development incredibly efficient and flexible, but it has also ushered production troubleshooting into a far more complex era. Asynchronous contexts, massive ecosystem modules, database and cache dependencies, runtime health, and AI traces—any layer could hide the root cause.
The goal of the ARMS Node.js agent is simple: To make Node.js observability as straightforward as integrating an npm package.
A single integration automatically covers HTTP, frameworks, databases, caches, RPCs, message queues, logs, runtimes, and AI calls. A single trace connects user requests, service logic, and downstream dependencies. A single console dynamically manages sampling, plugins, and data reporting strategies.
Server-side distributed tracing is now fully within your reach.
Try It Now: Log on to the Alibaba Cloud ARMS console, create an application monitoring integration configuration, obtain your LicenseKey, and start integrating the Node.js agent today.
Technical Support: If you encounter any issues during the integration process, feel free to connect with the Alibaba Cloud Observability Team via our DingTalk support group.
Zero-Code Instrumentation: See Through Every AI Agent Invocation

756 posts | 60 followers
FollowAlibaba Cloud Native Community - July 28, 2026
Alibaba Cloud Native Community - April 16, 2026
Justin See - March 20, 2026
Alibaba Cloud Native Community - May 18, 2026
Alibaba Cloud Native Community - June 23, 2026
Alibaba Cloud Native - August 14, 2024
756 posts | 60 followers
Follow Token Plan
Build more, spend less. One plan, every modality.
Learn More
Alibaba Cloud Model Studio
A one-stop generative AI platform to build intelligent applications that understand your business, based on Qwen model series such as Qwen-Max and other popular models
Learn More Application Real-Time Monitoring Service
Build business monitoring capabilities with real time response based on frontend monitoring, application monitoring, and custom business monitoring capabilities
Learn More Qwen
Qwen
Full-range, open-source, multimodal, and multi-functional
Learn MoreMore Posts by Alibaba Cloud Native Community

