Logview is a tool for checking and debugging a job after it is submitted to MaxCompute. With Logview, you can check the running status, details, and result of a job, and the progress of each phase. After the job is submitted to MaxCompute, a Logview link is generated. You can open the link in a browser to view the job information. However, how can you locate issues with so many parameters in Logview? How can you view the running status and resource usage of each instance or task through Logview? How can you analyze the execution plan and issues in query execution and locate long-tail tasks for the purpose of making data analysis efficient and cost-effective? Yun Hua, a product expert at Alibaba Cloud Computing Platform, provides answers to these questions.
The following content is based on Yun Hua's presentation and PPT file.
This article consists of the following parts:
Many users may encounter problems when using MaxCompute but are unable to locate the problems and optimize their systems. This article describes Logview parameters and troubleshooting methods for you to address these problems.
Logview is a tool for checking and debugging a job after it is submitted to MaxCompute. With Logview, you can check the job running status, including the queuing status and resource usage of jobs, and even the details and progress of the instances running on each node. When a submitted job encounters an error or the runtime of the job is too long, you can use Logview to analyze the cause, thus accurately optimizing the job.
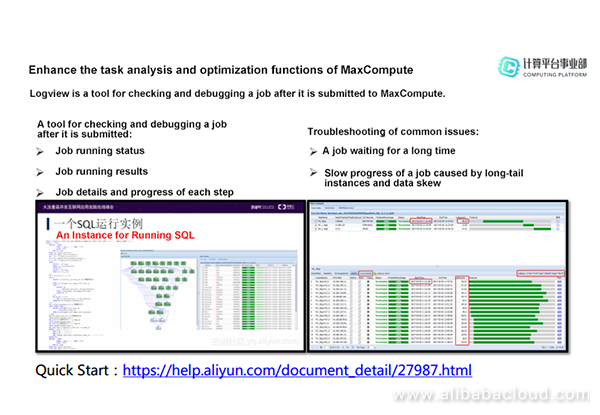
When using Logview, you may encounter some terms that are unique to MaxCompute. This section briefly describes these terms to help you better understand how Logview works.
The following figure shows the MaxCompute system architecture. The uppermost access layer connects data sources and clients. Data of various external data sources can be synchronized to Apsara Distributed File System through transmission tools such as Tunnel and DataHub. After using CLT, MaxCompute Studio, or DataWorks to develop a job on a client, you submit the job to the HTTP server through a RESTful API. After receiving the request, the HTTP server authenticates your identity in the user center. In a word, the access layer is responsible for data upload and download, user authentication, and load balancing. The lower layer is the management layer, which is the core of MaxCompute. It is responsible for project and object management, command parsing and execution, and object access control and authorization. The Worker, Scheduler, and Executor roles are involved at this layer. MaxCompute metadata is stored in Table Store, which is an open service of Alibaba Cloud.
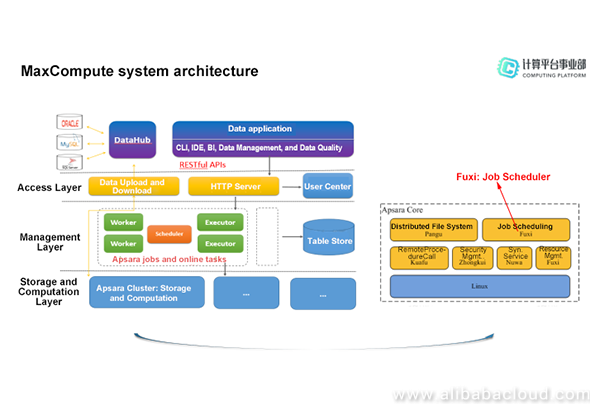
The MaxCompute computing cluster is built based on the Apsara system. The core modules of the Apsara system include Apsara Distributed File System, Job Scheduler, Apsara Name Service and Distributed Lock Synchronization System, Distributed System Performance Monitor, Kuafu, and Zhongkui. In the MaxCompute architecture, the scheduling and management of tasks between the management layer and Job Scheduler are the most important and complex.
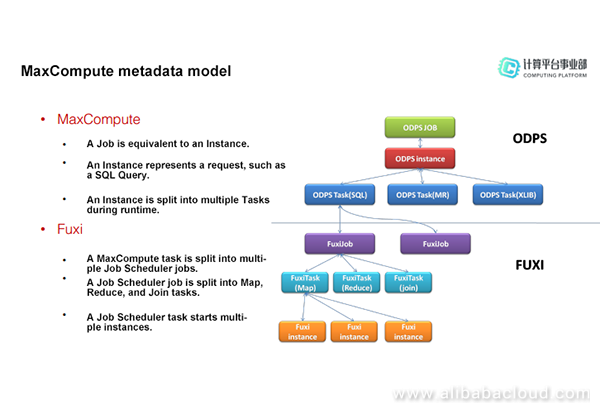
MaxCompute is also known as ODPS. The name "MaxCompute" has been officially used since 2016. In Logview, "ODPS" actually refers to MaxCompute. The name "MaxCompute" has been officially used since 2016. In Logview, "ODPS" actually refers to MaxCompute. Job (instance) and task are two common types of objects in MaxCompute. For example, the system creates an instance when you submit a SQL query request. When running in MaxCompute, the instance is split into multiple tasks. However, each instance maps to a unique task in most cases. Tasks can be classified into SQL tasks, MapReduce tasks, and Machine Learning tasks. The concepts of jobs, tasks, and instances are also involved in underlying Job Scheduler, which must be distinguished from the concepts of tasks and instances in MaxCompute. When a MaxCompute task is submitted to Job Scheduler, the task is split into multiple Job Scheduler jobs. Each job is further broken down into different tasks, such as the Map, Reduce, and Join tasks, based on the execution plan. Each task starts multiple instances, that is, multiple nodes.
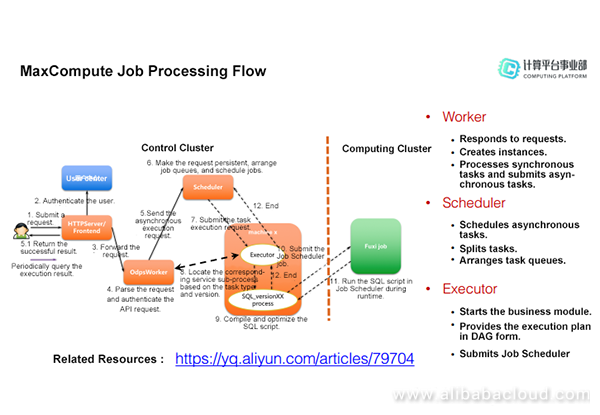
After you submit a SQL statement on the client, the client sends the request to the HTTP server through a RESTful API. After receiving the request, the frontend of the HTTP server authenticates your identity in the user center. If the authentication is successful, the HTTP server forwards the request to the corresponding MaxCompute Worker based on the cluster information. The Worker parses the request and authenticates the API request. After the authentication, the Worker responds to the request and determines whether the job corresponds to a synchronous task or an asynchronous task. For a synchronous task such as a SQL DDL statement or a job status query task, the Worker accesses Table Store for the metadata, transmits the task to the Executor, and returns the result to the client after the task is completed. For an asynchronous task such as a SQL DML statement or a MapReduce task, the Worker must transmit the task to Job Scheduler. The Worker creates an instance and transmits it to the Scheduler, which schedules all asynchronous tasks. The Scheduler splits the instance into tasks and performs global computing scheduling. If all resources are available and conditions are met, the Scheduler transmits the task to the Executor, which contains various types of business logic, such as SQL statements and algorithm modules. The Executor triggers different job modules based on the job type. When the Executor is idle, it sends its heartbeat to the Scheduler and requests for tasks. After obtaining a task, the Executor starts a business module based on the corresponding task type. The Executor generates an execution plan for the task and submits both the task and execution plan to Job Scheduler. A task submitted to Job Scheduler may sometimes be returned. For example, a task fails to be submitted to Job Scheduler as an online job and is returned to the Scheduler. Then, the task is submitted again as an offline job. This process is recorded in Logview. After submitting the task to Job Scheduler, the Executor monitors the task execution status. After the task is completed, the Executor updates the task information in Table Store and reports the task status to the Scheduler. Then the Scheduler determines whether the entire instance is completed. If the execution is completed, the Scheduler sets the instance status to Terminated in Table Store.
This section describes Logview parameters. The MaxCompute instance information includes the queue and sub-status information. The Job Scheduler job information includes the Job Scheduler task and instance information. After a task is completed, the summary and diagnostic information is displayed. You can import and export the Logview information.
As shown in the following figure, the second table from the top down contains the following fields: URL, Project, InstanceID, Owner, StartTime, EndTime, Latency, Status, and Progress.
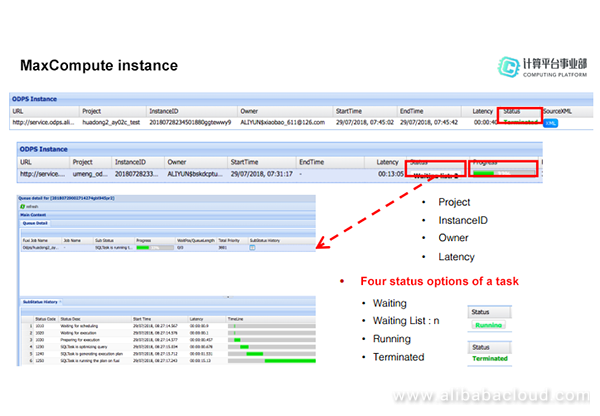
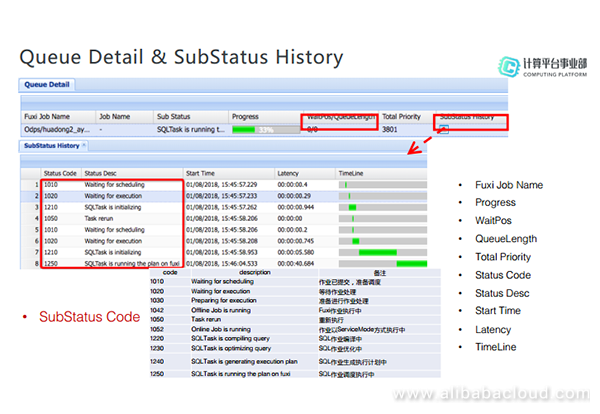
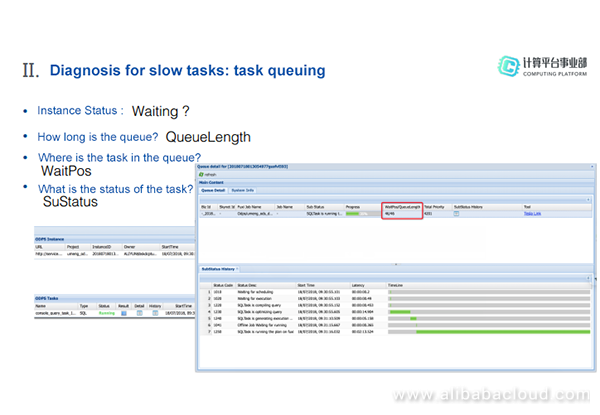
As shown in the following figure, the uppermost table describes the queue information. Fuxi Job Name indicates the name of a Job Scheduler job. Sub Status indicates the current running status of the job. Progress indicates the current running progress. In the first red box of the figure, WaitPOS indicates the current position of the job in the queue and QueueLength indicates the length of the queue. From the two fields, you can view the number of jobs in the queue and the position of the current job. Total Priority indicates the priority of the job. You can click the icon in the SubStatus History column to display the SubStatus History table. The following figure also shows the description of the code in the Status Code column of the SubStatus History table.
As previously mentioned, there are two types of Job Scheduler jobs: online jobs and offline jobs. What is the difference between these two types of jobs? Each time an offline job is submitted to Job Scheduler, the environment requires preparation time. Offline jobs can be applied to scenarios where a large amount of data needs to be processed and no query results are required. However, offline jobs are not suitable for handling a small amount of data and the jobs must be run in real time. Job Scheduler provides the service mode (online job) to resolve this issue. That is, a service is used to compute, apply for, and load resources in advance, for example, applying for 10,000 instances. When a job is submitted, the service allocates some instances based on the job size. This service mode saves the environment preparation time and allows the online job to be run quickly.
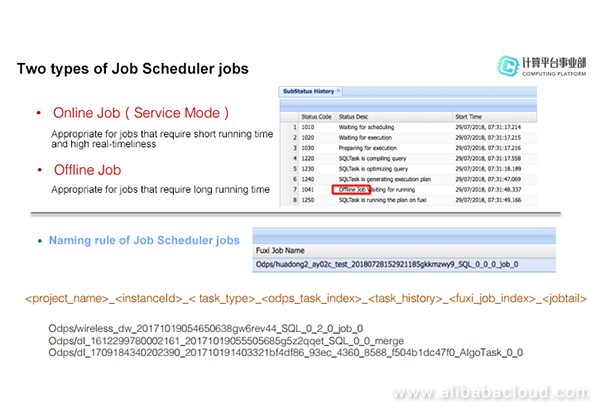
As shown in the preceding figure, a Job Scheduler job is named in the format of Odps/______.
The following figure shows the information about a MaxCompute task. In the table, Name indicates the task name, Type indicates the task type, and Status indicates the task running status. You can double-click the icon in the Result column to view the result set of the task. Also, you can double-click the icon in the Detail column to view details of the Job Scheduler job.
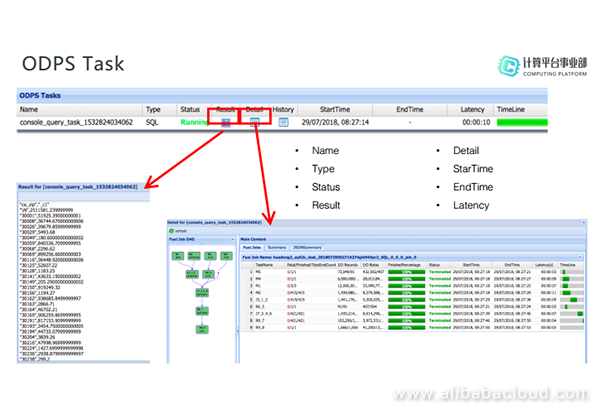
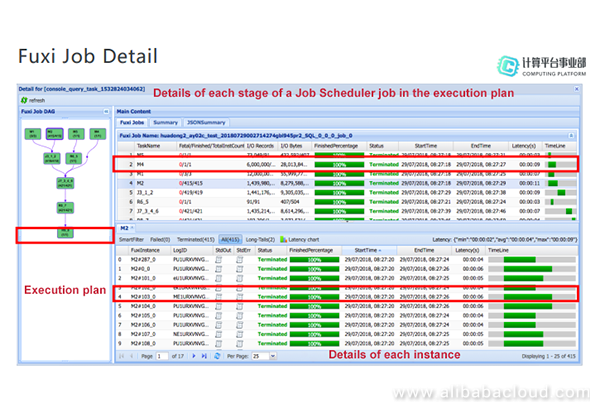
The task execution plan is displayed in the left of the window. It is generated in the Executor and used to divide a task into different stages for running. Each stage can be considered as a node in the figure, while the dependencies between stages are displayed as arrows to form a directed acyclic graph (DAG). In the following example, the Job Scheduler job is split into four Map tasks, two Join tasks, and three Reduce tasks. For example, J3_1_2 runs after M1 and M2 are completed. That is, the output of M1 and M2 is the input for J3_1_2. The task names also indicate the task dependencies. Therefore, the naming rules are related to the execution plan. The table in the upper-right corner describes the details of each task (stage). The table in the lower-right corner describes the details of each instance.
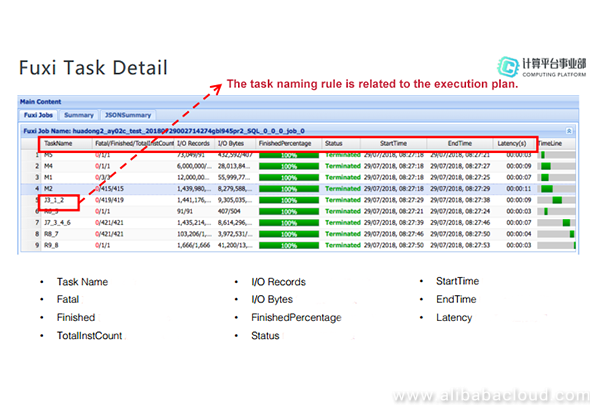
The following figure shows the details of Job Scheduler tasks. TaskName indicates the name of a Job Scheduler task, which is related to the execution plan. In the Fatal/Finished/TotalInstCount column, Fatal indicates the number of fatal errors, which is displayed in red. Finished indicates the number of finished instances. TotalInstCount indicates the total number of instances started for each task. I/O Records indicates the number of input and output records. I/O Bytes indicates the number of input and output bytes. FinishedPercentage indicates the current progress of the task. Status indicates the running status of the task.
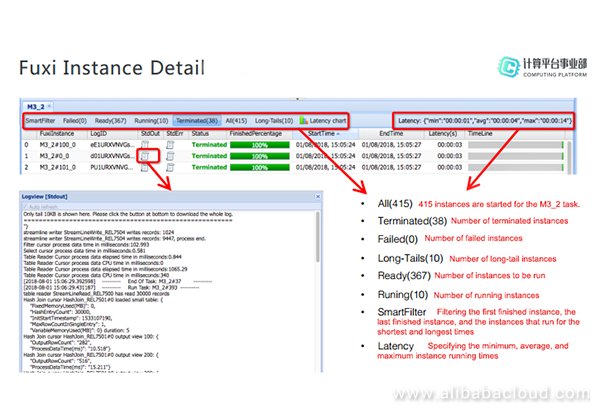
Job Scheduler instances are the smallest units in the entire job process. The following figure shows the details of a Map task. The number following the All field indicates the number of instances started for the task. For example, All(415) indicates that 415 instances are started for M3_2. The numbers following Terminated, Running, Ready, and Failed indicate the number of instances in the respective status. SmartFilter is used to filter the first completed instance, the last completed instance, and the instances that run for the shortest time and longest time, allowing you to easily check the instances. Latency chart is used to display the running time for all instances in a chart. Latency specifies the minimum running time, average running time, and maximum running time, which are useful for analyzing long-tail tasks. To view the running information of an instance, click the icon in the StdOut column of the instance. To view the cause of an error when an instance fails, click the icon in the StdErr column of the instance.
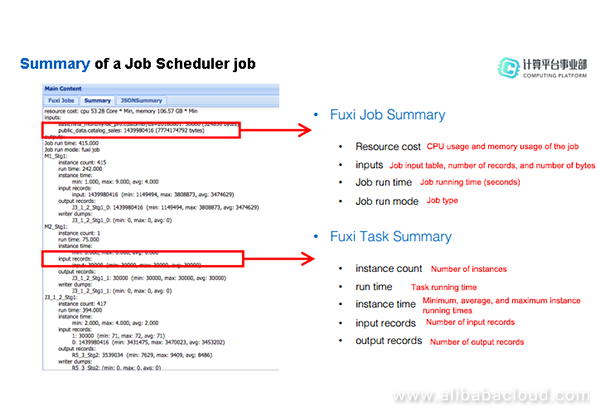
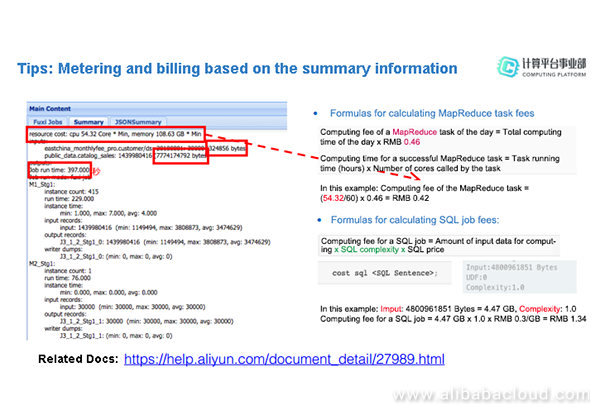
After a Job Scheduler job is completed, you can click the Summary tab to check information about the job, such as the CPU usage, memory usage, input table name, number of records, and number of bytes. The job running time is displayed in seconds. On the Summary tab page, you can also check the number of instances, task running time, and maximum, minimum, and average instance running time from the Job Scheduler task summary.
The summary information can be used for metering and billing. For example, a MapReduce task can be charged by using the following formulas:
Computing fee of a MapReduce task of the day = Total computing time of the day x RMB 0.46
Task computing time = Task running time (hours) x Number of cores called by the task
On the Summary tab page, you can directly obtain the CPU computing time without the need to calculate it using the formula. Use the following formula to calculate the fee for a SQL job:
Computing fee for a SQL job = Amount of input data for computing x SQL complexity x SQL price
Run the cost sql command to calculate the amount of input data and the SQL complexity. For more information about metering and billing, visit the Alibaba Cloud website.
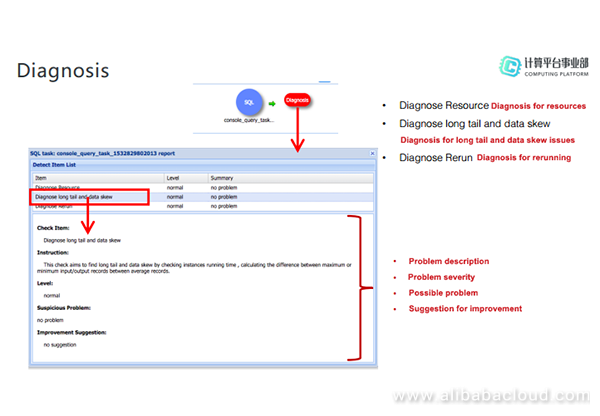
After a job is completed, click the Diagnosis button to open the window shown in the following figure. Click Diagnose Resource, Diagnose long tail and data skew, and Diagnose Rerun to check the description, severity, and suggestions for improvement, respectively.
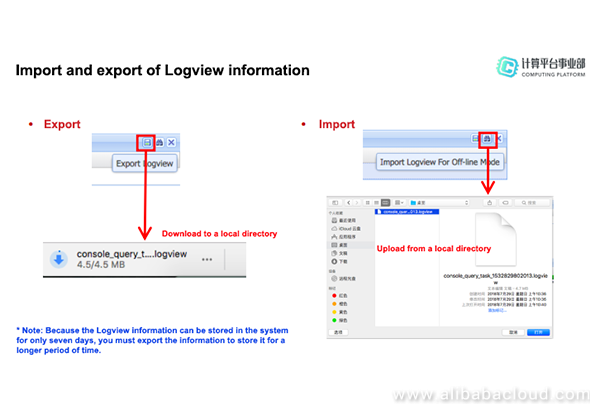
The Logview information can be imported and exported. Because the Logview information can be stored in the system for only seven days, you must export the information to store it for a longer period of time. To save the Logview information to a local directory, click the Export Logview icon in the upper-right corner of the Logview window. To upload the local Logview information for analysis, click the Import Logview For Off-line Mode icon.
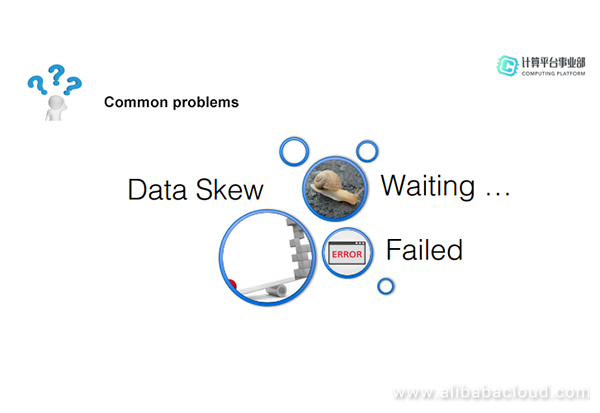
Logview can be used to troubleshoot common issues, for example, if a task queues for a long period of time, fails to run, or runs for a long period of time and cannot be completed. Most slow tasks are caused by the long tail issue, which is usually generated due to data skew. The long tail issue must be resolved because it affects the data analysis result and consumes more data resources.
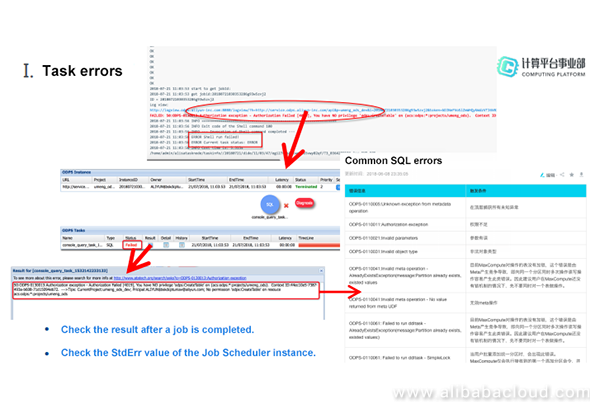
You can locate the cause of a task error from the console output. To view the detailed error information, open Logview and check the task status in the ODPS Tasks area. If the task fails, Failed is displayed in the Status column in red. Double-click the icon in the Result column. The error information is displayed, which includes the error code. Descriptions of error codes are available on the Alibaba Cloud website. To obtain the error information of a task, check the task result after the task is completed or check the StdErr value of the corresponding Job Scheduler instance.
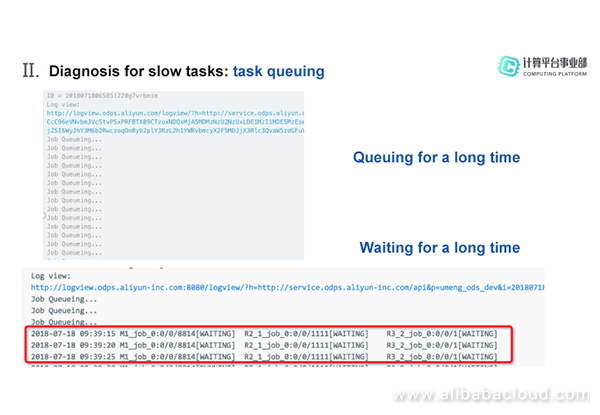
Job queuing
A symptom of a slow task is that the task is always queuing or the Job Scheduler job is always in the Waiting status on the console. Open Logview and check whether Status of the task is Waiting or Waiting List to locate where the task is queued. If Status is Waiting List, further check the queue length and the position of the task in the queue. You can also check the sub-status of the task on the SubStatus History tab page.
If you are unable to locate slow tasks, run show p to check the information about all instances or run top instance to check the running jobs. The job with the longest running time may be the task that is blocking the queue and causing other tasks to be waiting. To resolve the resource preemption issue, optimize the tasks as follows:
Large number of small files
A task may run slowly when a large number of small files exist. For example, the execution plan when a job is initiated is shown on the left of the following figure. The job contains two Map tasks, a Join task, and a Reduce task. After the Reduce task is completed, a Merge task is automatically added for small file merging.

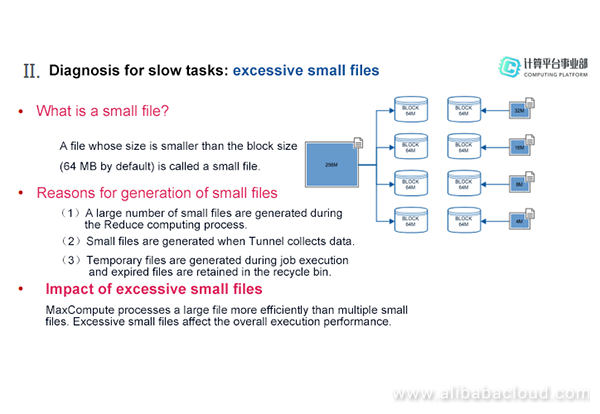
Data files in Apsara Distributed File system are stored by block. The size of each block is 64 MB. A file whose size is smaller than 64 MB is a small file. Small files may be generated for the following reasons:
Because of the excessive small files, data read in the Map stage is unevenly distributed, causing the long tail issue. In addition, excessive small files waste resources, exhaust disk space, and affect the overall execution performance. Consequently, small files generated in the computing process must be merged to improve both the performance and storage. MaxCompute has been optimized to automatically allocate a Job Scheduler merge task for merging small files. However, small files generated in many scenarios may not be merged effectively. Therefore, MaxCompute provides parameters that allow you to merge small files.
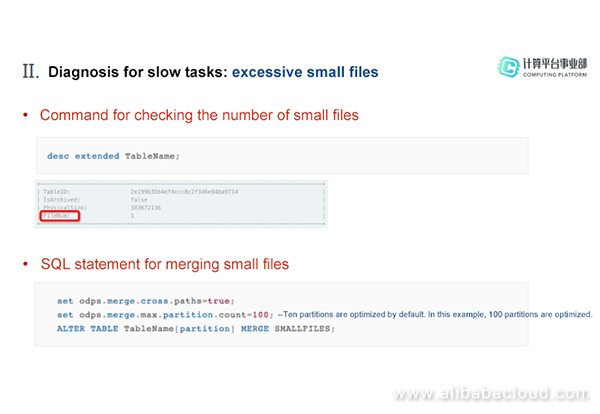
Run desc extended TableName to obtain the number of small files and determine whether your table contains excessive small files. If excessive small files exist, run the SQL statement shown in the following figure to merge the small files.
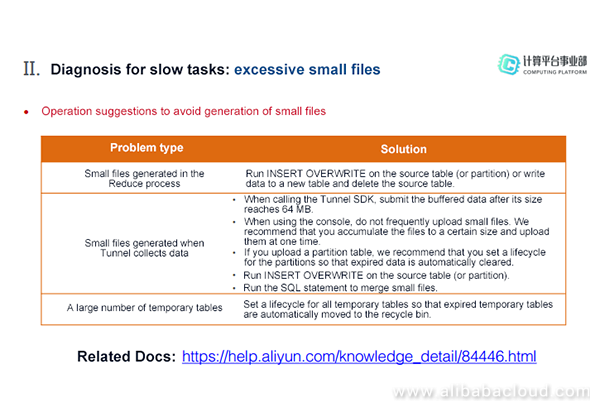
We recommend that you take the following measures to avoid generation of small files: To avoid small files from being generated in the Reduce process, run INSERT OVERWRITE to write data to the original table or delete the original table after writing data to a new table. To avoid small files from being generated when Tunnel collects data, call the Tunnel SDK. That is, when uploading data, upload the buffered data after its size reaches 64 MB. Do not upload data frequently. When uploading a partition table, set a lifecycle for the table so that expired data is automatically cleared. When there are a lot of temporary tables, set a lifecycle for all temporary tables so that expired temporary tables are automatically moved to the recycle bin. For more information about handling small files, visit the Alibaba Cloud website.
Long-tail Tasks Caused by Data Skew
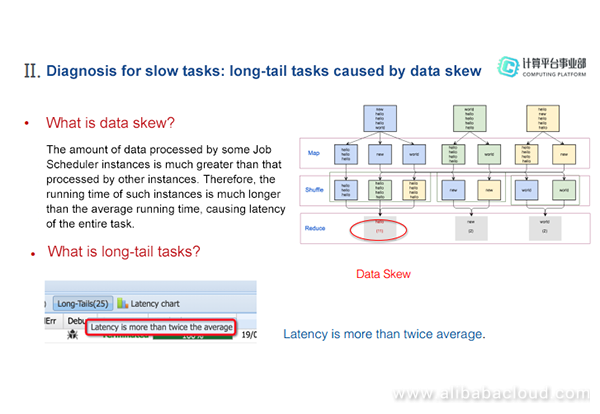
Long-tail tasks caused by data skew may run slowly. The reason for data skew is uneven data distribution. The amount of data processed by some Job Scheduler instances is much greater than that processed by other instances, causing long-tail tasks. In MaxCompute Logview, hover your mouse cursor over the Long-Tails tab. The message "Latency is more than twice the average" is displayed, indicating that the long tail issue exists.
You can check whether a task is a long-tail task in Logview in two ways. One is to check the maximum latency of Job Scheduler instances. If the number in the parentheses after Long Tails is greater than 0, the long tail issue exists. Click the Long-Tails tab to view all long-tail instances and their details. The other way is to check the summary and diagnosis information of the Job Scheduler job. Analyze the summary to check the position of the long-tail task. If the value of max differs a lot from that of avg in the instance time field, the long tail issue exists. If the value of max differs a lot from that of avg in the input records field, data skew has occurred. In the diagnostic window, click Diagnose long tail and data skew to check the data skew and long tail issues, as well as the suggestions for improvement.
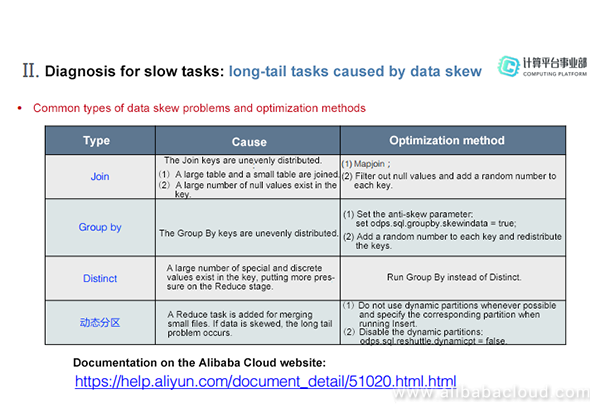
This section describes how to resolve different types of data skew issues.
To learn more about Alibaba Cloud MaxCompute, visit https://www.alibabacloud.com/product/maxcompute
Using DataX-On-Hadoop to Migrate Data from Hadoop to MaxCompute

137 posts | 21 followers
FollowAlibaba Cloud MaxCompute - August 27, 2021
Alibaba Cloud MaxCompute - September 12, 2018
Alibaba Cloud MaxCompute - June 2, 2021
Alibaba Cloud MaxCompute - September 12, 2018
Alibaba Cloud Community - October 20, 2025
Alibaba Cloud MaxCompute - April 25, 2019

137 posts | 21 followers
Follow Big Data Consulting for Data Technology Solution
Alibaba Cloud provides big data consulting services to help enterprises leverage advanced data technology.
Learn More MaxCompute
Conduct large-scale data warehousing with MaxCompute
Learn More Big Data Consulting Services for Retail Solution
Alibaba Cloud experts provide retailers with a lightweight and customized big data consulting service to help you assess your big data maturity and plan your big data journey.
Learn More Hologres
A real-time data warehouse for serving and analytics which is compatible with PostgreSQL.
Learn MoreMore Posts by Alibaba Cloud MaxCompute