Long Short Term Memory (LSTM) is a recurrent Neural Network which is used for time series forecasting. Time series forecast is used in many applications including stock market prediction, Covid - 19 pandemic new cases prediction, PM 2.5 prediction etc. This comes under the regression category of machine learning problems. The efficiency of the LSTM algorithms in regression problems cannot be limited to the metrics in classification reports. Various researchers use different metrics to analyze the closeness than the exactness of the predicted data against the actual data.
In this article we will walkthrough the implementation of couple of LSTM variants and compare their performances visually against the actual data. DSW Notebook in Machine Learning Platform for AI in Alibaba Cloud is used.
The github link for the source code used for this tutorial is listed here. The most vital libraries used in this code are Tensorflow, Keras and Matplotlib.
For this tutorial we use a random array with one row of data available. 
The raw_seq array is used to train the LSTM model. The data is set to a chosen number of steps as 10. The number of features n_features is set as 1.
With the training data and n_steps, the data is subjected to the split_sequence function. This is used to split the training data into the number of steps specified.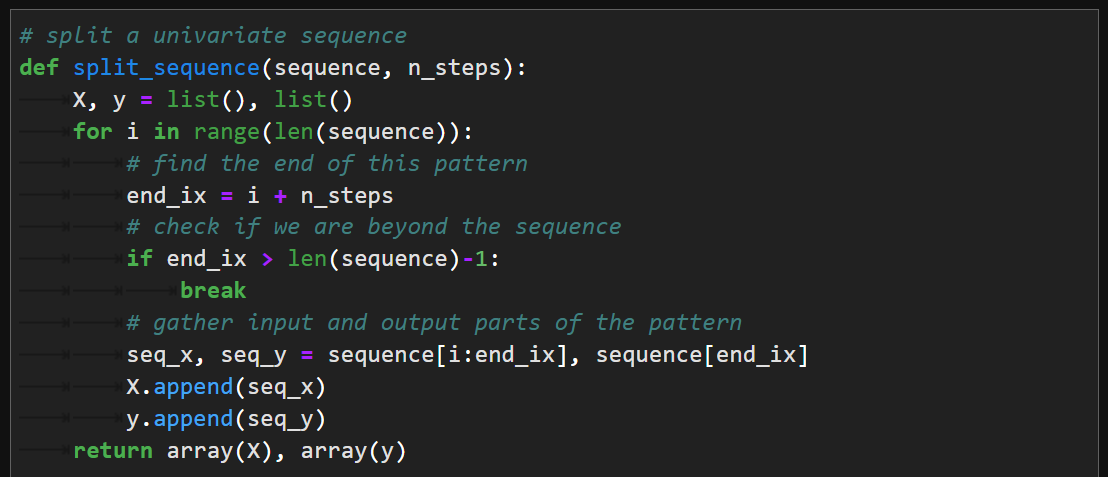
Now the Stacked LSTM with two layers of LSTM is constructed.
The architecture along with its layerwise parameters is given below.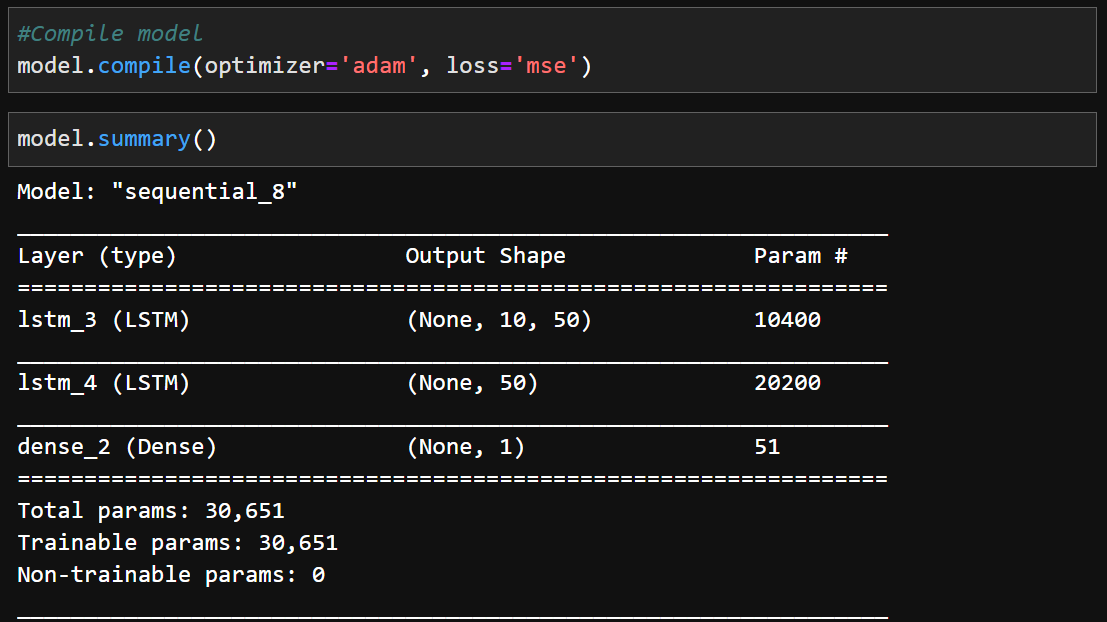
The variable fut is set as testing data and is longer than the training data. The Stacked LSTM model is run for 200 epochs of training and the testing data is done using mode.predict function.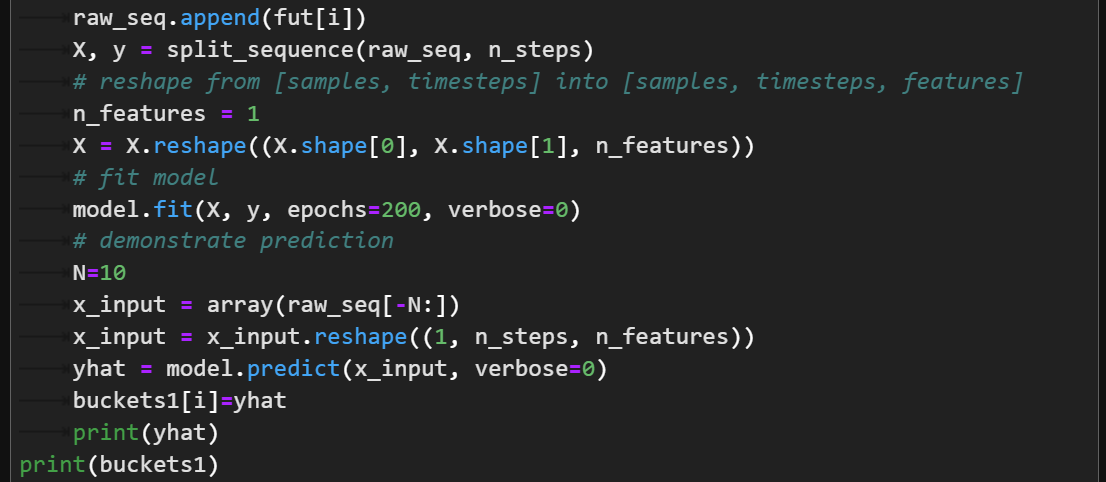
The predicted values of Stacked LSTM are stored in buckets1 array. Following this implementation, we create a model for vanilla LSTM which has only one LSTM layer.
The architecture representation of vanilla LSTM is given below.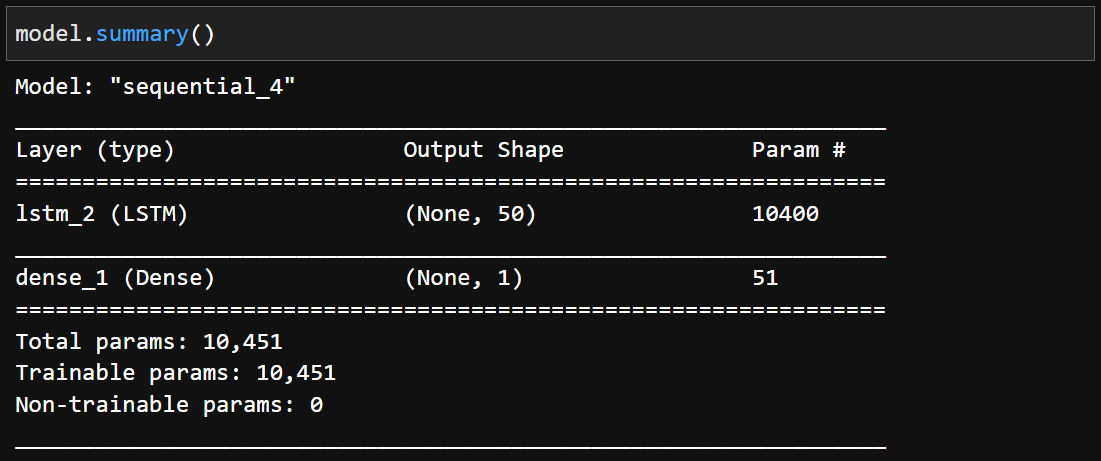
This model of Vanilla LSTM is run for 200 epochs on the training data and predicted the testing data as same as the Stacked LSTM and stored in an array variable buckets.
The actual data is plotted against the predicted data of Stacked LSTM and Vanilla LSTM using the matplotlib library.
The output of prediction looks like the line plot given below.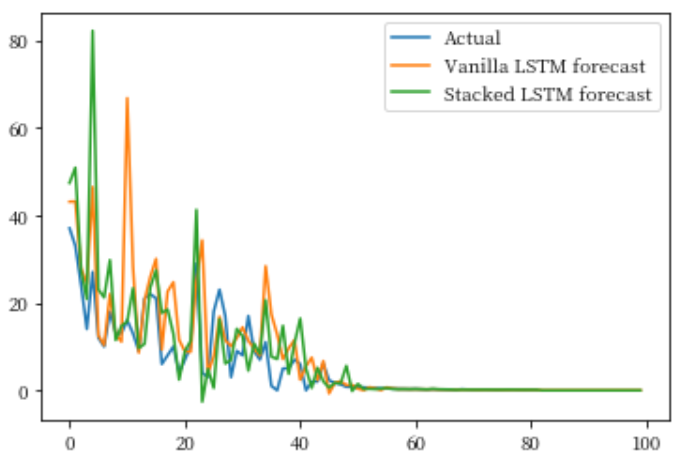
Hyper parameter optimization of Convolutional Neural Networks to classify MNIST digit database
shiming xie - November 4, 2019
Alibaba Clouder - February 6, 2018
Alibaba F(x) Team - August 29, 2022
amap_tech - March 23, 2021
Alibaba Clouder - March 9, 2017
Alibaba Clouder - January 23, 2018
 Platform For AI
A platform that provides enterprise-level data modeling services based on machine learning algorithms to quickly meet your needs for data-driven operations.
Learn More Epidemic Prediction Solution
This technology can be used to predict the spread of COVID-19 and help decision makers evaluate the impact of various prevention and control measures on the development of the epidemic.
Learn More AI Acceleration Solution
Accelerate AI-driven business and AI model training and inference with Alibaba Cloud GPU technology
Learn More Offline Visual Intelligence Software Packages
Offline SDKs for visual production, such as image segmentation, video segmentation, and character recognition, based on deep learning technologies developed by Alibaba Cloud.
Learn MoreMore Posts by ferdinjoe