
By SysOM SIG
Surftrace is a ftrace wrapper and platform of development and compilation launched by SysOM SIG that enables users to build projects quickly based on libbpf and write trace commands as a wrapper of ftrace. The project includes the Surftrace toolset, pylcc, and glcc (Python or generic C language for libbpf Compiler Collection) and provides remote and local eBPF compilation capabilities.
Surftrace maximizes the abstraction of krobe and ftrace-related features and enhances the tracking capability in various scenarios (such as network protocol packet capture), enabling users to get started very quickly and improving the efficiency of locating problems by more than ten times. In addition, for eBPF, an extremely popular technology, Surftrace has capabilities of libbpf and CO-RE to support encapsulation and abstraction of common functions (such as map and prog of bpf). Libbpf programs developed based on this platform can run indiscriminately on various mainstream kernel versions, improving the development, deployment, and operation efficiency immensely.
The biggest advantage of Surftrace is that it provides the current mainstream trace technology to developers. It can also use eBPF through ftrace. The application scenarios include various Linux subsystems (such as memory and I/O). The internal data structure of skb is carried out fluently by network byte order processing, especially on the network protocol stack trace, leaving the complexity to Surftrace itself but the simplicity to you. Today, let's take a look at the brilliant performance of Surftrace in the network field.
Locating network problems using methods such as ping connectivity and tcpdump packet capture analysis is a basic skill necessary for software developers, which can initially delimit network problems. However, when problems go deep into the kernel protocol stack, how can we clearly associate network messages with the kernel protocol stack to track the path of the concerned message accurately?
This is quoted from Volume 1 of TCP/IP Details:
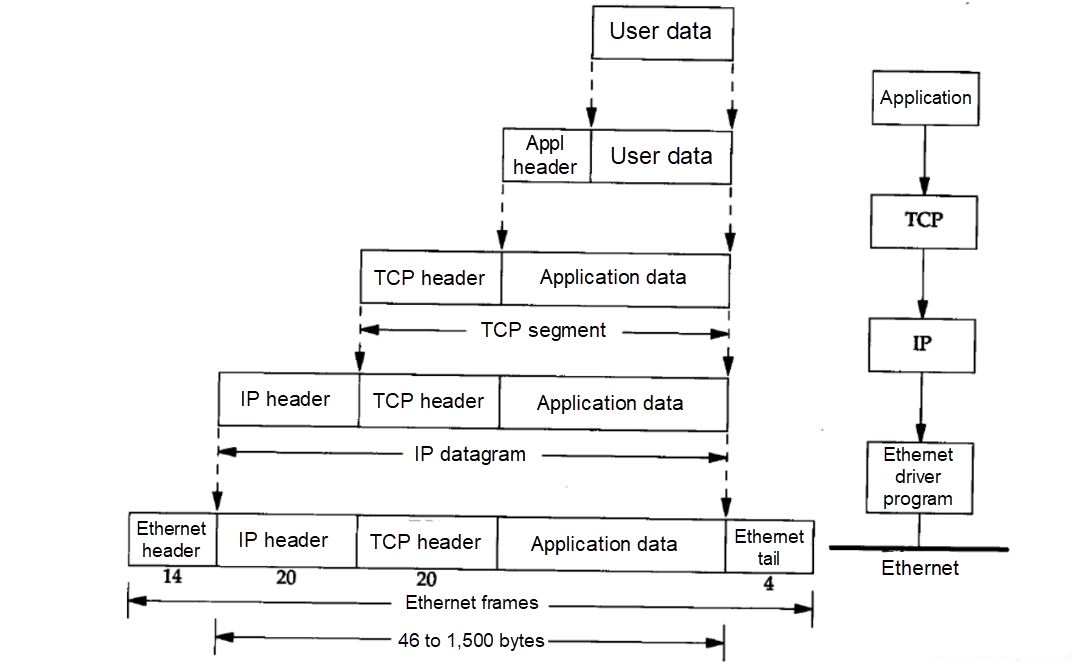
As shown in the preceding figure, network messages encapsulate data messages in different layers. Different operating systems adopt a consistent method of message encapsulation to achieve the purpose of cross-software platform communication.
Sk_buff is the actual carrier of network messages in the Linux kernel. It is defined in the include/linux/skbuff.h file and has many structure members. This article will not explain them one by one.
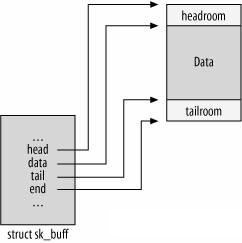
You need to focus on the following two structure members:
unsignedchar *head, *data;Head points to the start of the buffer, and data points to the starting position of the protocol layer where the current message is processed. If the current protocol is processed at the TCP layer, the data pointer points to struct tcphdr. At the IP layer, it points to struct iphdr. Therefore, the data pointers are the key beacons of the message during kernel processing.
The following figure shows a map processed by the protocol stack. You can save it and zoom in to view the map.
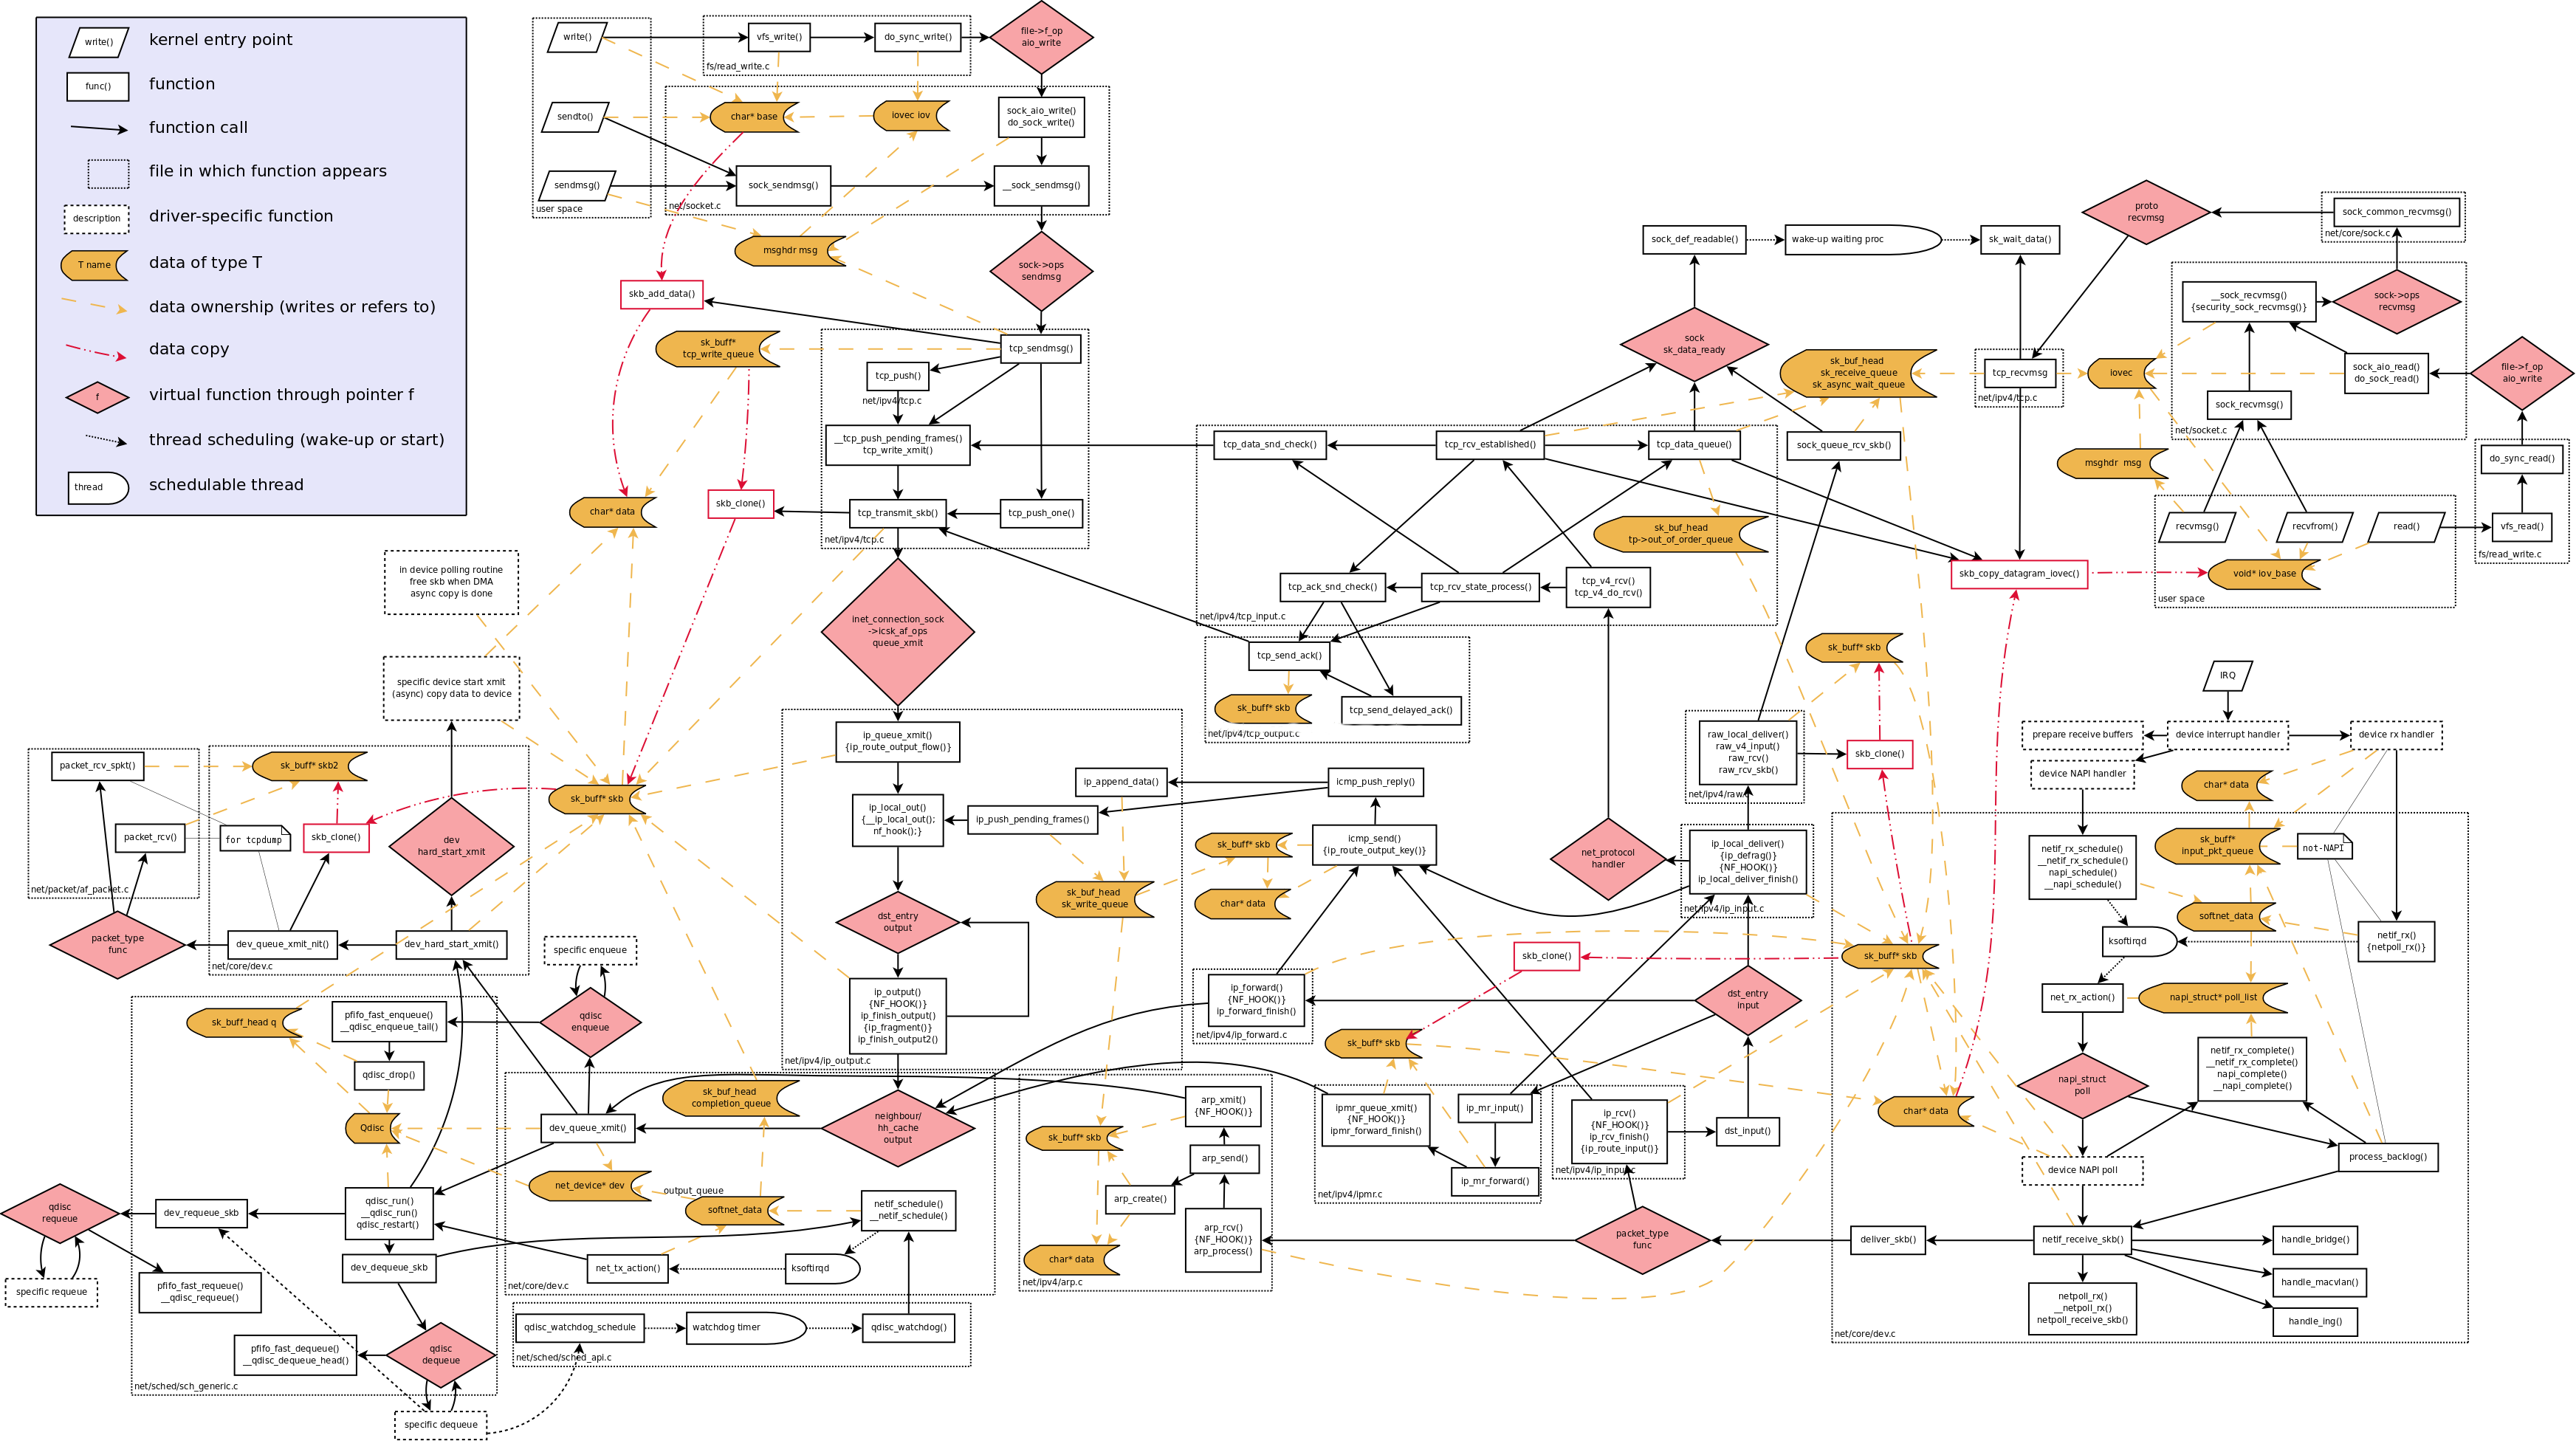
It is not difficult to find that almost all functions in the figure above involve skb structure processing. Therefore, skb->data should be the ideal guide to deeply understand the processing process of network messages in the kernel.
Surftrace is based on ftrace encapsulation and adopts a parameter syntax style similar to the C language. It optimizes the originally tedious configuration to one line of command statements, simplifying ftrace deployment steps significantly. Thus it is a very convenient kernel tracking tool. However, when tracking network messages, it is far from enough to analyze a skb->data pointer. The following obstacles exist:
In view of the problems above, Surftrace has made corresponding special treatments to skb parameters to be convenient and usable.
Let's take the __netif_receive_skb_core ingress function that tracks the reception of network protocol packets as an example. The function prototype definition:
staticint__netif_receive_skb_core(struct sk_buff *skb, bool pfmemalloc, struct packet_type **ppt_prev);The method for parsing the three-layer protocol members of the message corresponding to each skb is:
surftrace 'p __netif_receive_skb_core proto=@(struct iphdr *)l3%0->protocol`The protocol member acquisition method is @(struct iphdr *)l3%0->protocol.
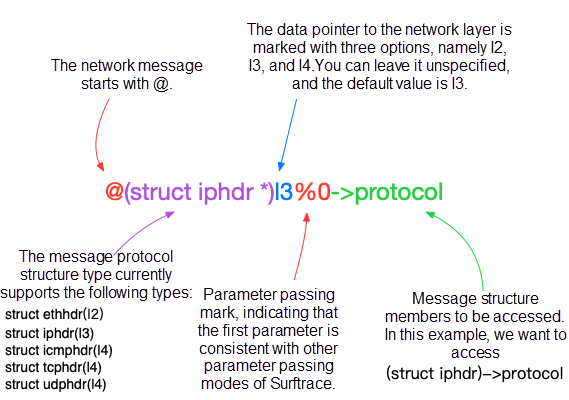
Tips:
Surftrace adds xdata members to the ethdr, iphdr, icmphdr, udphdr, and tcphdr structures to obtain the message content of the next layer. The xdata has the following five types:
| Data | Data Type | Data Length (bytes) |
| cdata | unsigned char [] | 1 |
| sdata | unsigned short [] | 2 |
| ldata | unsigned int j; | 4 |
| qdata | unsigned long long [] | 8 |
| Sdata | char* [] | String |
Array subscripts are aligned according to the bit width. For example, if you want to extract two or three bytes of an icmp message to form unsigned short data, you can obtain it using the following method:
data=@(struct icmphdr*)l3%0->sdata[1]The byte order of network messages adopts the big-endian mode, while our operating system generally adopts the small-endian mode. At the same time, IPv4 uses an unsigned int data type to represent an IP, while we usually use 1.2.3.4 to represent an IPv4 address. The differences above make it very laborious to directly interpret the content of network messages. Surftrace converts the original data according to the prefix naming rules when data is rendered and filtered by adding prefixes to variables in an effort to improve readability and convenience.
| Prefix Name | Data Output Form | Data Length (bytes) |
| ip_ | a.b.c.d | ip string |
| b16_ | decimal | 2 |
| b32_ | decimal | 4 |
| b64_ | decimal | 8 |
| B16 | hexadecimal | 2 |
| B32_ | hexadecimal | 4 |
| B64_ | hexadecimal | 8 |
We catch an unexpected udp message on an instance, which will send data to the target IP 10.0.1.221 port number 9988. Now, we want to determine the sending process of this message. Since udp is a connectionless communication protocol, the sender cannot be locked directly through netstat and other methods. Surftrace can be used to hook the ip_output function:
intip_output(struct net *net, struct sock *sk, struct sk_buff *skb)Tracking expression:
surftrace 'p ip_output proto=@(struct iphdr*)l3%2->protocol ip_dst=@(struct iphdr*)l3%2->daddr b16_dest=@(struct udphdr*)l3%2->dest comm=$comm body=@(struct udphdr*)l3%2->Sdata[0] f:proto==17&&ip_dst==10.0.1.221&&b16_dest==9988'Tracing results:
surftrace 'p ip_output proto=@(struct iphdr*)l3%2->protocol ip_dst=@(struct iphdr*)l3%2->daddr b16_dest=@(struct udphdr*)l3%2->dest comm=$comm body=@(struct udphdr*)l3%2->Sdata[0] f:proto==17&&ip_dst==10.0.1.221&&b16_dest==9988' echo 'p:f0 ip_output proto=+0x9(+0xe8(%dx)):u8 ip_dst=+0x10(+0xe8(%dx)):u32 b16_dest=+0x16(+0xe8(%dx)):u16 comm=$comm body=+0x1c(+0xe8(%dx)):string' >> /sys/kernel/debug/tracing/kprobe_events echo 'proto==17&&ip_dst==0xdd01000a&&b16_dest==1063' > /sys/kernel/debug/tracing/instances/surftrace/events/kprobes/f0/filter echo 1 > /sys/kernel/debug/tracing/instances/surftrace/events/kprobes/f0/enable echo 0 > /sys/kernel/debug/tracing/instances/surftrace/options/stacktrace echo 1 > /sys/kernel/debug/tracing/instances/surftrace/tracing_on <...>-2733784 [014] .... 12648619.219880: f0: (ip_output+0x0/0xd0) proto=17 ip_dst=10.0.1.221 b16_dest=9988 comm="nc" body="Hello World\! @"Through the preceding command, you can determine that the pid sent by the message is 2733784 and the process name is nc.
Next, we start from an actual network problem and describe how to use Surftrace to locate network problems.
We have two instances that have performance problems. After packet capture and troubleshooting, we confirm that the root cause of performance failure is packet loss. Fortunately, this problem can be reproduced by pinging the peer end, and the packet loss rate is around 10%.

After further packet capture analysis, the message is lost in Instance B.
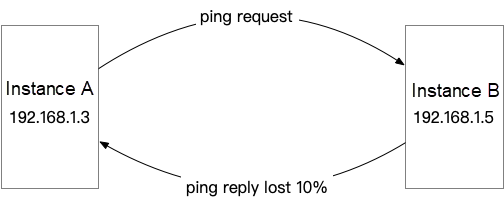
After checking the /proc/net/snmp and analyzing the kernel logs, no suspicious places are found.
According to the map in section 1.1, it is the kernel that pushes the network message to network interface controller driver by the dev_queue_xmit function. Therefore, you can first probe at this exit, filter the ping message, add the-s option, and type out the call stacks:
surftrace 'p dev_queue_xmit proto=@(struct iphdr *)l2%0->protocol ip_dst=@(struct iphdr *)l2%0->daddr f:proto==1&&ip_dst==192.168.1.3' –sThe following call stacks can be obtained:
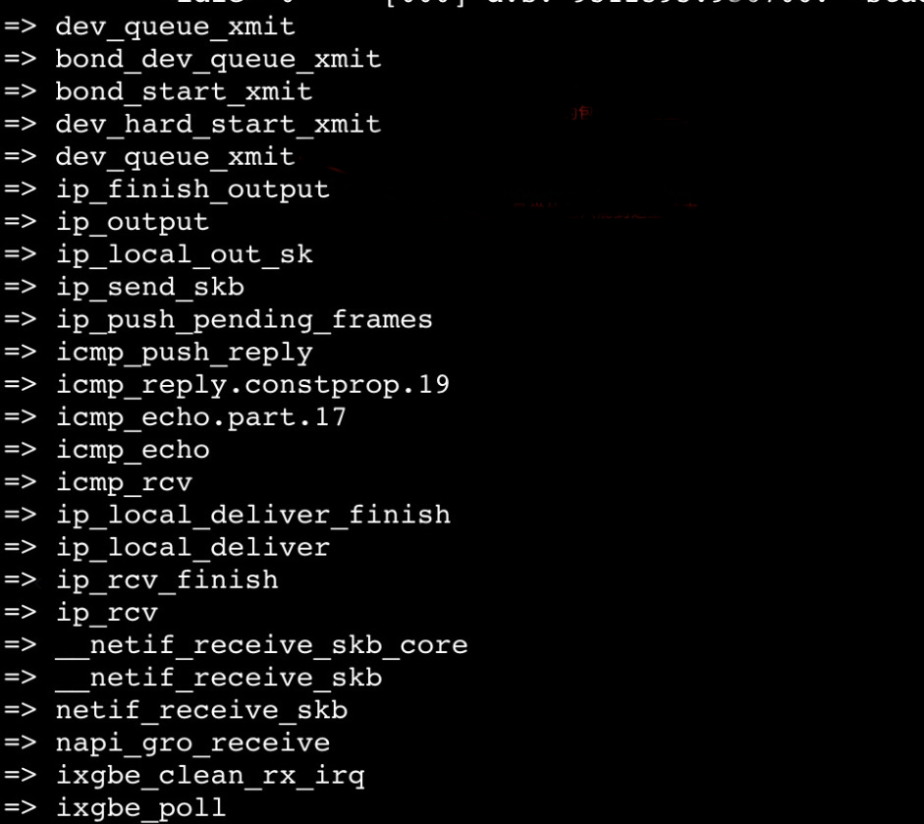
Due to the high probability of problem recurrence, we can focus on the packet sending process first. Upward from the icmp_echo function, we use Surftrace to add a trace point to each symbol to track where the next packet disappears.
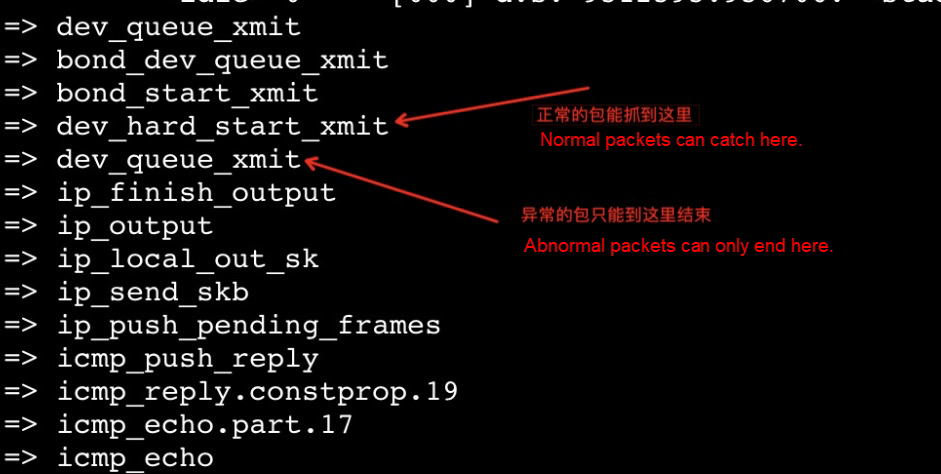
When the problem has been traced here, it should be possible for experienced staff to guess the reason for the packet loss. We might as well look for the exact location of the packet loss purely from a point of view of code. Combined with code analysis, we can find the following two drop points inside the function:
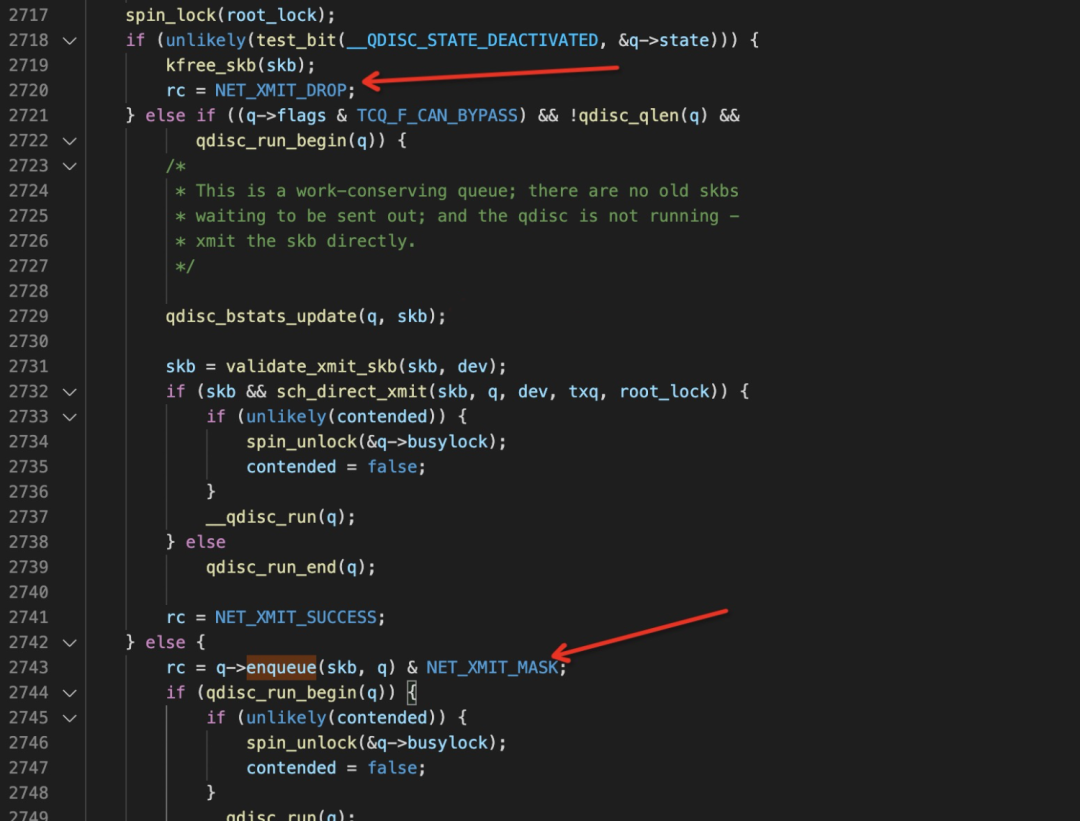
Through the internal tracing feature of Surftrace, combined with the assembly code information, it can be clear that the packet loss point is in the qdisc->enqueue hook function.
rc = q->enqueue(skb, q, &to_free) & NET_XMIT_MASK;Then, we can combine the assembly information:

Find the bx register of the hook function and then print it through Surftrace.
surftrace 'p dev_queue_xmit+678 pfun=%bx'Find and match the pfun value in /proc/kallsyms:

So far, it is clear that htb qdisc causes packet loss. After confirming there is a problem with the related configuration, fall back on the related configuration and restore the network performance.
Surftrace is enhanced in the network layer so that if you only have a relevant network foundation and the basic knowledge of the kernel, you can accurately track the complete processing process of network messages in the Linux kernel with a lower coding workload. It is suitable for tracking the Linux kernel protocol stack code and locating in-depth network problems.
[1] TCP/IP Details
[2] Linux Kernel Design and Implementation
[3] In-depth Understanding of Linux Network Technology
[4] surftrace readmde: https://github.com/aliyun/surftrace/blob/master/ReadMe.md
[5] https://lxr.missinglinkelectronics.com
The SysOM SIG is committed to building an automated O&M platform that integrates features such as host management, configuration and deployment, monitoring and alerting, exception diagnosis, and security audit.
You are welcome to join the SysOM SIG:
What Are the Highlights of Realm Confidential Computing Technology?

99 posts | 6 followers
FollowAlibaba Cloud Community - September 9, 2022
Alibaba Cloud Community - September 16, 2022
OpenAnolis - June 25, 2025
Alibaba Developer - September 7, 2020
Alibaba Cloud Native Community - December 6, 2022
Alibaba Cloud Native Community - January 19, 2023

99 posts | 6 followers
Follow Bastionhost
A unified, efficient, and secure platform that provides cloud-based O&M, access control, and operation audit.
Learn More Managed Service for Grafana
Managed Service for Grafana displays a large amount of data in real time to provide an overview of business and O&M monitoring.
Learn More Alibaba Cloud Linux
Alibaba Cloud Linux is a free-to-use, native operating system that provides a stable, reliable, and high-performance environment for your applications.
Learn More Accelerated Global Networking Solution for Distance Learning
Alibaba Cloud offers an accelerated global networking solution that makes distance learning just the same as in-class teaching.
Learn MoreMore Posts by OpenAnolis