By Steve Chen, Solutions Architect
There are many enterprises who use Windows systems as the majority of the on-premises or cloud infrastructure. However, with the growing number of the hosts and configurations, it becomes very difficult for the IT administrator to manage such a large scale of asset as a part of their daily tasks.
Alibaba Cloud Log Service is a cost-effective and easy-to-manage product to collect local logs from all different log sources, centralize the log storage on the cloud, and analyze the logs in a various ways.
Following sections generally introduce a solution of how to collect logs from a Windows Active Directory (AD) server, store them in Alibaba Cloud Log Service, and define different metrics in the dashboard to analyze AD activities.
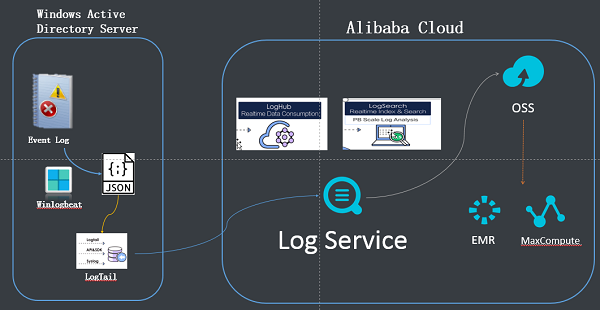
The solution architecture is presented in the following graph. Logtail is a log collection agent provided by Alibaba Cloud Log Service. You can use Logtail to collect logs from servers such as Alibaba Cloud Elastic Compute Service (ECS) instances in real time, however it can work directly with Windows Event Log. So we introduce an open source agent which is called Winlogbeat to be connected with the AD Event Log and output all the event logs to a local file in JSON format, and then Logtail will timely monitor any change in the JSON file and update the incremental log to the Log Service. Once Windows logs arrive the log service on the cloud, customer can either analyze the logs in the Log Service by using SQL scripts and dashboard metrics, or ship the logs to Object Storage Service (OSS) for achieve, or move to MaxCompute or EMR which are Alibaba Cloud's big data warehouse products to process the data in a complex way which might involve machine learnings and AI.
Download and install Winlogbeat, check the service is up and running as following,

Make the configuration in the Winlogbeat to be able to connect to windows event log and save logs to a local JSON file. Following is just an example of the configuration.

winlogbeat.event_logs:
- name: Security
ignore_older: 168h

output.elasticsearch:
hosts: ["elasticsearch.elastic.local:9200"]
template.name: "winlogbeat"
template.path: "winlogbeat.template.json"
template.overwrite: false
Download and install Alibaba Cloud Logtail agent locally on the AD server as well, and the detail of the installation can be found in the following link. In the configuration file, make sure Logtail monitor the Winlogbeat JSON file.
https://www.alibabacloud.com/help/doc-detail/49006.htm
Set up logstore and Logtail in Alibaba Cloud console in order to receive the log from Logtail, which is installed on the AD. The details of the configurations can be found in the following page:
https://www.alibabacloud.com/help/doc-detail/28979.htm
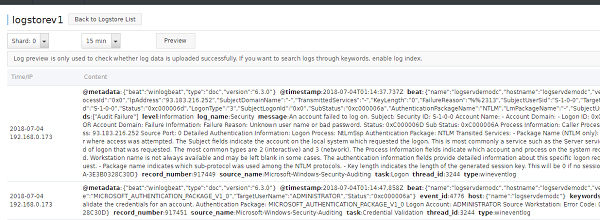
After the proper configuration, you should be able to receive and see following Windows event logs from the AD server in the logstore console.

Based on the logs collected from the AD, you can implement metrics based on your business concern by using SQL scripts. Following are the examples in the demo.
* and event_id: 4625 and event_data.TargetDomainName: LOGSRCHDEMO 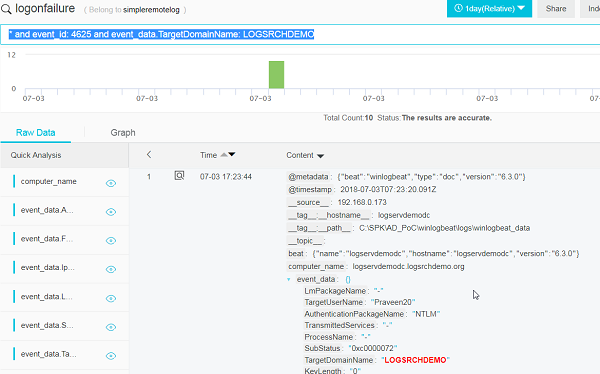
* and event_id: 4625 and event_data.TargetDomainName: LOGSRCHDEMO and event_data.SubStatus: 0xc0000072 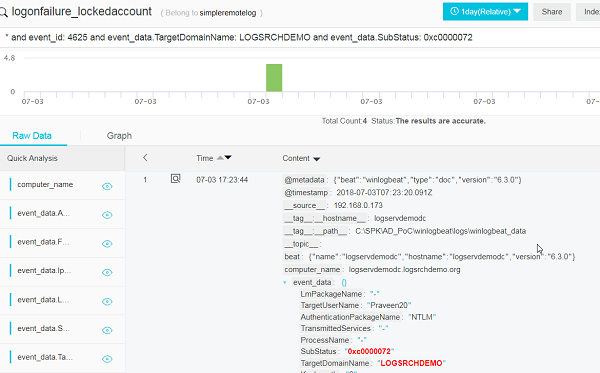
* and event_id: 4732 | select date_format(date_trunc('minute', __time__), '%m-%d %H:%i') as time, count(1) as event_count group by time order by time limit 1000 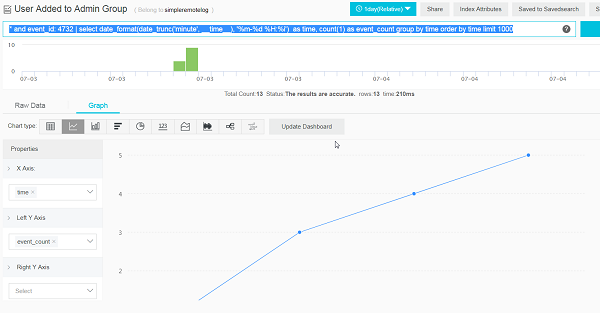
(event_id: 4625 or event_id: 4624) | select date_trunc('minute' ,__time__) as time, computer_name to_system, "event_data.TargetUserName" failed_user, count(*) NoOfFailures from (select __time__, computer_name, "event_data.TargetUserName", "event_data.TargetDomainName" TargetDomainName_prev, event_id, lag(event_id, 1, '4624') over(PARTITION BY computer_name, "event_data.TargetUserName" order by __time__,record_number ) as pre_event_id from log limit 10000) where event_id='4625' and pre_event_id='4625' and TargetDomainName_prev= 'LOGSRCHDEMO' and computer_name is not null group by date_trunc('minute' ,__time__) , computer_name, "event_data.TargetUserName" 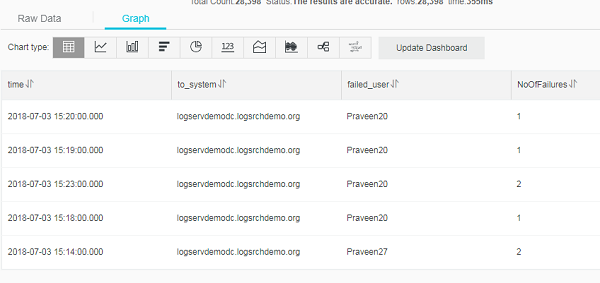
* | create table spk_demo_assets ( computer_name varchar,severity varchar, owner varchar) with ( bucket='spk-logsrchdemo',endpoint='oss-ap-southeast-2.aliyuncs.com',accessid='LTAIH005FxpyZpRg',accesskey ='XL6otNimuROIJKQvcrT5RgLjWDg33R',objects=ARRAY['high_value_assets_unix.csv'],type='oss') 

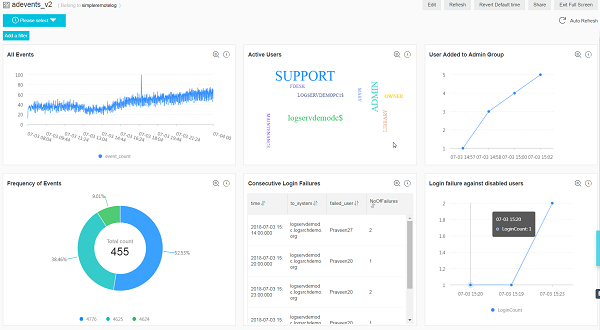
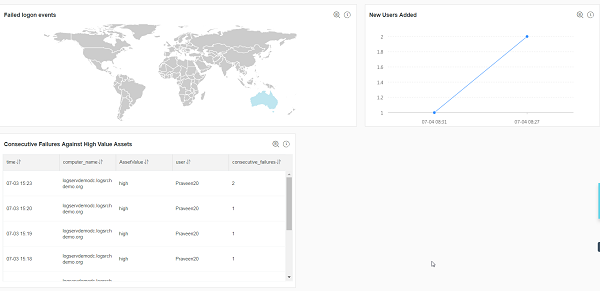
(event_id: 4625 or event_id: 4624) | select date_format(date_trunc('minute', __time__), '%m-%d %H:%i') as time, computer_name, severity AssetValue, user, count(1) as consecutive_failures from (select l.__time__, l.computer_name, l."event_data.TargetUserName" as user, l.event_id, "event_data.TargetDomainName" TargetDomainName, lag(l.event_id, 1, '4624') over(PARTITION BY l.computer_name, l."event_data.TargetUserName" order by l.__time__,l.record_number ) as pre_event_id, r.severity from log l left join spk_demo_assets r on l.computer_name = r.computer_name limit 10000) where event_id='4625' and pre_event_id='4625' and severity='high' and TargetDomainName = 'LOGSRCHDEMO' group by date_format(date_trunc('minute', __time__), '%m-%d %H:%i') , computer_name, severity, user order by time desc limit 100 The following are the dashboards defined in the Log Service console for the same SQL analytics cases, which will presents the statistics in different charts, table and graphs.
How China Is Different (Part 2) – Cloud Infrastructure Networking
How to Install and Configure October CMS on Alibaba Cloud ECS

2,593 posts | 793 followers
Followwjo1212 - January 3, 2019
Apache Flink Community - May 9, 2025
Tim Chen - June 26, 2019
XianYu Tech - December 13, 2021
Alibaba Cloud Community - October 19, 2021
Yudhistira Heriansyah - September 9, 2024

2,593 posts | 793 followers
Follow Simple Log Service
An all-in-one service for log-type data
Learn More OSS(Object Storage Service)
An encrypted and secure cloud storage service which stores, processes and accesses massive amounts of data from anywhere in the world
Learn More MaxCompute
Conduct large-scale data warehousing with MaxCompute
Learn MoreMore Posts by Alibaba Clouder