
The Alibaba Cloud messaging team devoted to Apache RocketMQ™ performance optimization has reached new heights in recent times with the latest TPS for medium-sized and small messages in Apache RocketMQ™ by reaching 470,000. The TPS peak, once, detected on F43 model hit 570,000. How you ask? This article will review some of the techniques we used.
This section briefly describes the methods and techniques used during the optimization of Apache RocketMQ™. Some methods deliver improvements with a limited scope in the message field but bring complexity to coding and Operation and Maintenance (O&M). Although such methods are not applicable at the end, we introduce them below for your reference.
Before we get down to performance optimization at the kernel level, we first need to perform the Java-level optimization. First you must ensure that no other interferences, as well as a complete utilization of the features of JVM preheat (JIT) exist. Our recommendation would be the Benchmark tool JMH developed by OpenJDK.
The biggest hurdle impairing the Java application performance is the JVM pause. We are also familiar with the STW (Stop the World) at the GC stage STW, and in addition to GC, there are many other reasons that affect the Java application, as shown in the figure below.
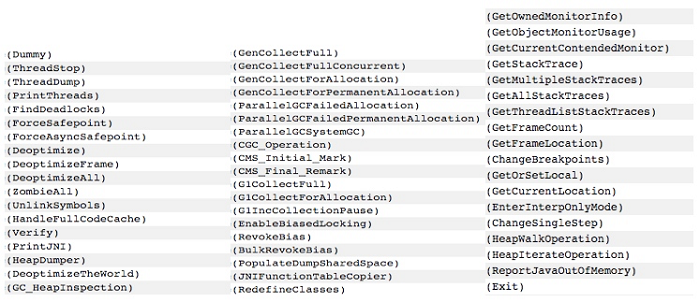
When we suspect that pauses have adverse effects on our Java application, we first need to identify the type of pause affecting it. The following set of JVM parameters can output the detailed security point information:
-XX:+LogVMOutput -XX:LogFile=/dev/shm/vm.log
-XX:+PrintGCApplicationStoppedTime -XX:+PrintSafepointStatistics
-XX:PrintSafepointStatisticsCount=1 -XX:+PrintGCApplicationConcurrentTime
In the Apache RocketMQ™ performance test, we discovered various RevokeBias pauses. The biased locking is essentially used to eliminate the synchronization primitives in the non-competition case to improve performance. However, taking into account that such a scenario is rare in Apache RocketMQ™, the biased locking feature is disabled through -XX:-UseBiasedLocking.
Pauses also cause StopWatch to become inaccurate at times, and the StopWatch often misleads, resulting in time consumption exceptions of a code snippet. Developers spend a lot of time in optimizing it which often goes to waste as on the contrary, what consumes time is the execution of the code pauses. Pause and dynamic compilation are often major traps when it comes to performance testing.
GC has been a savior for Java programmers when it comes to memory management. However, it also brought forward more challenges for developing low-latency Java applications. The optimization of GC is quite tasking when it comes to adjusting parameters, with throughput and delay being the two most significant GC performance attributes. In reality, the objective behind optimization of GC is to seek a compromise between throughput and delay as it is not possible to have both in stride at the same time.
The final GC parameters adopted by Apache RocketMQ™ after GC optimization are as depicted below:
-server -Xms8g -Xmx8g -Xmn4g
-XX:+UseG1GC -XX:G1HeapRegionSize=16m -XX:G1ReservePercent=25
-XX:InitiatingHeapOccupancyPercent=30 -XX:SoftRefLRUPolicyMSPerMB=0
-XX:SurvivorRatio=8 -XX:+DisableExplicitGC
-verbose:gc -Xloggc:/dev/shm/mq_gc_%p.log -XX:+PrintGCDetails
-XX:+PrintGCDateStamps -XX:+PrintGCApplicationStoppedTime
-XX:+PrintAdaptiveSizePolicy
-XX:+UseGCLogFileRotation -XX:NumberOfGCLogFiles=5 -XX:GCLogFileSize=30m
As shown in the above code, we have completely switched to the G1 and we utilized this group of parameters in the online MetaQ cluster for the Double 11 carnival in 2016. It is possible to control the GC time, as depicted, within 20 milliseconds (except some ultra-large shared clusters).
For G1, the official recommendation is to use the -XX:MaxGCPauseMillis to set the target pause duration, and not to manually specify -Xmn and -XX:NewRatio. However, we found in the actual testing that if you specify an overly small target pause duration (10 milliseconds), G1 will adjust the new generation to a very small size, resulting in more frequent YGC, and faster consumption of the older generation. Thus, we manually designate –Xmn to 4g, achieving the expected 10 milliseconds of target pause duration when the GC frequency is not high. Here it also shows that some common tuning experiences do not apply to all product scenarios. We can only establish the most appropriate tuning method by conducting more and more tests and sometimes we may have to take a road less traveled.
At the same time, we would also like to share an encounter about a pitfall you may come across while using CMS. The -XX:UseConcMarkSweepGC defaults the use of ParNew for the new generation while using the CMS collector. When the default number of threads used for the parallel garbage collection and the number of CPUs are less than eight, or more than 8+ (ncpus-8) * 5/8, a large number of garbage collection threads running at the same time will result in a lot of pauses, leading to glitches. You can use -XX:ParallelGCThreads to specify the number of parallel threads.
Moreover, we recommend to avoid the use of finalize() method for resource recovery as in addition to its unreliability; it will also increase the GC pressure.
Furthermore, we also tried Azul's commercial virtual machine Zing, which uses a C4 garbage collector. The primary advantage of Zing is that its GC pause duration does not increase with the heap size increase, making it particularly suitable for scenarios with ultra-large stacks. Also, the heap used by Apache RocketMQ™ was small, and it required memory for PageCache. Thus we did not adopt Zing.
Java applications will always have a wide range of thread pools. The top two considerations for the use of thread pools are:
For settings on the number of thread pools, you can refer to the Java Concurrency in Practice book:
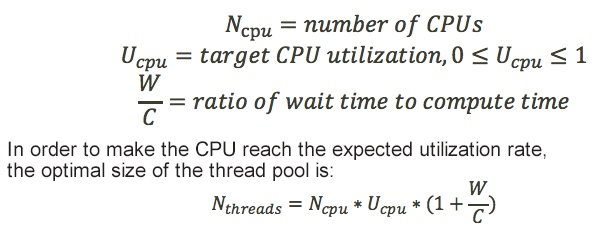
It is worth noting that increasing the number of threads will not improve the performance. It will only result in additional performance loss due to multithreading as most businesses are intrinsically serialized, carrying out a series of parallel and serial jobs. To find potential parallel capabilities, we need to splice it properly as concurrency cannot break the serial limit, and is subject to Amdahl's law.
If the number of threads is not unreasonably set or the thread pool not unreasonably spliced, we may observe fake competition. The CPU resource utilization will be low, along with the business throughput. Moreover, in such cases, it is hard to locate the bottleneck through performance analysis tools. To identify the unreasonable points and short slabs, we have to analyze the thread model very carefully.
In fact, when we sort out the existing thread models of Apache RocketMQ™, we can find some unreasonable settings on the number of threads, the tuning that will deliver remarkable improvements in the performance.
The tuning attempts for CPU mainly focus on the affinity and NUMA.
CPU affinity is a scheduling attribute that allows a thread to be "bound" to a CPU to avoid frequent migration between processors. There is an article by IBM that sheds more light on this.
At the same time, there is an open-source Java library to support the completion of CPU affinity binding through calling APIs on the Java language layer. See Java-Thread-Affinity to delve deeper into this topic. The library illustrates how to bind a thread to the CPU. If you need to bind a thread inside the thread pool to the CPU, you can do it by customizing the ThreadFactory.
We bound the core threads in Apache RocketMQ™ to the CPU, and found that the effect was not obvious. Considering the introduction of third-party libraries, we gave up this method. The assumption that the effect was not obvious is due to the fact that we have used lockless programming on the core link to avoid the glitch caused by context switching.
Context switch is indeed more time-consuming and incurs glitches. The following figure shows the test simulating context switching through LockSupport.unpark/park. We can see that the average time consumption for switching is in microseconds. However, we may come across glitches of milliseconds, occasionally.
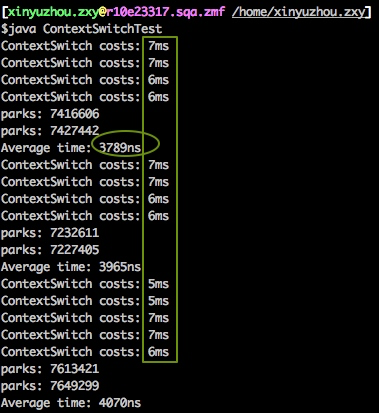
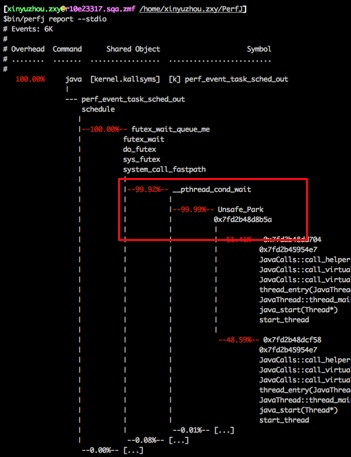
We can also observe that unpark/park will indeed incur context switching, through Perf.
Furthermore, there is a kernel configuration item isolcpus, which can isolate a group of CPUs from the system but is not in default use. We can configure the parameter in GRUB, and will take effect after the machine re-starts. Upon isolating the CPU, we can assign tasks to these CPUs by CPU affinity binding or taskset/numactl to achieve optimal performance.
The attitudes towards NUMA are generally mixed as in a database scenario. Our advice is to turn off NUMA, however, by understanding the principle of NUMA, we feel that theoretically, NUMA is helpful for enhancing the performance of Apache RocketMQ™.
We discussed how concurrency tuning cannot break Amdahl's law, as there will always be short slabs in some serial parts. The same rule applies to the CPU. With the increase in the number of CPU cores, CPU utilization is getting increasingly lower. In a 64-core physical machine, Apache RocketMQ™ can only run to about 2500% as all the CPUs need to read memory through the north bridge. For the CPU, the memory is shared, and the memory access here is the short slab. The need to solve this issue resulted in the introduction of NUMA-architecture CPU.
The structure of two NUMA nodes is as shown in the figure below. Each NUMA node has its own local memory, and the memory of the whole system is distributed inside the NUMA node. The local memory access (Local Access) speed of a NUMA node is three times faster than the speed of accessing the memory of another node (Remote Access).
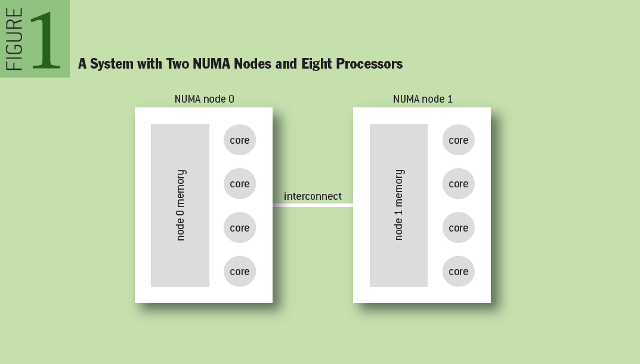
The test on the NUMA architecture shows that Apache RocketMQ™ performance has seen improvement by an impressive 20%. Most of the online physical machines support NUMA architecture. For the dual-line CPU with two nodes, we can consider preparing two virtual Dockers for Apache RocketMQ™ deployment based on the physical division of NUMA, to maximize the performance value of the machine.
One can test NUMA's impact based on their own applications' performance. In case NUMA has been disabled for machines on the BIOS level in your group, and you need to test the impact, just enable NUMA by following the steps described below:
1.Switch on the BIOS:
The mode for the switch-on relates to the server.
2.Configure and enable NUMA in the GRUB
vi /boot/grub/grub.conf
Add the boot parameter: numa=on
3.Restart the machine
4.View the number of NUMA nodes
numactl --hardware
If you see more than one node, it indicates that it supports NUMA.Linux memory exists in the following three categories:

The Satiny Smoothness - METAQ2016 Double 11 summary details the do's and don'ts in the memory access process, while providing methods to eliminate access to anonymous memory and PageCache.
To increase usage of memory address space as well as manage the memory more effectively, the operating system provides an abstract concept of primary memory – virtual memory (VM). With virtual memory, the addressing from the virtual memory to the physical memory is necessary. During the memory allocation of processes, the system allocates a series of virtual pages through the VM system. The true physical page allocation is not involved now. When the process starts to access virtual memory, if the corresponding physical page is absent, a missing page exception will trigger. Then it will call the page missing exception handler in the kernel for memory recovery and distribution.
Two types of page errors exist:
To improve the efficiency of memory access, you need to observe the page error messages of the process. The following command can achieve this purpose:
1. ps -o min_flt,maj_flt <PID>
2. sar –B
If you observe that the Major Fault is relatively high, ensure that you have the system parameter vm.swappiness set properly. We recommend setting a smaller value (0 or 1) when the machine memory is sufficient to tell the kernel not to use the swap area on the disk as much as possible. The principle for selecting 0 and 1 is as follows:

Remember to not set the parameter to 0 for versions later than 2.6.32, as it will cause the kernel to disable the swap feature. When the memory is insufficient, the swap will not happen even at the cost of OOM. Some time back, we came across a fault due to improper swap settings.
The following methods are also available to avoid triggering page errors and frequent memory swaps:
1.-XX:+AlwaysPreTouch: As the name suggests, this parameter allows the JVM to access all the memory at startup to ensure its readiness after startup, and to avoid page faults.
2.For out-of-heap memory allocated by ourselves or memory mapped from files by mmap, we can preheat the memory on our own. The following four preheating ways are available. The first one is not a desirable way to go about it, and the last two are the fastest ways for preheating the memory.
3.Even after preheating the memory, there is still a chance of swap-out in the later period when the memory is insufficient. If you want the data to reside in the memory, you can lock the memory through mlock/mlockall system call. We recommend JNA to call these two interfaces. However, we can note that the kernel does not allow locking of a lot of memory. We can use the following commands to increase the upper limit of lockable memory:
echo '* hard memlock unlimited' >> /etc/security/limits.conf
echo '* soft memlock unlimited' >> /etc/security/limits.confAs a matter of fact, the operating system memory takes 4k for a page. In the Linux virtual memory mentioned earlier, there must be a page table (Page Table) to store the mappings between the physical page and virtual page. In the CPU access, we use the page table search to locate the physical page before accessing the memory. To improve the addressing speed, a high-speed cache called Translation Lookaside Buffer (TLB) exists in the CPU. It contains a part of the page table information, and serves to achieve the conversion from a virtual address to a physical address quickly.
However, the TLB has a fixed size, and it can only save a small part of the page table information. The acceleration effect for ultra-large page table is moderate. For a 4K memory page, if the system allocates 10GB of memory, the page table will have more than two million entries. TLB is too small to accommodate this volume of entries. We can query the number of TLB entries using cpuid. The number of 4K entries usually reaches up to thousands and the acceleration effect is limited.
To improve the hit rate of TLB, most CPUs support huge pages. We can divide such huge pages into 2MB and 1GB, and 1GB huge page is the best choice for ultra-large memory. We can use the grep pdpe1gb /proc/cpuinfo | uniq command to check whether the CPU supports 1-GB huge pages.
We need to configure the kernel startup parameters to open a huge page, hugepagesz=1GB hugepages=10. Setting the number of huge pages is achievable through the kernel startup parameter hugepages or /proc/sys/vm/nr_hugepages.
After the kernel opens the huge page, the Java application can use the huge page in the following methods:
o For heap memory, the JVM parameter that we can use is: -XX:+UseLargePages
o If you need out-of-heap memory, you can mount hugetlbfs through mount, mount -t hugetlbfs /hugepages, and then allocate huge page memory via mmap.
The use of huge pages is a complicated process. Linux provides transparent huge page (THP) that can automatically create, manage and use huge pages. We can disable or enable THP by modifying the /sys/kernel/mm/transparent_hugepage/enabled file.
The huge page, however, has a drawback that in case the memory pressure is high and a swap-out is required, the system will split the huge page into small pages to be swapped out, and then merged into one huge page to be swapped in. The process will increase the pressure on the CPU.
An engineer with LinkedIn made an interesting attempt: He enabled THP when the memory pressure was low, and disabled THP when the memory pressure was high. Through this dynamic adjustment, he could achieve optimal performance. You can read more on it here: Ensuring High-performance of Mission-critical Java Applications in Multi-tenant Cloud Platforms.
A variety of NIC performance diagnostic tools are available, such as ethtool, ip, dropwatch, and netstat. Apache RocketMQ™ tries two operation methods: network card interruption and interruption aggregation.
In the network card interruption optimization, the top consideration is whether we need to disable irqbalance used to optimize the interruption allocation, distributing interruption load through an automatic collection of system data. Among the factors taken into consideration, energy savings is a major one. However, irqbalance has a drawback that may cause the interruption to drift automatically, resulting in instability. We recommend to disable it in a high-performance scenario.
After we disable the irqbalance, we need to bind all the queues of the NIC to the CPU. Currently, the NIC comprises of multiple queues. If only one CPU is processing the interruptions of all queues, the multi-core advantage will be difficult to exert, thus, we can bind these NIC queues to the CPU one by one.
Note that this part of optimization is vital for improving the performance of Apache RocketMQ™ small messages.
The idea of interruption aggregation is similar to the Group Commit that avoids the interruption at each frame arrival. Apache RocketMQ™ may trigger nearly 20,000 interruptions per second, at its maximum performance. If we can aggregate some interruptions, it would be of great help in the performance improvement process.
We can set the rc-frames-irq and rx-usecs parameters of the network card through ethtool to determine the number of frames or time length elapsed to trigger an interruption. Noteworthy is that the interruption aggregation may bring a certain delay.
Currently, in the latest performance benchmark test of Apache RocketMQ™, the TPS of 128-byte, small message reached upto 470,000, as shown in the figure below:

High-performance Apache RocketMQ™ can apply to more scenarios, take over and replace more ecologies of Kafka. At the same time, it can handle the hotspot issue to a large extent, taking the lead in low latency while maintaining high performance. As shown in the figure below, Apache RocketMQ™ has very few glitch delays lasting 10 milliseconds to 50 milliseconds, while Kafka has many glitches lasting 500 milliseconds to 1 second.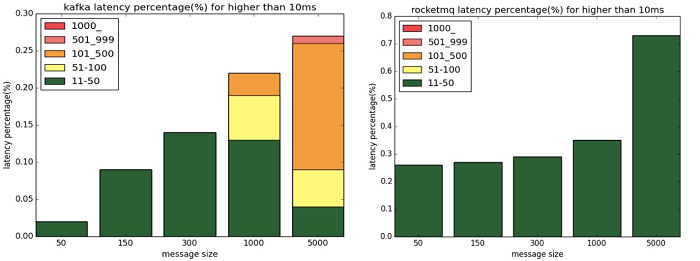
Root Cause Analysis and Countermeasures of Common Issues of Websites

2,593 posts | 793 followers
FollowAlibaba Clouder - November 19, 2019
Aliware - October 20, 2020
Alibaba Developer - August 24, 2021
Alibaba Clouder - March 19, 2018
Alibaba Cloud Native Community - March 14, 2023
Alibaba Cloud Native Community - January 5, 2023

2,593 posts | 793 followers
Follow ApsaraMQ for RocketMQ
ApsaraMQ for RocketMQ is a distributed message queue service that supports reliable message-based asynchronous communication among microservices, distributed systems, and serverless applications.
Learn MoreMore Posts by Alibaba Clouder
Raja_KT February 14, 2019 at 7:11 am
Interesting to see NUMA ( 2 nodes). Tested against 4? Also THP is case-to-case basis.