By Alex Mungai Muchiri, Alibaba Cloud Tech Share Author. Tech Share is Alibaba Cloud's incentive program to encourage the sharing of technical knowledge and best practices within the cloud community.
So, you have subscribed to an Alibaba Cloud service and deployed your system, but have you tested it yet? Testing software performance is one of the most important aspects of development. Performance testing is used by software developers and ICT experts to ascertain the behavior of the system under various workload conditions. It forms a key component of quality assurance. Software performance constitutes one of the major non-function testings of software systems. There are two types of performance tests that are classified as:
Load testing involves subjecting the software to an anticipated load and observing its performance. The Application Under Test in stress testing is subjected to workload levels beyond what is expected to handle. The test determines the breaking point of the software.
Apache JMeter is a performance testing tool that simulates high workload. Developed by Apache Foundation, the tool is one of the most popular testing tools in existence. Its uses range from web application testing, REST APIs, SOAP APIs, and mobile applications. It tests both functional performance and behavior. Developers use the tool to simulate heavy loads on virtual servers, networks to check strength, tests the ability to handle heavy loads and determine system performance for a variety of loads.
To follow this tutorial, you will need a personal computer to run JMeter and a server where your software is installed. In this example, we will be testing a LEMP stack WordPress site running on a 1CPU 1GB RAM Alibaba Cloud Elastic Compute Service (ECS) virtual server. We will run our JMeter application on our PC.
Avoid running the tests on a live production server because it may compromise system performance and negatively affect services. This tutorial could be applied to any web applications that have been deployed.
One of the most useful properties of JMeter is the ability to skew tests depending on a variety of metrics. You could vary the computing resources available to JMeter as well as network bandwidth between the tool and the test server. However, you can increase the load pushed to the server under test by running non-graphical JMeter tests or having it distributed across JMeter servers.
Our tutorial involves the use of the JMeter desktop application and as such, there are many operating systems that could be used to run the tool. It is, therefore, not very useful to cover intricate details about installing it to the respective operating systems. But it a very easy tool to install, and using a package manager is the easiest method of them all. The other option would be to download the files from the official website and install Java version 6. If you need to download these components, follow these links:
Installing Java is simple for all operating systems, but you may have to help JMeter find Java and keytool binaries by adding a Java bin directory in your PATH environment. The PATH where JMeter was installed will be referred to as $JMETER_HOME. For Linux-based operating systems, the binary can be found at $JMETER_HOME/bin/jmeter. In Windows operating systems, it is located at $JMETER_HOME/bin/jmeter.bat.
The JMeter tool that has been installed on your personal computer will be used to plan for your tests, running load tests, and analyzing load tests. It has a guided interface for you to create manual plans, select plan templates, or record browser sessions. You can also use the interface for debugging and accessing results. After preparing the test plans, the command line is used to run tests in a non-GUI mode that can either yield a CSV or XML file. JMeter can then generate reports from the data in HTML formats. Since the tool is based on Java, you should have no problem running it in any platform where Java is installed.
If you plan on JDBC testing, install a JDBC driver to your database cross path or alternatively, include in the jmeterlib folder a jar file.
The simple installation procedure for Java is as follows:
On Windows, download and run the executable file on your computer.
For CentOS 7.x, download the updated rpm and run the command below:
yum localinstall jdk-8u152-linux-x64.rpmIn Ubuntu 16 system, run the command below:
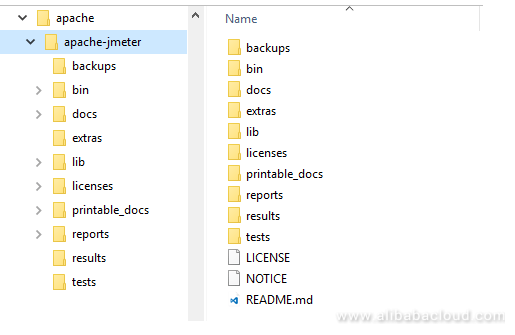
sudo apt-get install oracle-java8-installerThe file directory for the installed Apache JMeter is as shown in the image below. The image also includes tests, results, and report directories

In the lib directory above, you can add any jar files that you need for your tests such as JDBC database drivers. You are recommended to store test scripts in the tests directory. The reports directory stores generated HTML Dashboard Reports while the results directory stores results.
A test plan guides JMeter in the execution of a test run. Typically, a sample test is comprised of:

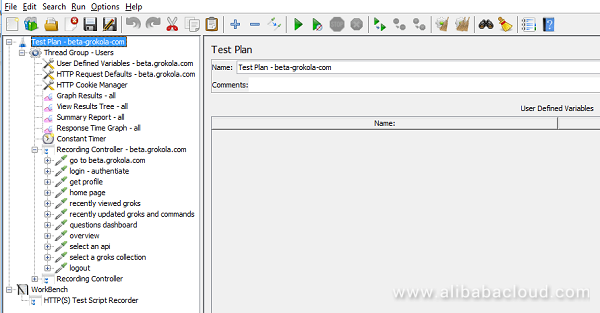
The interface has a list of elements that can be added to the test plan. Furthermore, when you choose an element from the tree, changes take effect immediately, just remember to save to a file prior to running the test. The file menu has an option to "Save" or "Save Test Plan as". Also, check the "Save Workbench" so that it is saved alongside the test plan.
On the Run menu, there is a Start option to run any test plans. The Stop command initiates the stoppage of the threads at the next possible moment. A Shutdown prompt will stop the run after all the runs have completed and do not interrupt active work.
A test plan will be the topmost object of the tree and the elements below constitute its objects.
Configuration elements include:
Thread groups constitute the beginning points of test plans and includes controllers and samplers. Thread groups determine JMeter threads used in executing a test by allowing you to:
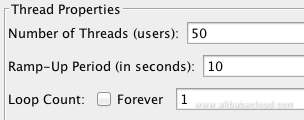
All threads are independent of each other during execution, but collectively, they contribute to the successful execution of the test. You can also have concurrent threads connecting to your server. JMeter uses the ramp-up period to determine how long to take in getting all the threads up and running. For instance, if we had 5 threads and we set the ramp-up period as 50 seconds, JMeter takes 50 seconds to get all 5 threads running, or one thread every 10 seconds. It is necessary to maintain a decent ramp-up period to avoid unnecessarily large workloads when starting a test, but also short so that as tests complete running, others are up.
JMeter includes two controller types:
The controllers are responsible for test processing. Samplers initiate sending of requests to servers by JMeter and await server response, in the order they appear on the tree. Logical controllers allow customization of JMeter requests such as when to send requests to the server. You can also use a recording controller to log HTTP requests for use in the testing script.
They allow you to access test information gathered by JMeter test runs while in progress. They include:
Listeners also file data for later use in a specified file. You can also choose configurations to save certain fields in either CSV or XML formats.
Timers allow for a delay between sampler executions in JMeter. By default, the program executes them sequentially without any delay between requests.
Post-processors kick-in after sampler requests have been made. They are attached to sampler elements and execute after the running of the element.
Upon initialization of JMeter, the Test Plan field on the interface should be empty as shown below:

We shall need to add a test plan that is in line with what we have covered about JMeter in the discussion above.
Follow the steps below:
There are three important properties of thread groups that you need to keep in mind:

The next step is to set the HTTP Request Defaults using the Config Element. It comes in handy when sending multiple requests to a server. Adding HTTP Request Defaults to a Thread Group is as follows:
In HTTP Request Defaults, under the Web Server section, fill in the Server Name or IP field with the name or IP address of the web server you want to test. Setting the server here makes it the default server for the rest of the items in this thread group.

This option allows you to add cookie support if your server uses the web tracking technologies. Follow the procedure below:
Use this option to include an HTTP request sampler in your selected thread group.
You will need to fill the Path with items to be accessed by each thread. In our case study, that has been set to /, which means all threads access the server homepage. There is no need to specify paths since those were already catered for under HTTP Request Defaults.
The results of JMeter load tests are output in the listeners. The tool has numerous listeners as has been highlighted. We shall use the Table in this case:
Our first simple test plan is all set up and ready to run. After you save the test in a specified file name, select View Results in Table, click Run and initialize the test using the Start. The table below shows the results of our sample test run.

Well, it is time to interpret the results that are displayed in the results table. The green triangle indicates if a request was successful and most probably all of them will indicate green. There is even more information contain details about Sample Time (Ms) and Latency.
In our sample case study, the sample time lies consistently between 128 and 164 Ms. Geographical distance is the most important factor that affects Sample Time if your server is sufficiently resourced. In the test case, the server responded well to 50 users making requests over 10 seconds. Now it is time to try increasing the load and see how well the system responds.
In the next step, the load is increased to 80 in 10 seconds. Below are the results:

The server is clearly beginning to get burdened by requests. We can explore this information further by logging into the VPS and check resource utilization.
Our VPS resource utilization looks like so without JMeter test running:

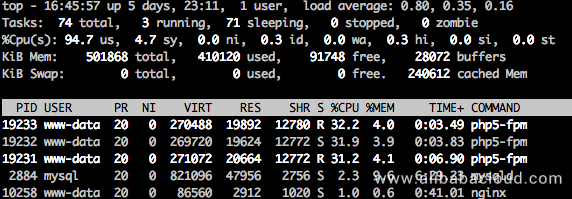
Rerun the test on JMeter and monitor resource usage, our case study yielded the results in the below:

It is evident that there is substantial consumption of both CPU and RAM resources. To meet the increasing workloads, our servers need to either be optimized or we increase the CPU. We could also host the database in a different server. You can keep up the load till when there is substantial performance breakdown.
JMeter has many uses in the context of performance improvements and server optimizations. In this article, we have demonstrated how to use JMeter to create and run simple test plans on an Alibaba Cloud Elastic Compute Service (ECS) instance. You can use a variety of customizations available to test how your server responds to real-life simulated requests. Hope you enjoy trying out the samplers, listeners and configuration tools available on JMeter.
Using CrateDB with PHP PDO for a Real-Time IoT Project on Alibaba Cloud
Alibaba Clouder - March 14, 2017
ApsaraDB - November 25, 2022
zcm_cathy - December 7, 2020
Alibaba Cloud Native - September 11, 2023
Alibaba Clouder - December 1, 2020
Alibaba Clouder - November 30, 2018
 ECS(Elastic Compute Service)
Elastic and secure virtual cloud servers to cater all your cloud hosting needs.
Learn More Elastic High Performance Computing Solution
High Performance Computing (HPC) and AI technology helps scientific research institutions to perform viral gene sequencing, conduct new drug research and development, and shorten the research and development cycle.
Learn More Mobile Testing
Provides comprehensive quality assurance for the release of your apps.
Learn More Elastic High Performance Computing
A HPCaaS cloud platform providing an all-in-one high-performance public computing service
Learn MoreMore Posts by Alex