By Zhang Chunmei (Niutu)
This article is intended to help you ensure the high availability of your business systems under cloud native through the following three approaches:
The concept of "high availability" for a system can often be divided into business availability and service availability. A high-availability system is designed with features to ensure both business stability and service availability, as well as to accommodate for frequent code and functional testing.
High-availability systems can be divided into the following types by feature or business implementation:
Resources and business services are two major considerations for satisfying business needs or completing business maintenance. More importantly, we should ensure high availability of the business service system architecture in every aspect by using tools and techniques. A high-availability system provides PTS and AHAS, both of which are commercially available. AHAS includes online traffic protection and fault drills.
The following figure shows the evolution of PTS.
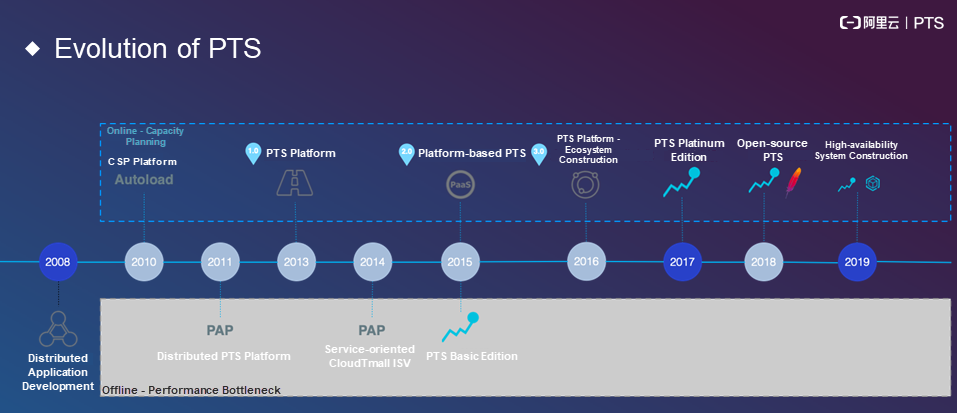
Alibaba initiated performance testing and distributed development in 2008 and started capacity planning through tools such as Cryptographic Service Provider (CSP) and Autoload in 2010. Since then, Alibaba has been conducting offline performance testing on a variety of platforms, such as the Password Authentication Protocol (PAP)-based distributed stress testing platform. However, offline testing resulted in a series of problems, including inaccurate test results due to the differences between the production environment and the offline environment in scale and code configuration. This may cause stress testing to output meaningless results.
To solve these problems, Alibaba tried to conduct online testing by using CSP. This involved analyzing logs based on online traffic to identify the APIs used and their general proportions through log playback. However, log playback has a disadvantage. The simplest POST method rarely ships data to forms. Even if data is logged, it may not be used properly. Alibaba released PTS 1.0 in 2013. PTS 1.0 supports comprehensive stress testing, including basic data construction and inter-link API configuration. The constructed data can all be read during the stress test process. In 2014, Alibaba used the independent software vendor (ISV) platform for data output, but this platform was used for offline testing in a way similar to the previous PAP-based platform.
In 2015, Alibaba released PTS Basic Edition, which requires advance data writing and item stress testing in the form of scripts. In the same year, Alibaba made PTS into a platform based on third-party components, such as payments. Alibaba explored a series of approaches to platformization, such as mocking and link streamlining. By 2016, Alibaba had built a variety of business systems to support more ecosystem businesses. Alibaba began to steer in the direction of intelligence. In 2017, Alibaba released PTS Platinum Edition. In 2018, PTS was made open source and made to support stress testing through Apache JMeter. In 2019, Alibaba deeply integrated performance testing with high-availability modules.
After more than a decade of development, PTS has gradually become a mature platform.
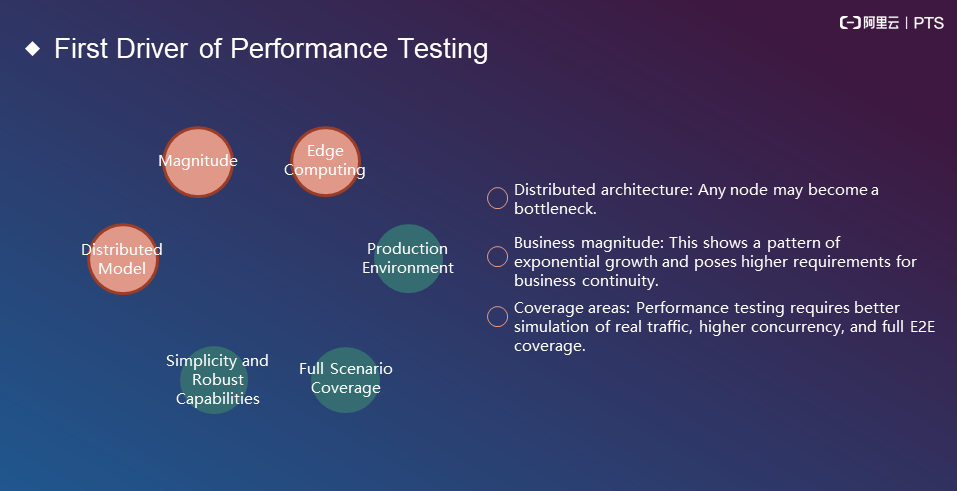
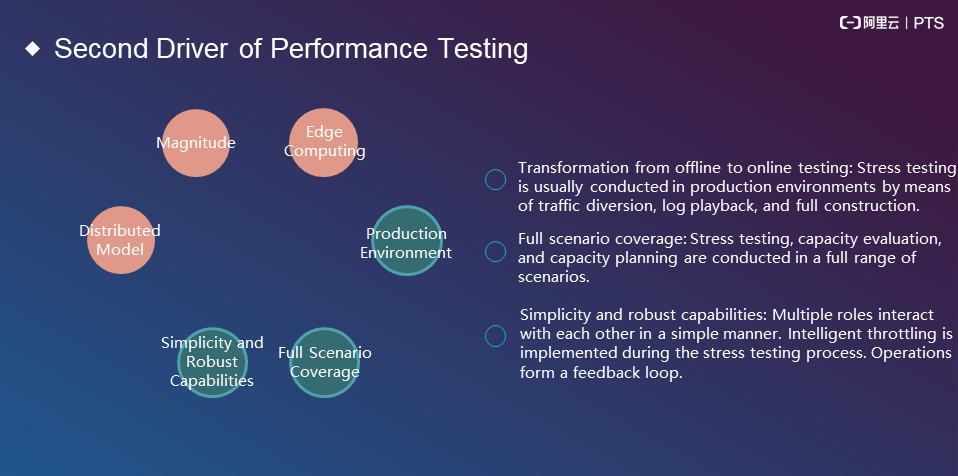
Simplicity and robust capabilities: These features require three things:
Problems occur in every phase of stress testing no matter what the test scale is. The following model was created to solve these problems:
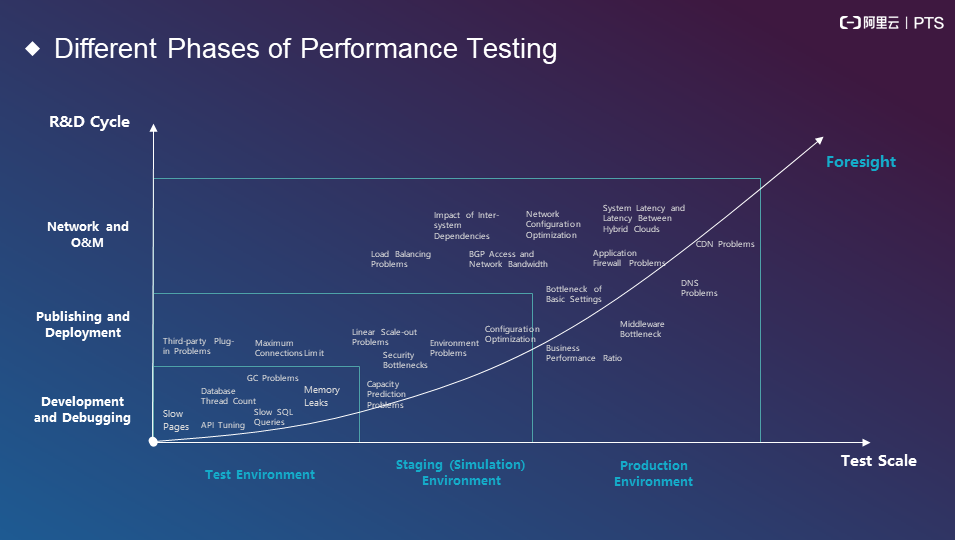
In short, a non-production environment is prone to code-related problems, such as garbage collection (GC) problems, memory leaks, and improper configurations. These problems can lead to other problems in a production environment, which are related to systems, traces, and generic layers, such as load balancing problems.
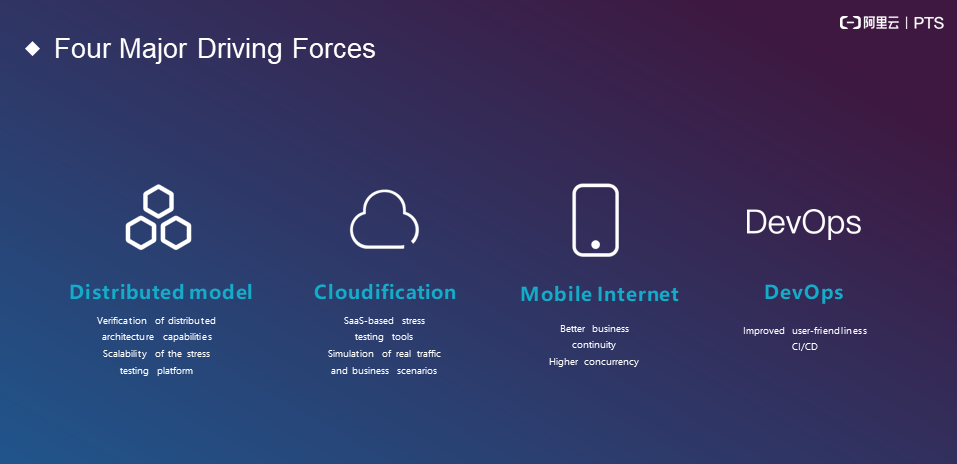
We can summarize the following four drivers:
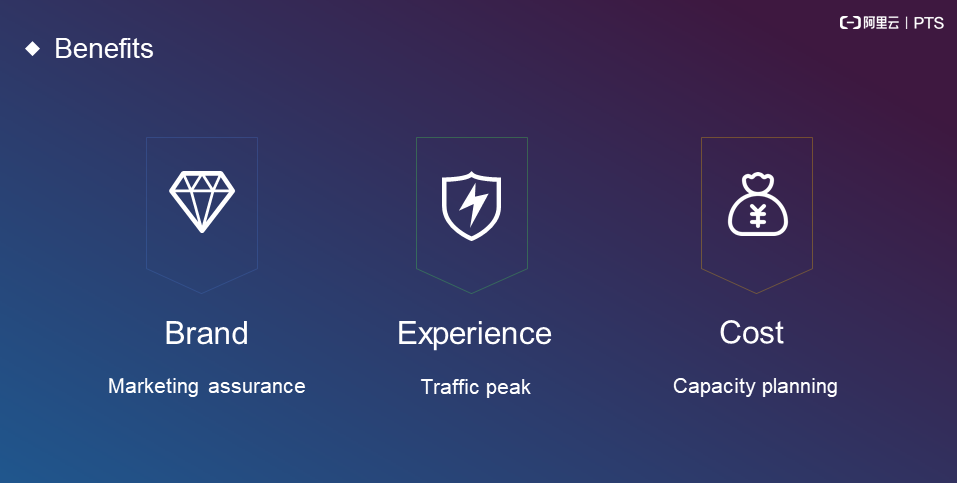
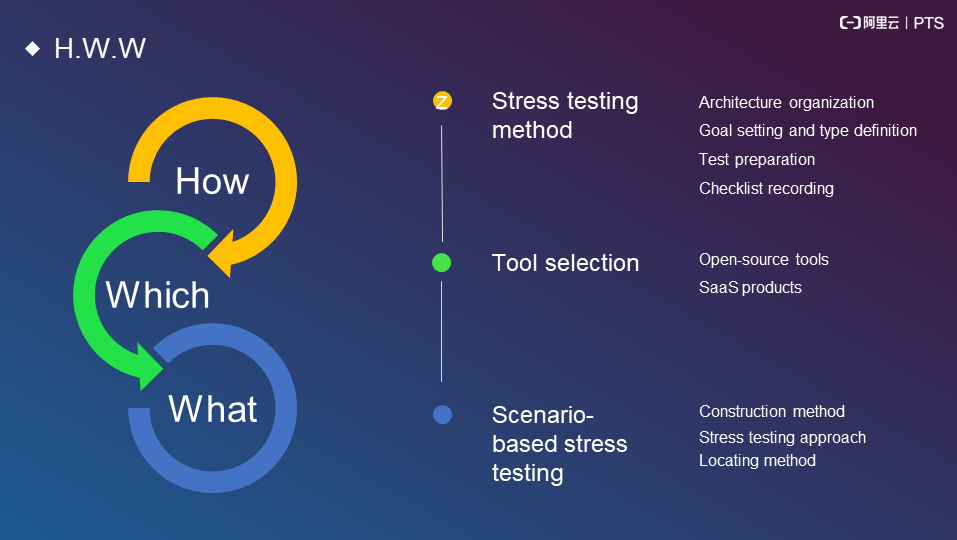
Capacity evaluation is divided into three steps:
Step 1: Select a stress testing method
(1) Organize the related architecture; (2) Set a goal and determine the approach to achieve the goal; (3) Make test preparations, including data preparation and model preparation; and (4) Develop a checklist to record the important things to do.
Step 2: Select tools
(1) Open source tools and (2) Software as a service (SaaS) products
Step 3: Conduct scenario-based stress testing
(1) Construction method; (2) Stress testing approach; and (3) Locating method
The following section explains how to select open-source tools and SaaS products. JMeter is used as an example.
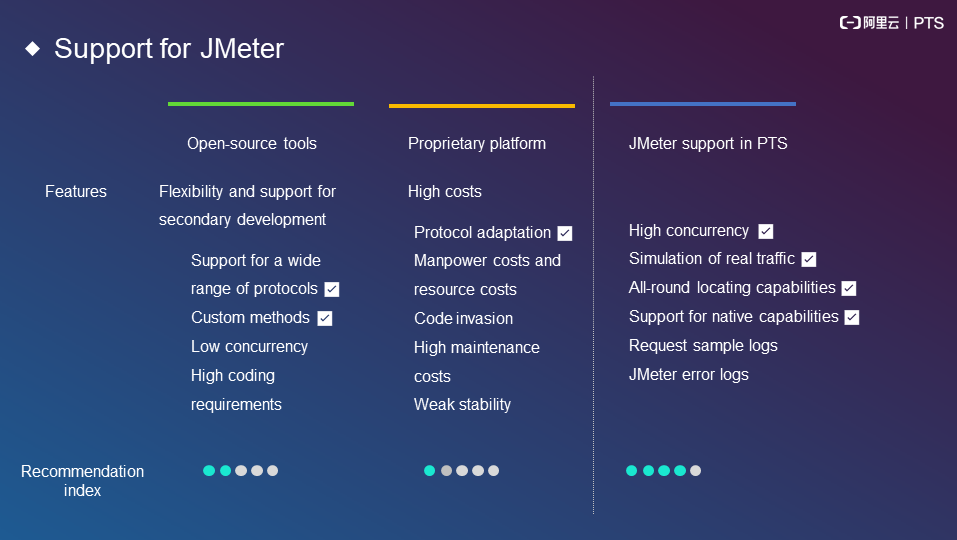
SaaS tools are more cost-effective than open-source tools.
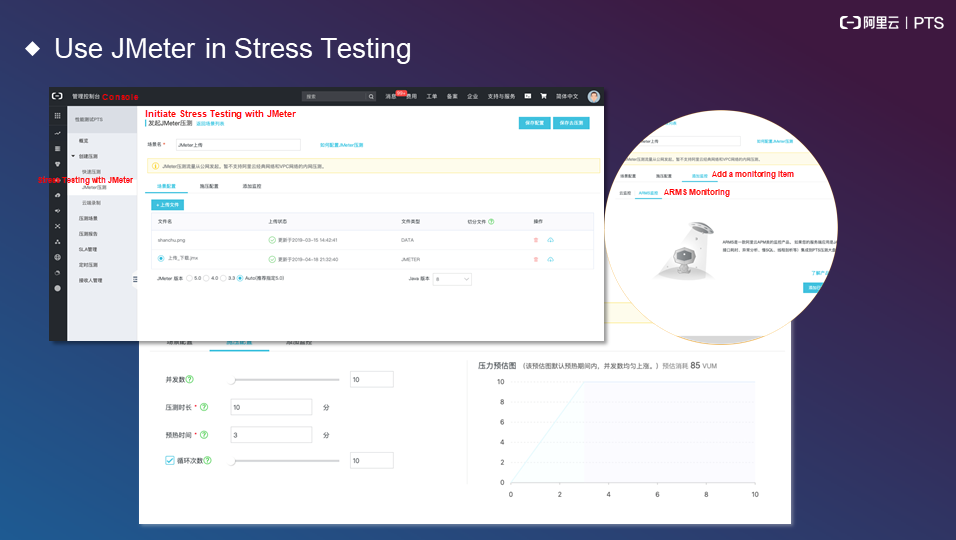
The following figure shows some logs in a stress testing report.
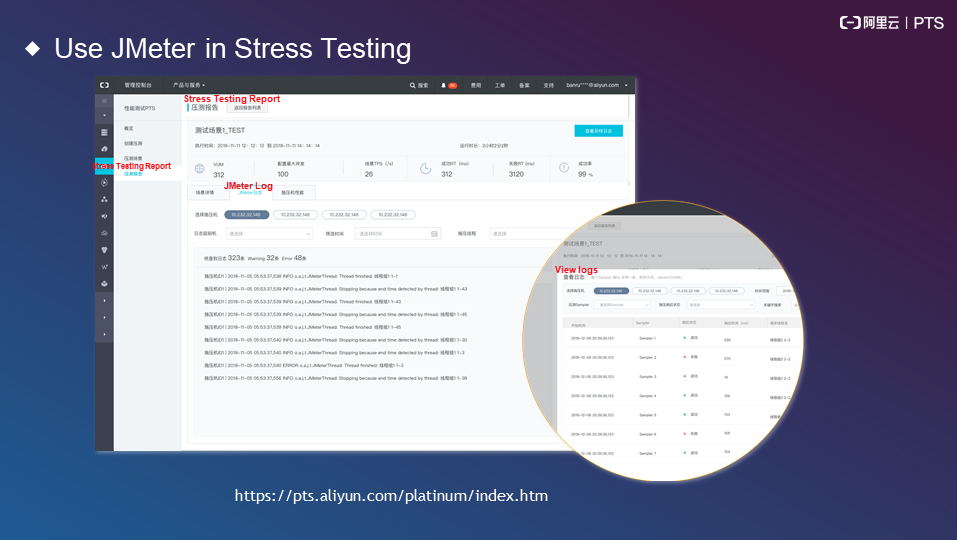
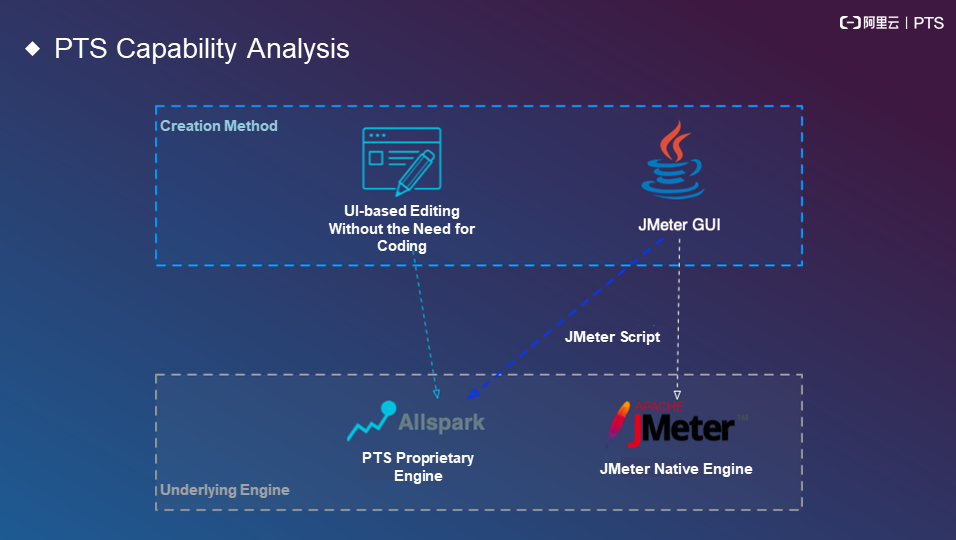
The preceding section discusses JMeter. PTS provides a proprietary engine as one of its core capabilities. This engine assumes an important role in Alibaba's Double 11 Shopping Festival. At present, two engines are commonly used: the proprietary engine and the native JMeter engine. The proprietary engine uses a pure-UI edit mode and requires no code maintenance or local maintenance. You only need to maintain data files.
The following figures show the capabilities of PTS in a flowchart.
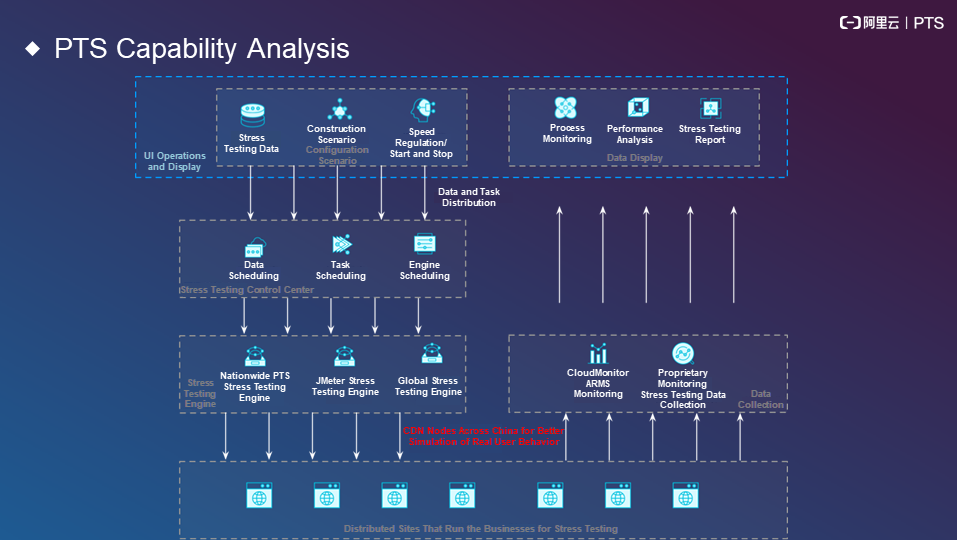
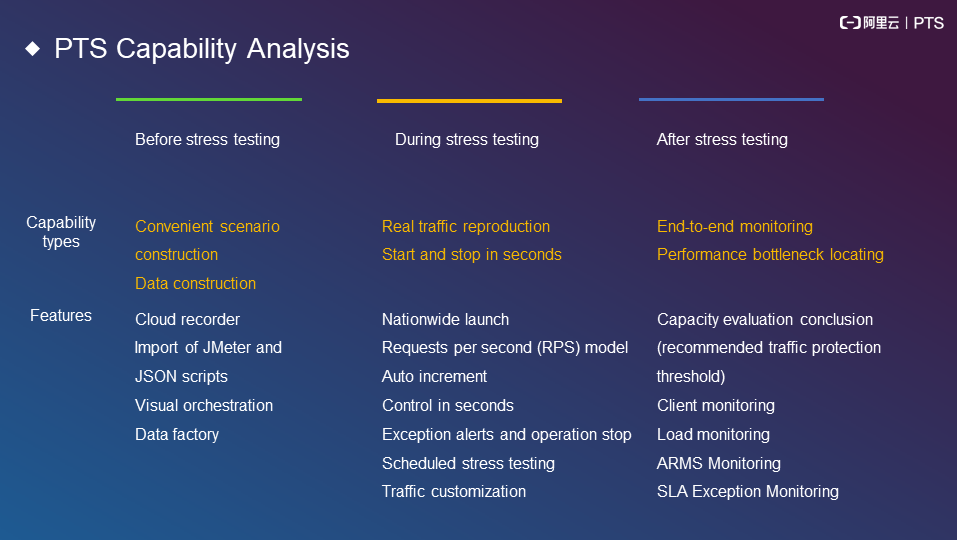
The following figure shows the capabilities of PTS based on different phases of stress testing.
Recording from the cloud: After you configure a proxy, you can record ongoing operations on a PC.
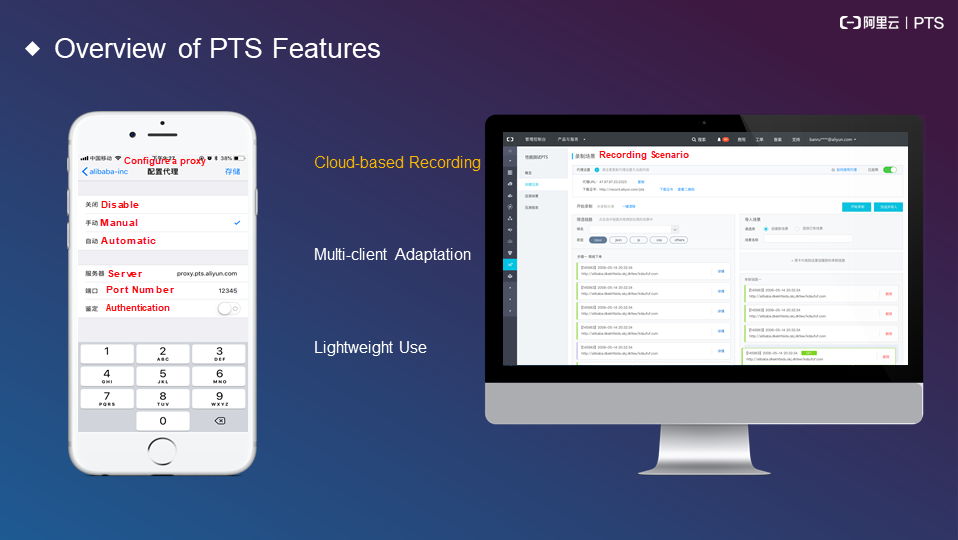
The following figure shows the features of PTS.
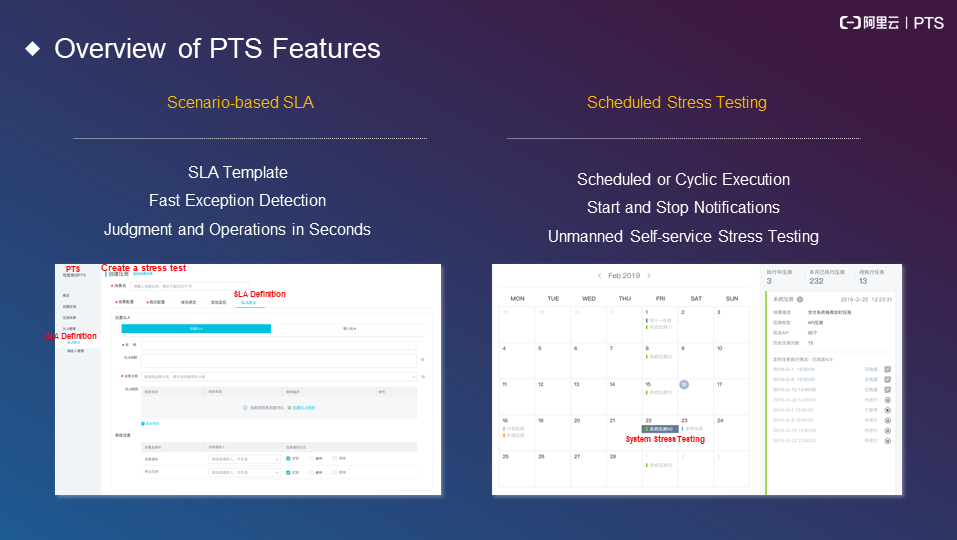
Service level agreement (SLA): You can determine an SLA for stress testing. For example, the response time (RT) cannot exceed 500 ms, and the success rate cannot be less than 99.99%. If the success rate is less than 99.99%, you can trigger an alert or stop stress testing. This helps you monitor the accuracy of a stress test in progress.
Scheduled stress testing: This is commonly used by scheduled activities, such as monthly promotions and weekly iterations. You can perform an iteration over a period of several minutes and then analyze the iteration results the next day. You can also conduct unmanned stress testing by developing an SLA and setting a status success rate.
The following figures show some problems that may occur during the stress testing process.
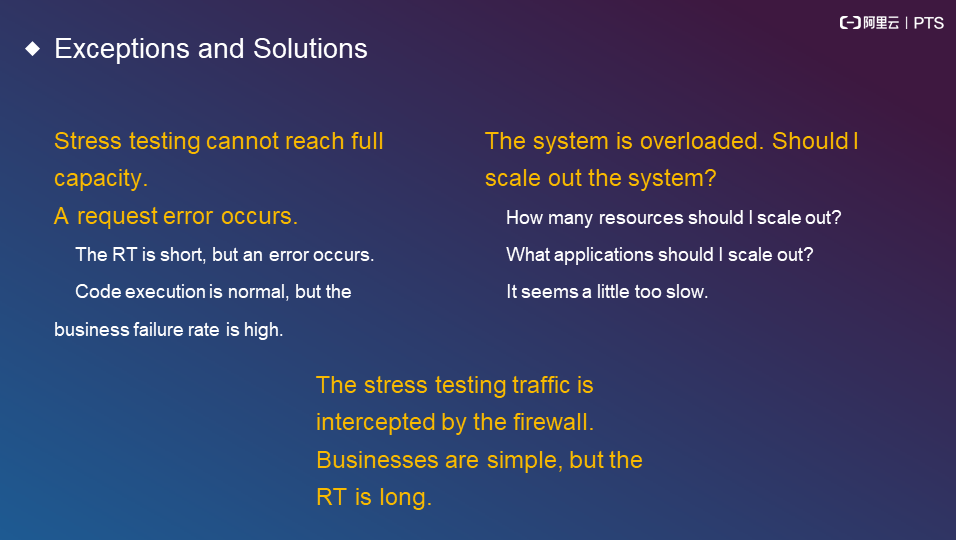
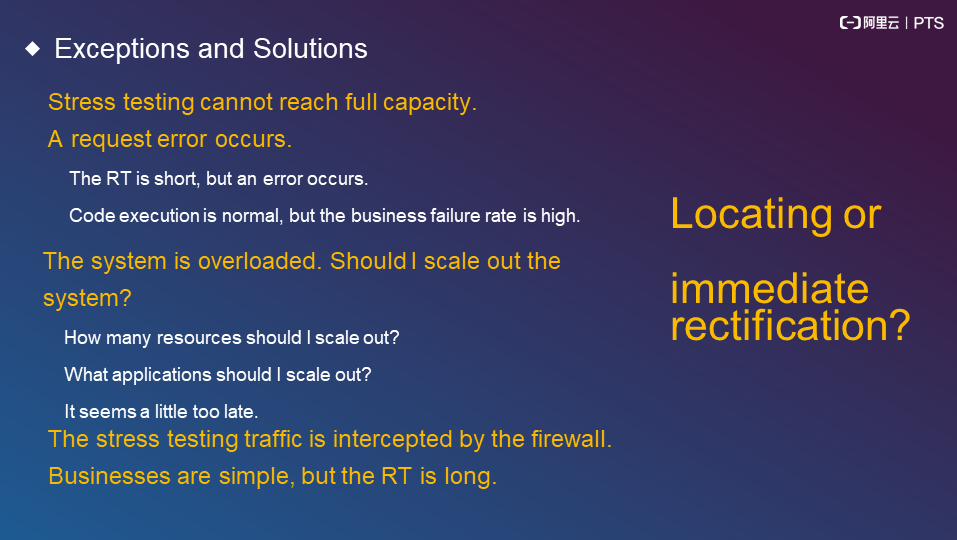
The difference between predictions and reality is also a problem that deserves attention. For example, we usually conduct scale-out for online education before Chinese New Year to cope with the rising number of online education users during the holiday. In the case of an unexpected incident, such as the current epidemic, we must conduct scale-out again to meet the needs of more users. If this happens, we must determine the target capacity and take a series of protective measures in case more problems occur.
Problems must be handled in an effective, multi-level, and multidimensional manner.
The following figure shows statistics from the Double 11 Shopping Festival in 2018.
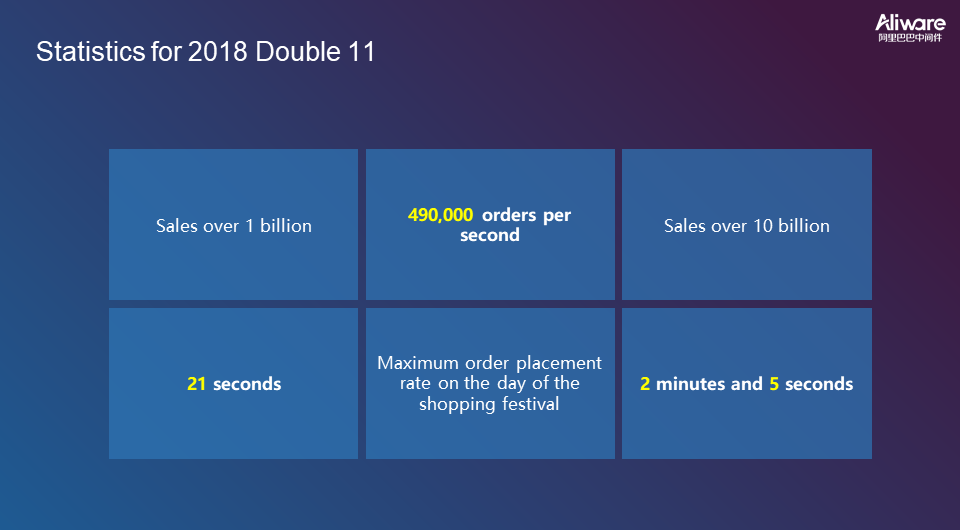
These statistics indicate two points:
(1) The volume is very large and (2) This volume occurs in a short period of time.
Under such circumstances, it is necessary to handle problems promptly to avoid any impact on customers. Otherwise, they may leave the purchase page.
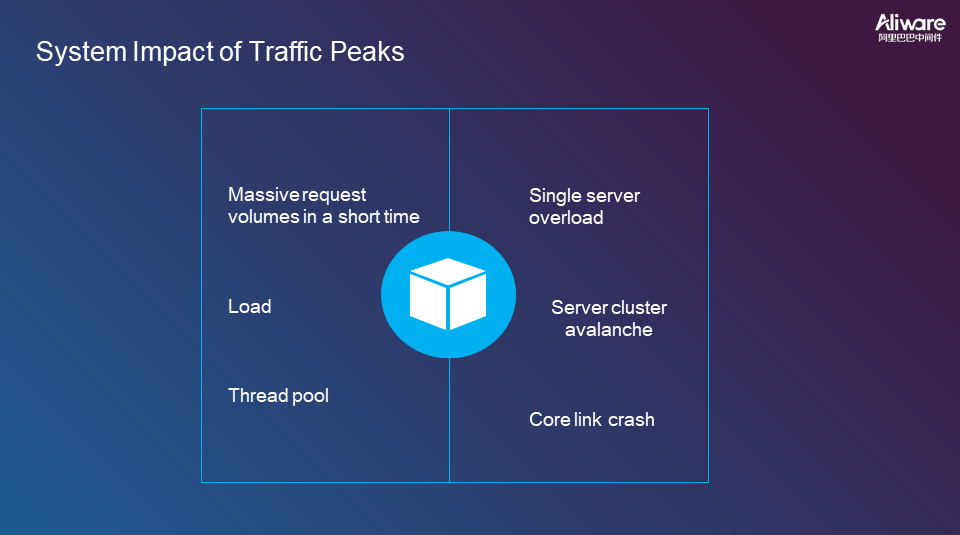
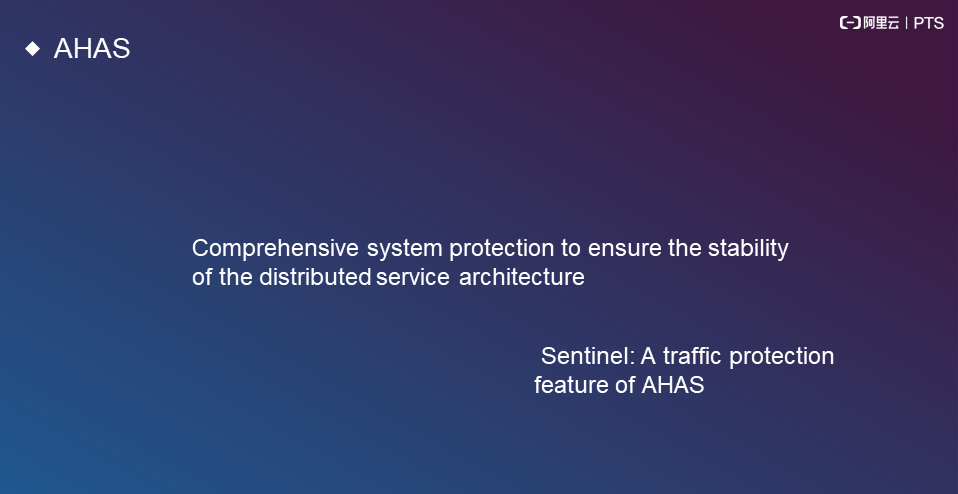
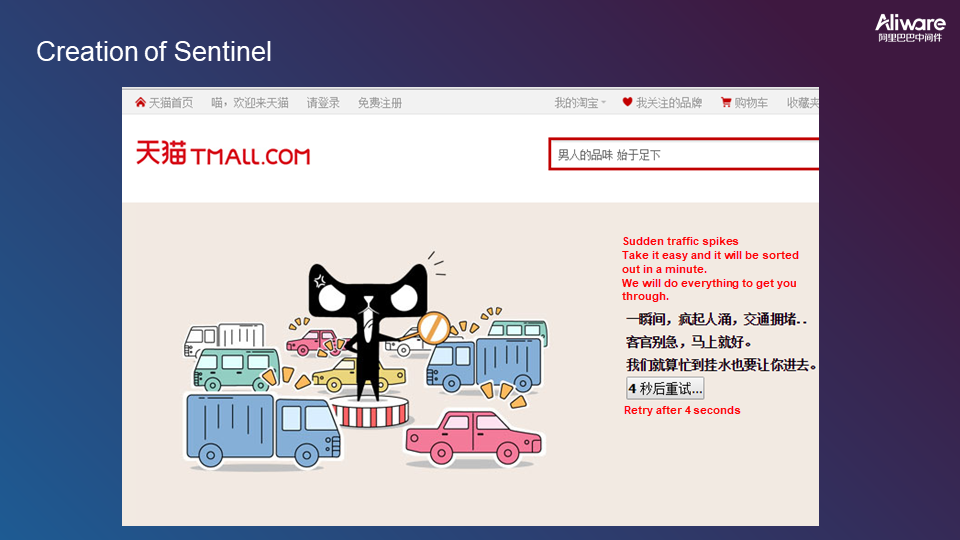
Creation of Sentinel: The following figure shows a classic interface from Double 11, which indicates throttling in progress. This is intended to avoid system avalanche due to traffic peaks and ensure most customers enjoy a good experience. Therefore, we developed traffic protection tools.
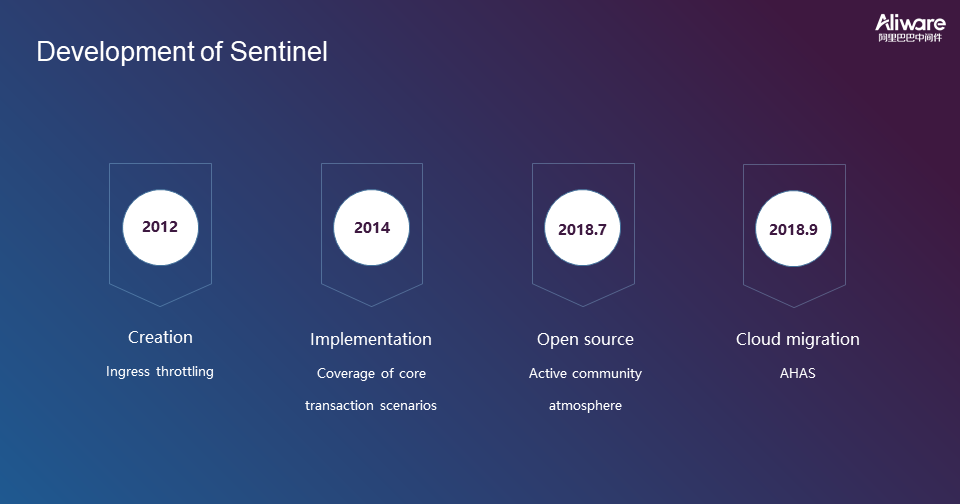
Sentinel is a lightweight control framework based on a distributed architecture. It ensures the stability of systems and services when faced with traffic peaks through the following measures:
(1) Throttling; (2) Circuit breaking; (3) Traffic shaping; and (4) System protection
The following figure shows the Sentinel architecture.
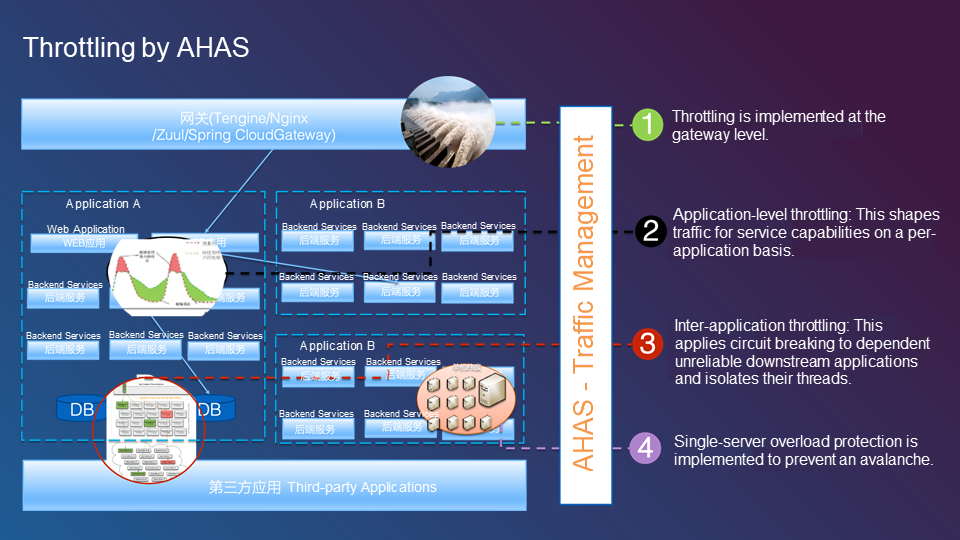
Throttling can be implemented on the gateway. Applications in a distributed architecture are clustered and different applications can call each other. This allows us to implement application-level traffic shaping for staggered traffic management.
Common application scenarios include:
The following metrics are considerations for traffic protection:
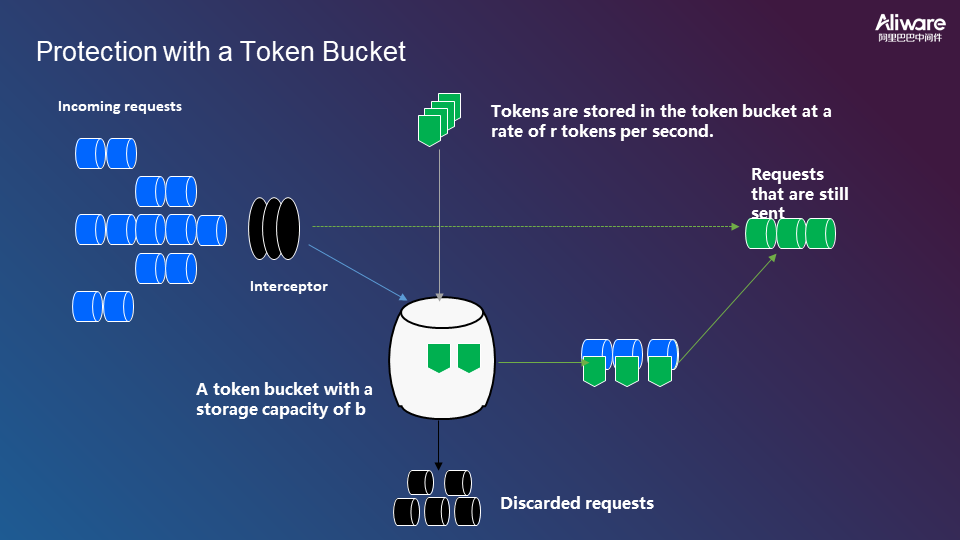
The following section explains how circuit breaking works.
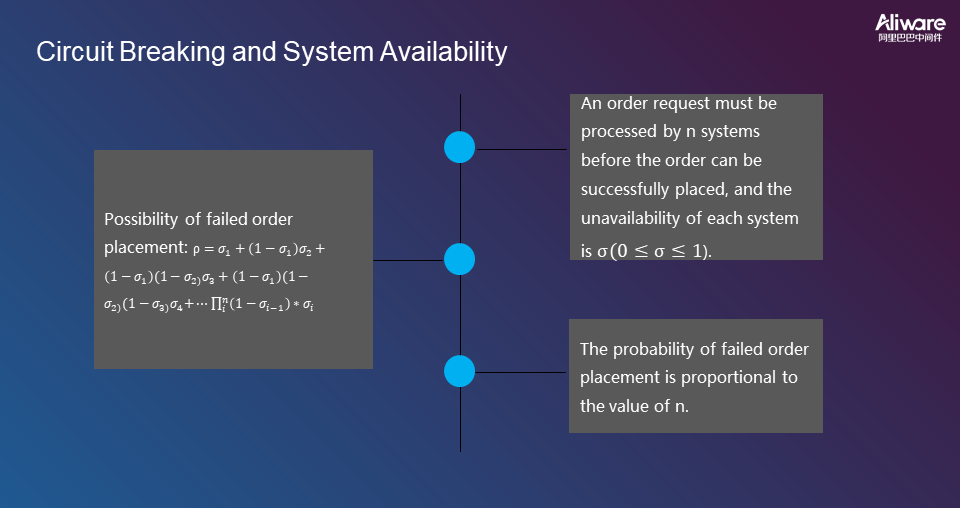
The probability of failed order placement is proportional to the number of links.
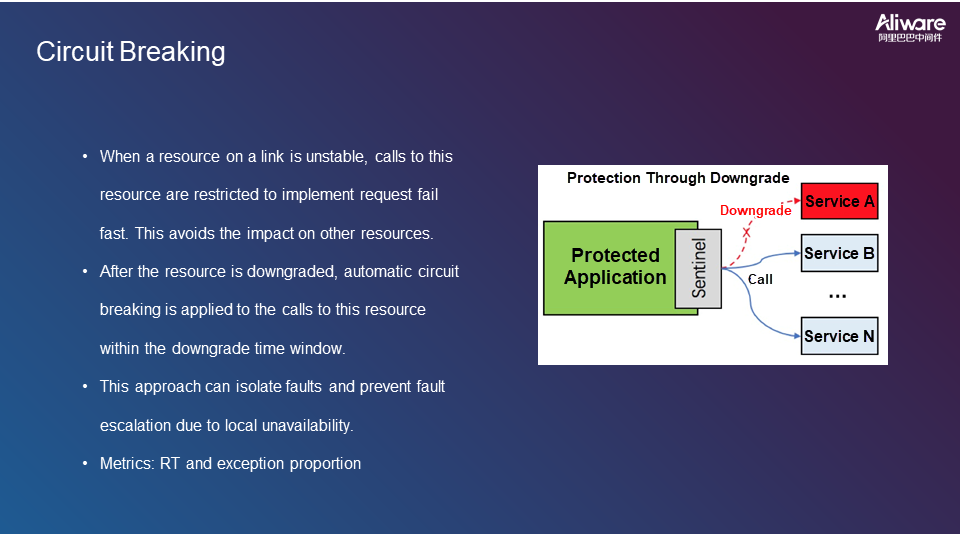
Some of the protected applications are unavailable and one of them is abnormal. Therefore, this application is downgraded to ensure the normal operation of other services. In other words, when a resource on a link is unstable, calls to this resource are restricted.
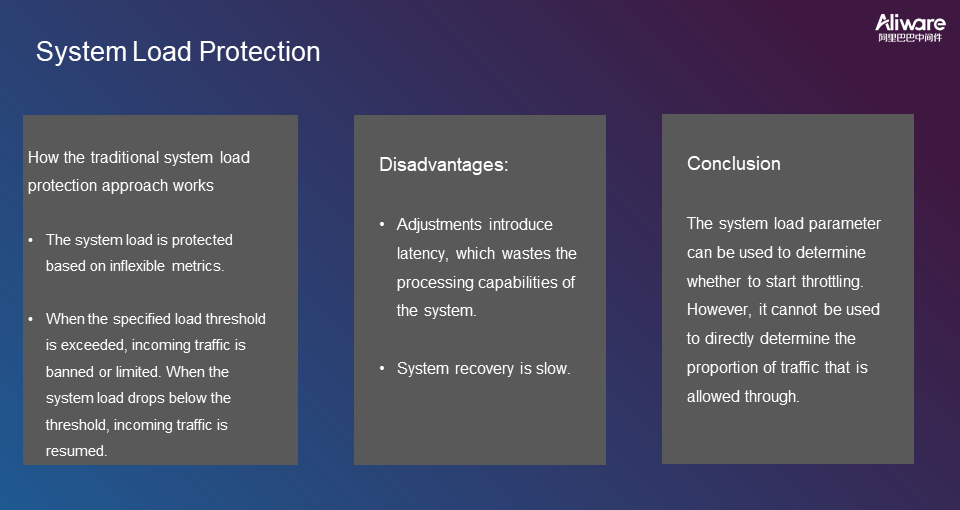
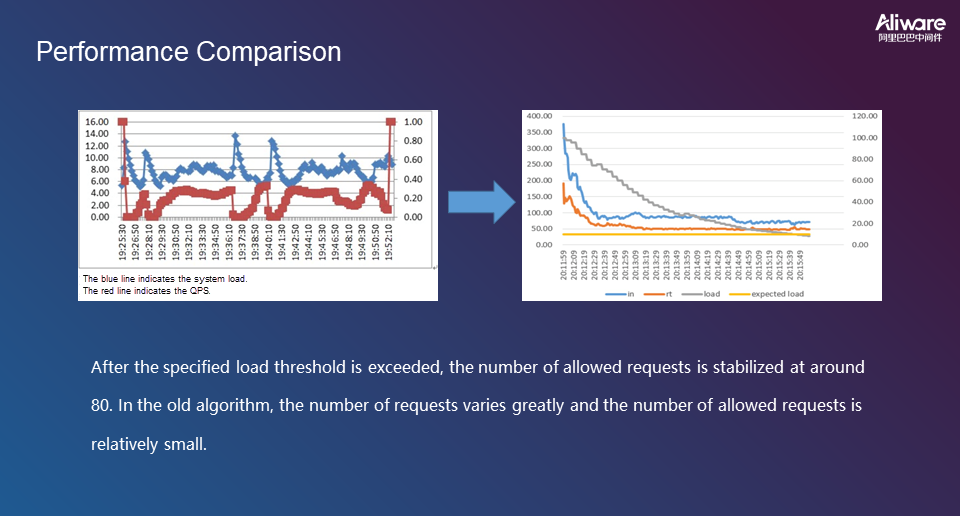
Traditional system load protection is implemented based on inflexible metrics. However, such metrics have latency and waste the processing capabilities of the system. This slows down system recovery and further delays adjustments.
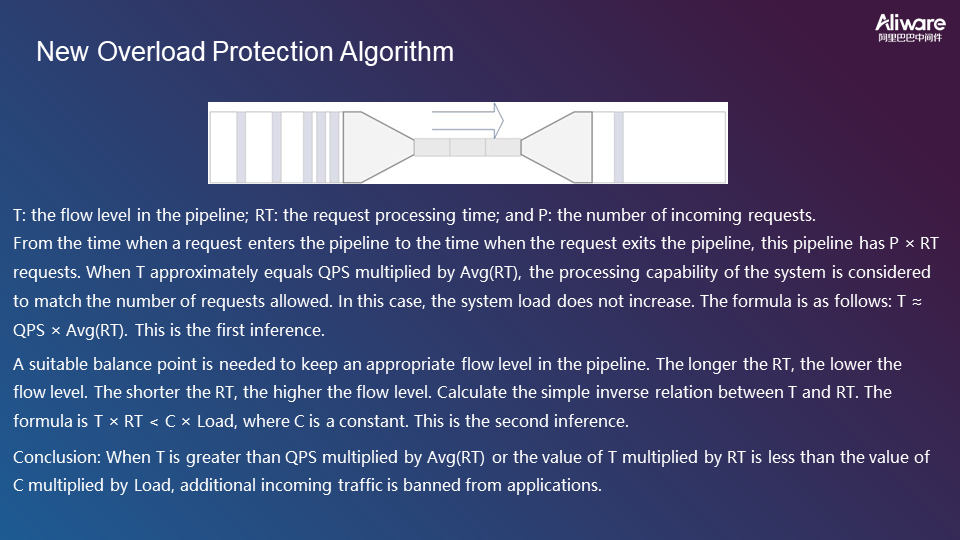
A new overload protection algorithm is developed to solve these problems, as shown in the following figure.
The following figure shows the algorithm verification results.
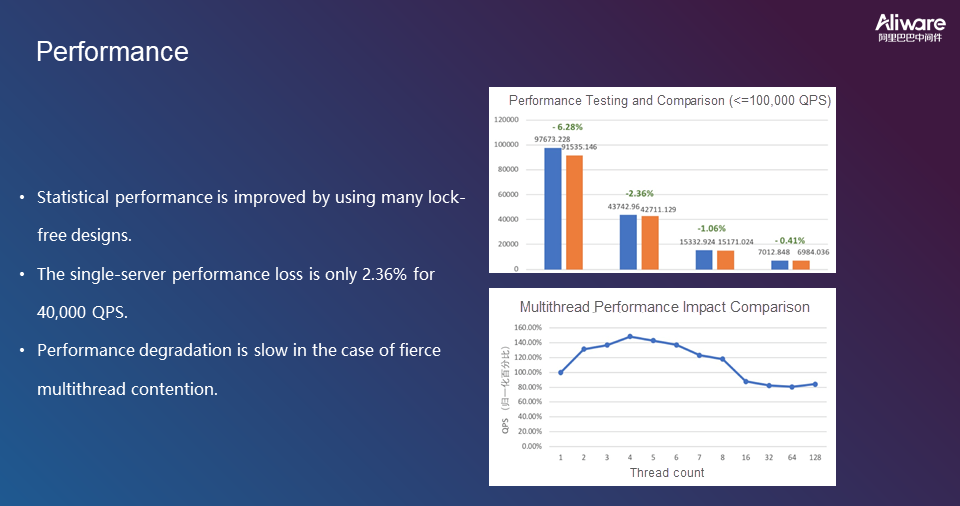
The following figure shows the performance statistics for the new overload protection algorithm.
Unveiling the Secrets Behind Alibaba's Full-scale Stress Testing for Double 11
Alibaba Clouder - December 3, 2020
Alibaba Clouder - May 18, 2021
5544031433091282 - October 8, 2023
Alibaba Cloud Community - June 14, 2024
Alibaba Cloud Native - June 7, 2024
Alibaba Cloud Native Community - November 20, 2023
 Function Compute
Alibaba Cloud Function Compute is a fully-managed event-driven compute service. It allows you to focus on writing and uploading code without the need to manage infrastructure such as servers.
Learn More Elastic High Performance Computing Solution
High Performance Computing (HPC) and AI technology helps scientific research institutions to perform viral gene sequencing, conduct new drug research and development, and shorten the research and development cycle.
Learn More Mobile Testing
Provides comprehensive quality assurance for the release of your apps.
Learn More Elastic High Performance Computing
A HPCaaS cloud platform providing an all-in-one high-performance public computing service
Learn MoreMore Posts by zcm_cathy