By Yizheng
Meteorological data is a typical type of big data that features large volume, high instantaneity, and wide variety. Meteorological data is mainly spatio-temporal data that holds observations and analog quantities for individual physical quantities within a time or space range. Data produced each day usually varies from tens of TB to hundreds of TB and is increasing explosively. Efficiently storing and querying meteorological data is becoming an increasingly difficult challenge.
Traditional solutions usually combine relational databases and file systems to store and query this type of meteorological data in real time. However, these solutions have some disadvantages in scalability, maintainability, and performance, which become more obvious as data size increases. In recent years, people both in the academic circle and the industry have begun to use distributed NoSQL storage as a solution for storing and querying a sea of meteorological data in real time. Compared with traditional solutions, distributed NoSQL storage can support larger data sizes, provide better query performance and significantly improve stability, manageability, and some other features.
It is also becoming an increasing trend to parse, store, query and analyze data using cloud computing resources. The cloud holds diversified products/services and elastic computing resources, which can support the implementation of the whole meteorological data processing workflow: use cloud distributed storage to store and query meteorological data in real time, utilize big data computing services to analyze and process meteorological data, and finally use various app services to set up meteorological platforms and apps.
Therefore, more and more meteorology researchers (as well as researchers in fields like oceanology and seismology) have begun to learn about cloud computing and distributed storage, and consider how to design storage and query solutions for massive amounts of meteorological data based on these services. This article is based on the experimental application of Alibaba Cloud Table Store (formerly called OTS) in meteorology and describes how to use Table Store to store and query meteorological data in real time.
This chapter explains the characteristics of meteorological data (mainly model data), several query methods, and the problems that we need to solve in order to store and query massive amounts of meteorological data.
A very important part of meteorological data is model data that forecasts numeric models. Model data is obtained after high-performance computers calculate specific physical formulas based on real-time observation data received from sensors (for example, sensors on the ground, in the air and in satellites). A large set of computing systems are needed to produce model data. Generally, meteorology agencies in developed countries have their own model systems.
Model systems perform calculation operations several times a day, and hundreds of physical quantities are generated each time to forecast data in a series of latitude-longitude grids at different altitudes within a certain time period (for example, within 240 hours). Each point on the grids represents a forecast value of a physical quantity at the location specified by a latitude and longitude at that altitude at a future point in time.
Model data is typically multidimensional data. For example, each time the model systems produce data, it includes the five following dimensions:
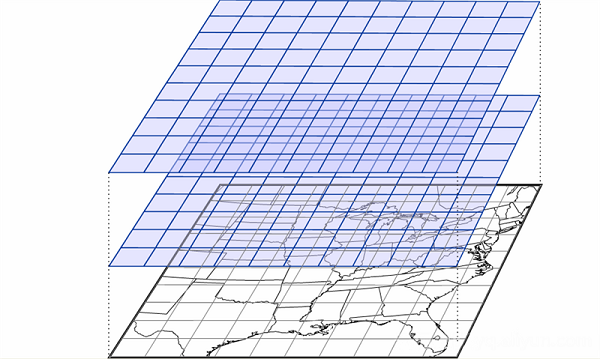
When an element and a forecast time range are specified, altitude, longitude and latitude will form a three-dimensional data grid, as shown in the following figure (The figure was obtained from Internet). Each point is a point in the three-dimensional space, and the value for a specific point is that point's forecast value of a physical quantity (for example, temperature) within a forecast time range (for example, next three hours).
Assume that a three-dimensional grid space consists of ten planes at different heights. Each plane consists of 2880 x 570 grid points, and each grid holds 4 bytes of data. Then the total data size is about 64 MB (2880 x 570 x 4 x 10). This is only one forecast of a physical quantity made by one model system within a specific time range. Based on this, it should be clear that the total size of model data is extremely large.
Forecasters browse through model data on a page and forecast numeric models accordingly. This page is required to provide multiple model data query methods. Here are some example query methods:
Query methods are not limited to the aforementioned types. This article mainly analyzes the first two typical query methods: query the grid point data at a longitude-latitude plane and query the time series for a specific grid point.
The first issue is storage. Multiple servers are required to store massive amounts of meteorological data. The challenge is to select or construct a distributed storage system that ensures data reliability, manageability, and system maintainability.
The second challenge involves queries. Forecasters need to quickly browse through a large volume of meteorological data to provide efficient and accurate weather forecasts. The latency of each query operation must therefore be very low (milliseconds). As mentioned above, data is distributed across multiple servers, so, to achieve millisecond-level latency, the following two requirements must be met:
Let us look at how traditional methods and the distributed NoSQL methods each address this issue.
Because multidimensional meteorological data is extensive, traditional storage uses file systems instead of databases. In a file system, each dimension is a directory. Directories are in a directory tree structure, with data files as the leaf nodes of the tree, as shown in the following diagram.
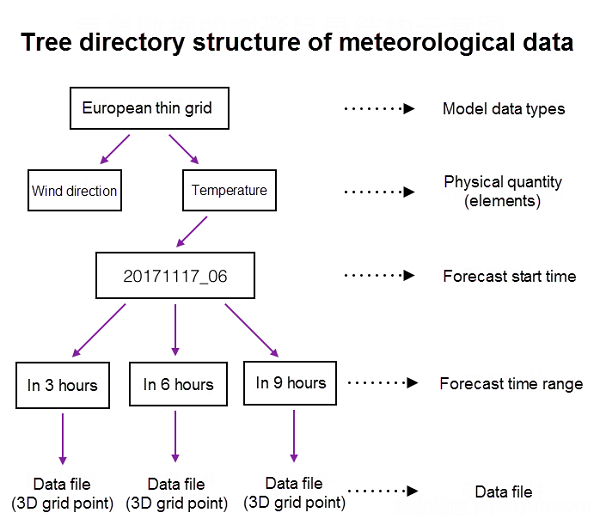
The preceding diagram is only one example. The relationship between data layers and directory structure design may vary in different storage scenarios. Research institutions adopt different directory structures. One consideration is data file size, that is, how much dimension info a data file should hold. If every file is small, the file system contains too many files, increasing the latency of locating specific files and the cost of maintaining the small files. If every file is large, the system must avoid reading entire files; otherwise, high latency may result.
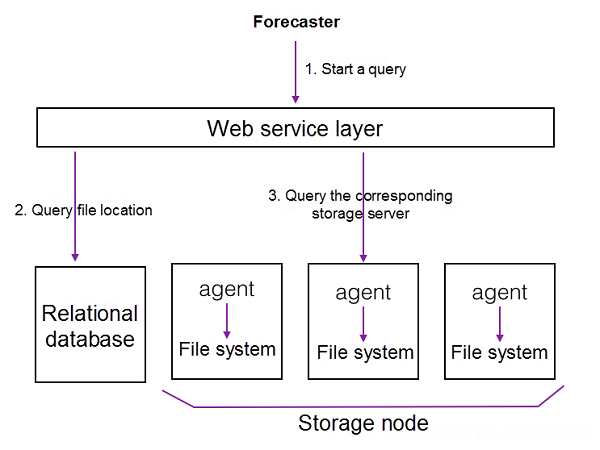
Now, let us see how this solution addresses storage and query issues, respectively. For storage, this solution requires manual intervention to divide the various data types among different servers to store the data in a distributed manner. The directory structure of each server is represented in the preceding diagram. To ensure that a specific data type always corresponds to a specific server, relational databases or configuration files are usually used to record data.
For data queries, this solution first obtains the server and file system path from relational databases containing the data files to be queried and then visits the agent on the corresponding server to run the query. The agent accesses the local file system, reads data files, and then filters and processes the data that the user needs. This agent is indispensable. Its role is to filter and process data locally to reduce network traffic.
Assume that we are going to obtain the time series data of a point at a specified altitude over the next 72 hours, with a forecast time range interval of 3 hours. We need 24 numeric values. The problem is that the 24 values may involve a very large (possibly hundreds of MB) data file due to excessive redundant data. We are not interested in other longitude-latitude grid points and data at other altitudes. When the local agent reads data, if the data is in a specific file format (for example, NetCDF), it must only read a portion of the file to optimize the process.
However, this solution has obvious disadvantages:
Alibaba Cloud Table Store is a distributed NoSQL service on the cloud that supports high-concurrency data read/write operations and PB-level data storage and provides the ability to read data in milliseconds. In the previous section, we analyzed traditional solutions and learned about storing and querying massive amounts of meteorological data. Now, let us look at how Table Store addresses these issues.
On the one hand, Table Store is a distributed NoSQL storage service. In Table Store, data is spread among various servers, and a single cluster can support 10 PB of data. This resolves the storage issue.
On the other hand, Table Store supports fast single-row query and range query, which means it is a large SortedMap from the data model perspective. Even if a table has tens of billions or even trillions of data rows, the speed at which a single row of data is located does not decrease. So, when a file system contains an excessive number of small files, the time it takes to locate target data is reduced.
From the query perspective, locating data more efficiently and accurately means less redundant data to be read and returned, meaning higher query efficiency. We can limit a row or column of data in Table Store to a proper granularity meeting the requirements of all query methods. It has been proven that this solution provides excellent performance. Now, let us see exactly how this storage solution is designed.
The following diagram shows the Datastore data model. Each row has an attribute column and a primary key that is used to uniquely identify a row of data.
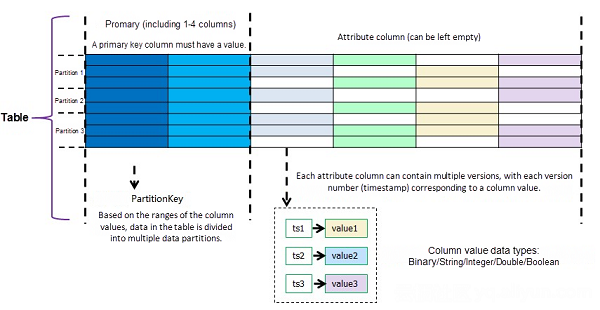
The following solutions mainly describe how to design primary keys and attribute columns, as well as how to implement the two typical query methods: query the grid point data at a longitude-latitude plane and query the time series for a specific grid point.
We temporarily use the following formula to represent a specific model data type (Data) in meteorology:
Data = F (physical quantity, forecast start time, altitude, forecast time range, longitude, latitude)
We can use the first four dimensions as the PrimaryKey (PK) and the last two dimensions as the attribute column. These dimensions are expressed as follows:
Row (physical quantity, forecast start time, altitude, forecast time range) = F (longitude, latitude)
PK = (physical quantity, forecast start time, altitude, forecast time range)
Data = F (longitude, latitude) = two-dimensional longitude and latitude grid data (we store it in the attribute column in binary format)
Meta = auxiliary information, for example, whether the data is compressed.
This is the final result: Row(PK) = (Data, Meta, Other attribute columns), Table = SortedMap(Rows), as shown in the following figure.
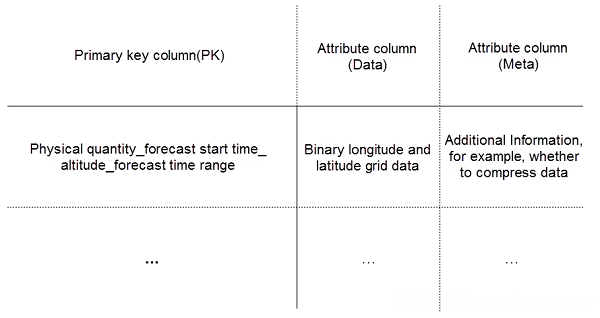
At this point, to query the grid point data at a longitude-latitude plane, it just needs to combine physical quantity, forecast start time, altitude, and forecast time range as the PK and then read a row of data via the GetRow interface in Table Store. To get data for multiple longitude-latitude planes, we can use the BatchGetRow interface to read multiple rows of data. After data is read, the client must resolve the binary data stored in the attribute column. Because the compression ratio for meteorological data is relatively high, data compression is recommended when using this solution.
For this solution, it is important to consider in the design the granularity for data saved to each row. In this example, each row stores only the data for a longitude-latitude plane. Consider 2880 x 570 of float data. The total size is 2880 x 570 x 4 = 6.3 MB (smaller if compressed). This granularity is suitable for both storage and query, and most of the query requests in meteorology only need to read one plane.
However, this solution has one disadvantage: To query the grid point data at a longitude-latitude plane, all data for a longitude-latitude grid point must be read first, before the requested grid point can be found. Because too much redundant data is obtained, this solution cannot provide high query performance in this scenario. To avoid this problem, we put forward solution 2.
To meet the requirements for querying the time series for a specific grid point, we consider further splitting data to reduce the data granularity and redundancy that is queried and returned. To reduce data granularity, we further divide a longitude-latitude plane in a row into 100 squares and save them to 100 attribute columns. The following figure shows an example of splitting. We divide a 481 x 641 plane into many 49 x 65 squares. Data in each square is saved to a column called Data_x_y, where (x,y) are the coordinates of the upper-left square corner.
At this point, Row(PK) = (Data_x1_y1, Data_x2_y2, Data_x3_y3, ... , Meta)
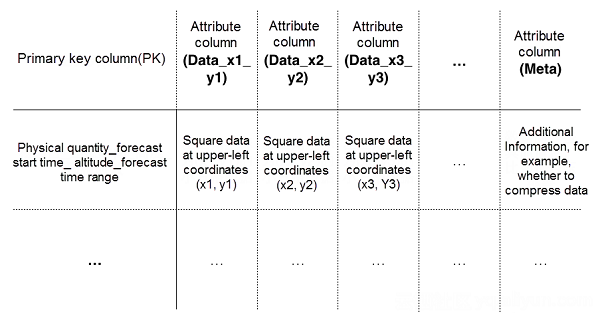
The following is the splitting diagram:
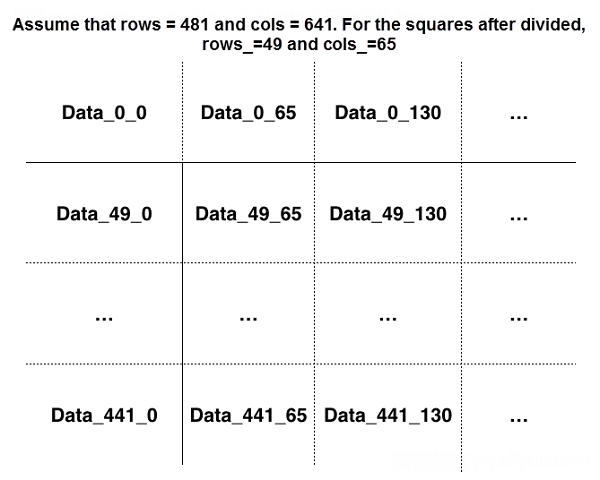
To query the time series for a specific grid point using this solution, we first need to calculate the attribute column of that point using the spitting formula, set it to read only that attribute column, and batch read data within different forecast time ranges using the BatchGetRow interface. This allows us to obtain and filter the time series data for that grid point. Compared with solution 1, the data to be read here is 100 times smaller, so the query performance is significantly improved.
Assume that we are going to read data in an area instead of a grid point. We can first calculate which squares are involved in that area and only read data in relevant squares. This can also reduce the amount of redundant data to read.
If the entire plane must be read, both solutions 1 and 2 can be applied to this scenario. The advantage of solution 1 is that data can be combined to achieve a better compression ratio. After assessing the options, you can determine whether to combine both solutions or use just one as needed.
The following diagram shows the new query process when Table Store is used.
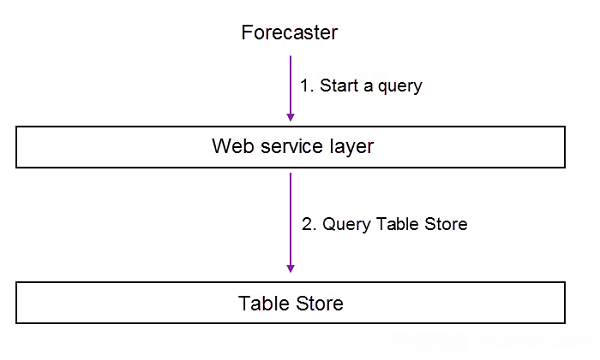
Now, let us summarize the advantages of this solution:
The potential drawback of Table Store solutions is that meteorological system development engineers must be thoroughly familiar with the distributed NoSQL system. Specifically, complex development efforts are needed to split data for the implementation of solution 2.
This article describes the traditional solutions and the Table Store solutions for storing and querying massive amounts of meteorological model data and compares the advantages and disadvantages of the solutions. The growing trend is to use distributed systems and cloud computing services to resolve big data issues across a variety of industries. This article describes only early solutions. In the future, more advanced industrial solutions will be implemented on the cloud.

57 posts | 12 followers
FollowAlibaba Clouder - September 27, 2019
Alibaba Clouder - February 4, 2017
Alibaba Cloud Storage - February 27, 2020
Alibaba Clouder - February 22, 2021
afzaalvirgoboy - February 25, 2020
Alibaba Clouder - March 18, 2019

57 posts | 12 followers
Follow ApsaraDB for HBase
ApsaraDB for HBase is a NoSQL database engine that is highly optimized and 100% compatible with the community edition of HBase.
Learn More Big Data Consulting for Data Technology Solution
Alibaba Cloud provides big data consulting services to help enterprises leverage advanced data technology.
Learn More MaxCompute
Conduct large-scale data warehousing with MaxCompute
Learn More Big Data Consulting Services for Retail Solution
Alibaba Cloud experts provide retailers with a lightweight and customized big data consulting service to help you assess your big data maturity and plan your big data journey.
Learn MoreMore Posts by Alibaba Cloud Storage