By Ding Yi, nicknamed Sanhua at Alibaba.
The value of technical communication is not only reflected in the way that applications are developed through commercial products and open-source projects and the way that various business launch processes are accelerated. But, its value is very much also reflected in the experience shared by several different outstanding engineers in improving productivity, optimizing product performance, and promoting the user experience. In a sentence, technical communication is important because it improves our professional capabilities.
In this article, an Alibaba technical expert Ding Yi will share his ideas and experience in creating effective architectural diagrams.
To describe our system in one or more diagrams, we often encounter the following issues:
If you have run into the same problems, this article introduces a drawing methodology to produce clear architectural diagrams.
Welcome to Alibaba Cloud Knowledge Base! Here you can find interesting content to help you learn more about the technologies you are most interested in.
An "architecture" can be defined as an abstract description of entities in a system and the relationships between them. It involves a series of decision-making processes.
The architecture is a structure and a vision.
A "system architecture" is the embodiment of concepts and the distribution of the correspondences between the functions of things or information and formal elements. It defines the relationships among elements as well as between elements and the surrounding environment.
Building a sound architecture is a complex task and a great topic for us to discuss here. After you build an architecture, relevant parties must understand it and follow its dictates.
An architectural diagram is a diagram of a system that is used to abstract the overall outline of the software system and the relationships, constraints, and boundaries between components. It is an important tool as it provides an overall view of the physical deployment of the software system and its evolution roadmap.
A diagram much like a picture is worth a thousand words. In other words, an architectural diagram must serve several different functions. To allow relevant users to understand a system architecture and follow it in their decision-making, we need to communicate information about the architecture. Architectural diagrams provide a great way to do this. To put down some major functions, an architectural diagram needs to:
Diagrams can be classified into many categories. One popular type of diagram is the 4+1 view, which includes the scenario, logical, physical, process, and development views of the architecture.
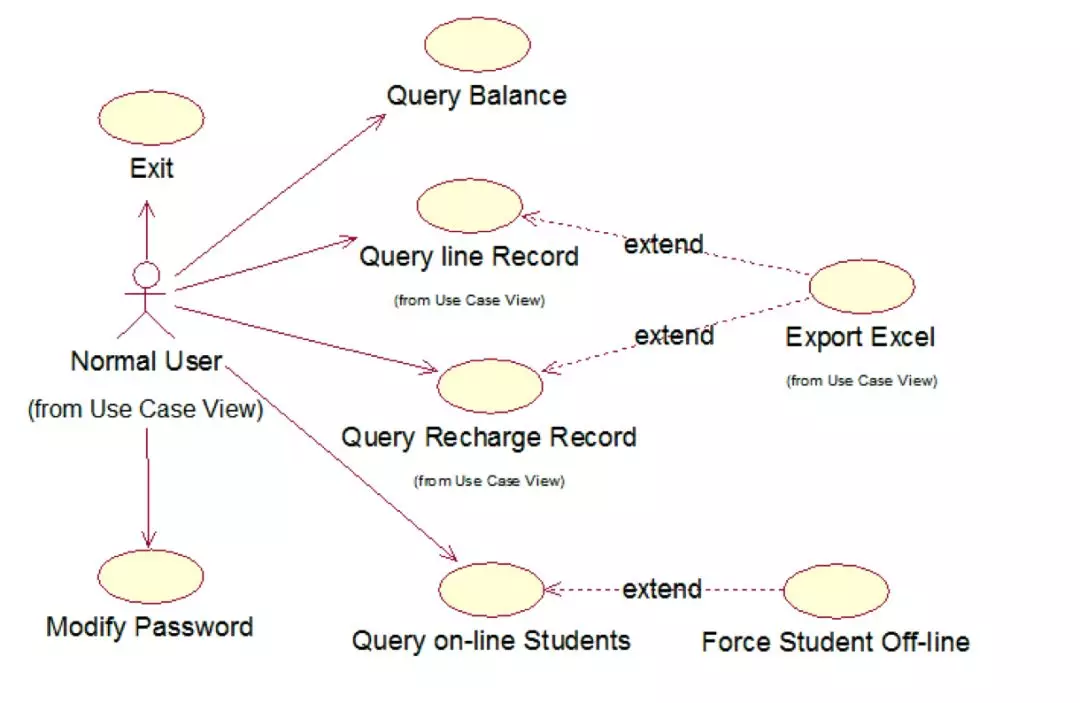
The scenario view describes the relationships between system participants and functional use cases and reflects the final requirements and interaction design of the system. This view is generally a use case diagram.
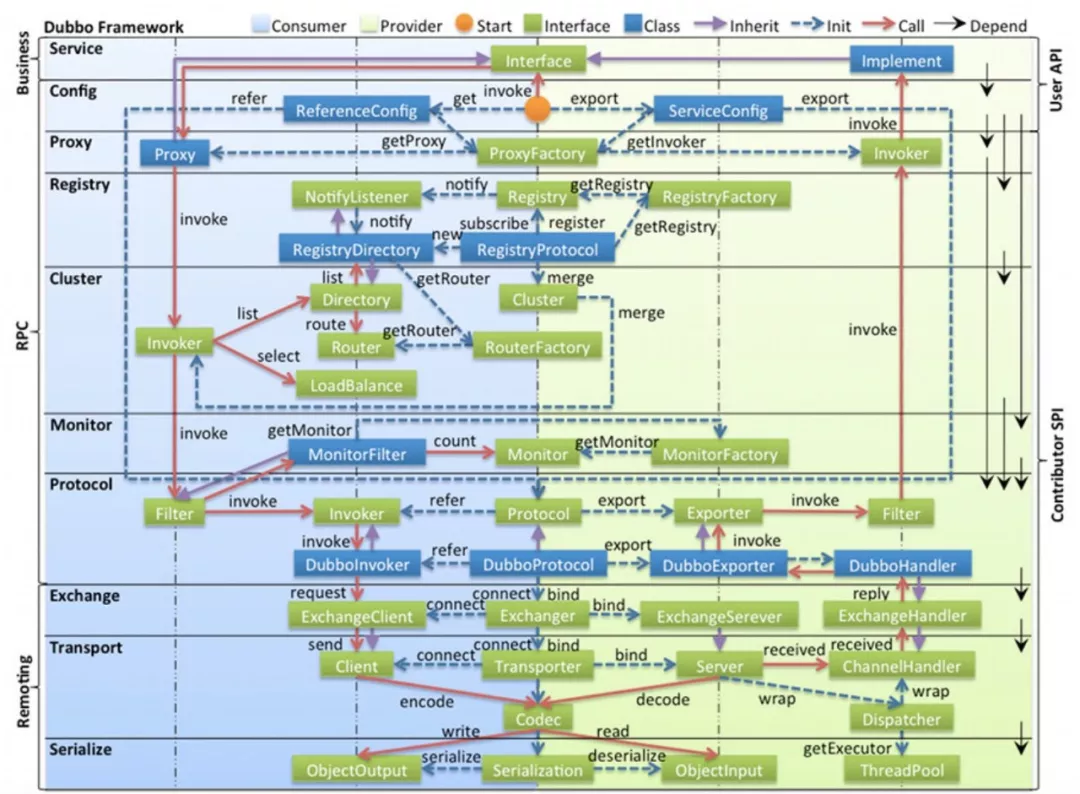
The logical view is used to describe the component relationships, component constraints, and boundaries after the breakdown of system software functions. It reflects the overall system composition and how the system is built. This view is generally a UML component diagram or class diagram.
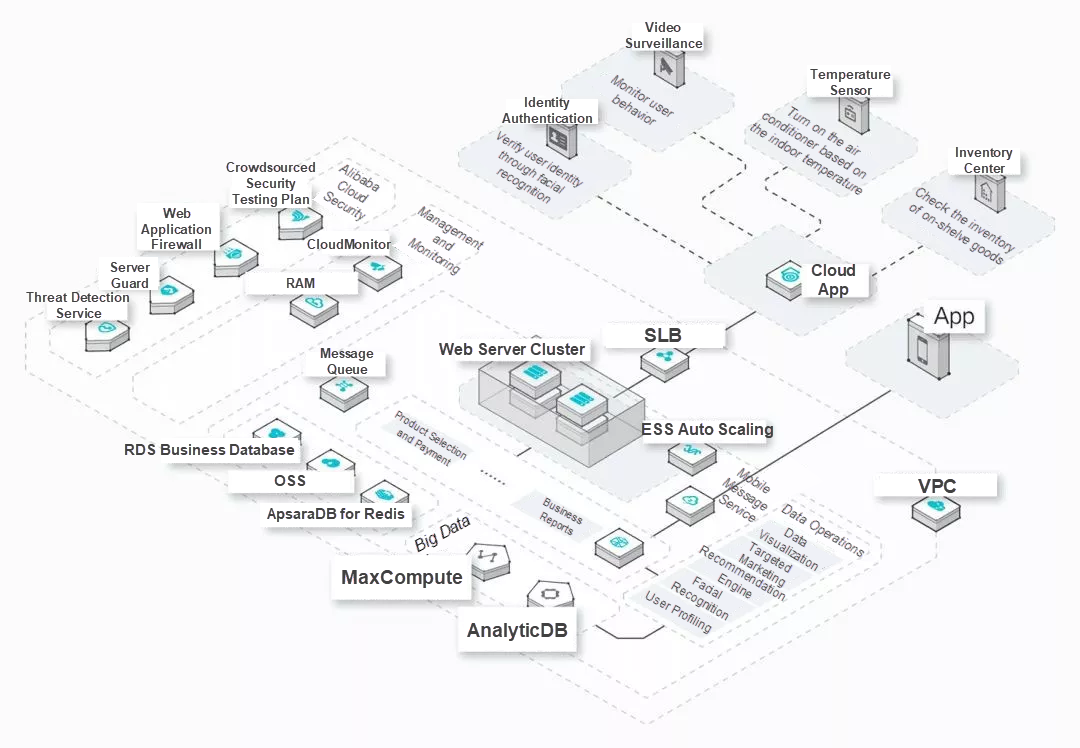
The physical view describes the mapping between system software and physical hardware and shows how system components are deployed to a group of computable physical nodes. It provides guidance in the software system deployment process.
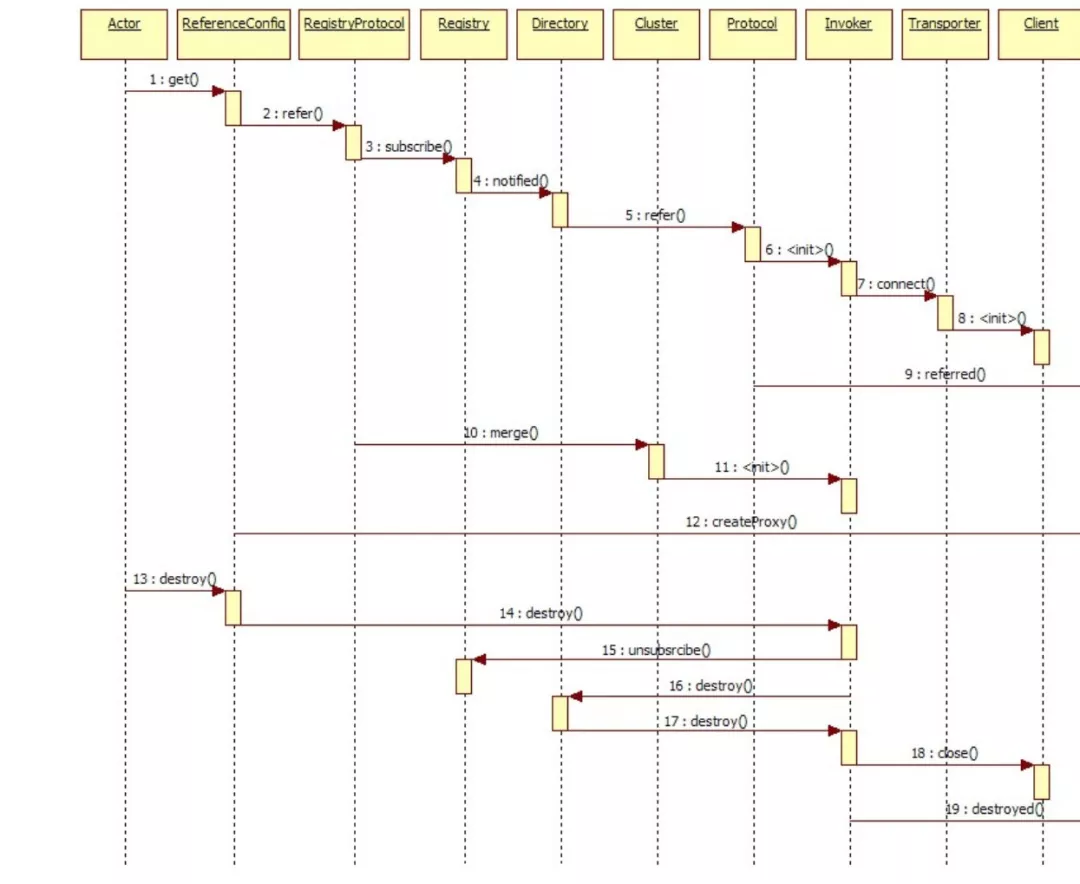
The process view describes the communication sequence and data input and output between system software components and reflects the functional and data flows of the system. This view is normally presented as a sequence diagram or flowchart.
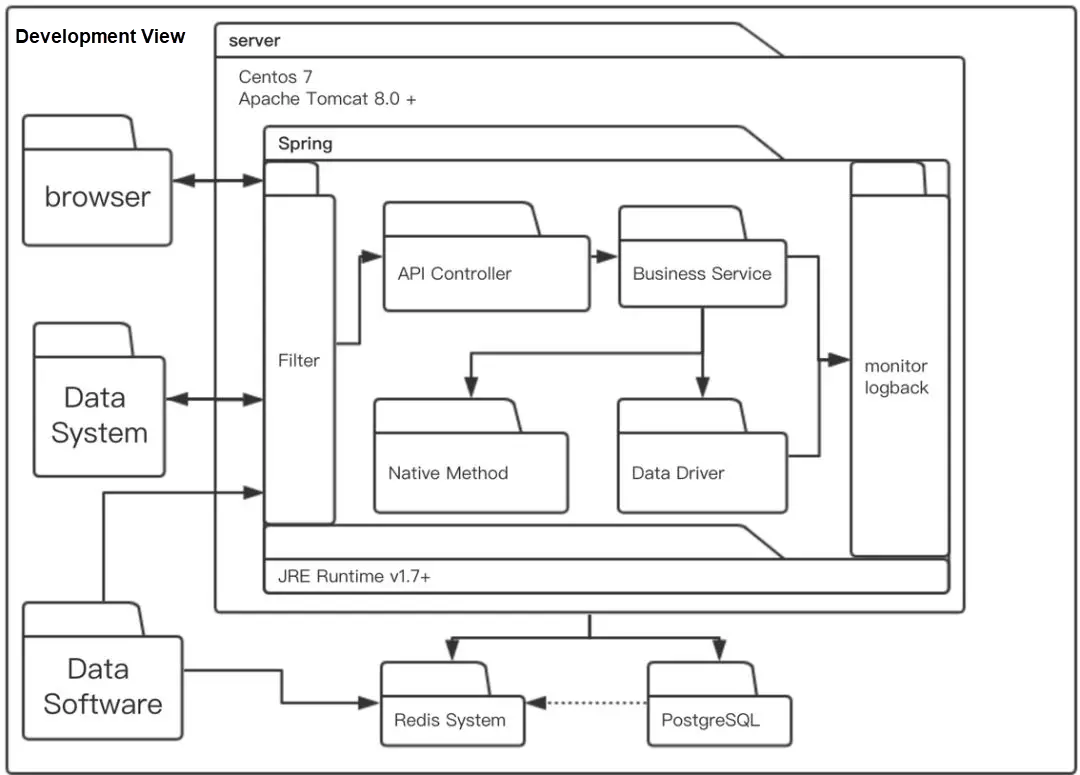
The development view is used to describe the division and composition of system modules and refine the compositional design of internal packages. This view is used by developers and reflects the system development and implementation processes.
The five above architectural views represent different characteristics of a software system from different perspectives. By combining them in an architectural blueprint, we can then describe the overall system architecture very clearly.
How can we know if a diagram is a good diagram? And what methods should we use to create a diagrams?
The above diagrams were selected to illustrate the different types of diagrams, with little thought to their quality. We believe that, to depict a good architectural diagram, we must know who our audience is and consider what information we want to convey. Therefore, we should not depict a physical view or logical view for its own sake. Diagrams should be used to accurately convey the information required by a certain audience to be effective. Only then, should we worry about what type of diagram it is. Therefore, the most direct standard by which we can judge the quality of a drawing is whether the audience can accurately understand the information we tried to convey.
This means that a good and effective architectural diagram does not need to be explained to the audience. It should express everything you want to say all by itself. Moreover, a good diagram should also have a consistent structure, accurate to the data it's representing, and correspond to the code directly.

Why do we use squares instead of circles? The random use of squares or other shapes may cause confusion.

The arbitrary use of lines or arrows may lead to misunderstandings.

Building an architecture is a complex job. Therefore, using only one diagram to represent the architecture can easily lead to confusion on specific aspects about the architecture.
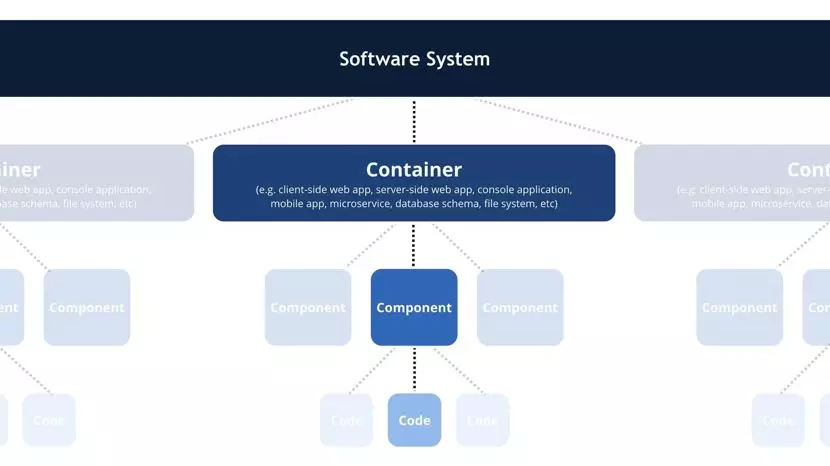
The C4 model uses containers, such as applications, data stores, and microservices, as well as components and code to describe the static structure of a software system. These diagrams are easy to draw, and their key elements are explicit. However, the most important thing is that they can clearly indicate the intended audience and significance of each diagram.
The following example is from the official C4 website. On this basis, we manage to use our own understanding to better express the software architecture.
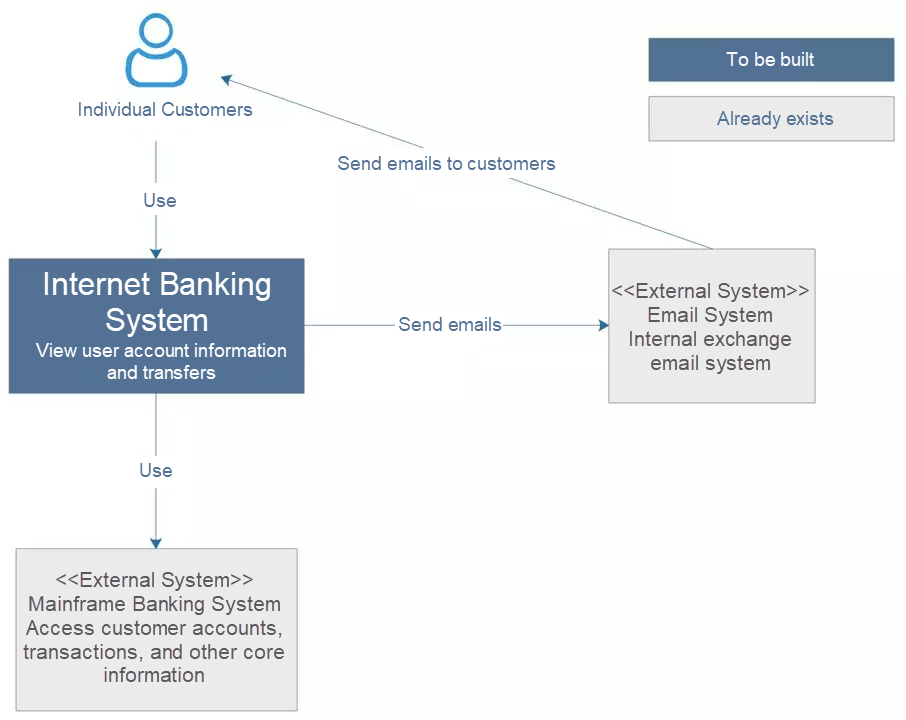
This is a diagram of a planned banking system. It uses an external mainframe banking system to access customer accounts and transaction information and sends emails to customers through an external email system. As you can see, the diagram is simple and clear. It does not require any additional explanation for the audience to understand it. We can also see that it contains the system to be built, the customers of the system, and the peripheral systems that interact with this system.
Such a simple diagram can tell which type of system is to be built, who its users are, who will manipulate it, and how it will be integrated into an existing IT environment. The audience of this diagram can be the development team's internal staff, external technical staff, or non-technical staff. It tells us:
In this diagram, your own system is in the middle, and users and systems that interact with this system are placed around it. The key aspect of this diagram is that it organizes and clearly shows the users and high-level dependencies of the system to be built. After the conceptual work is done, it only takes a few minutes to depict the diagram.
The container diagram expands the system in the previous system context diagram.
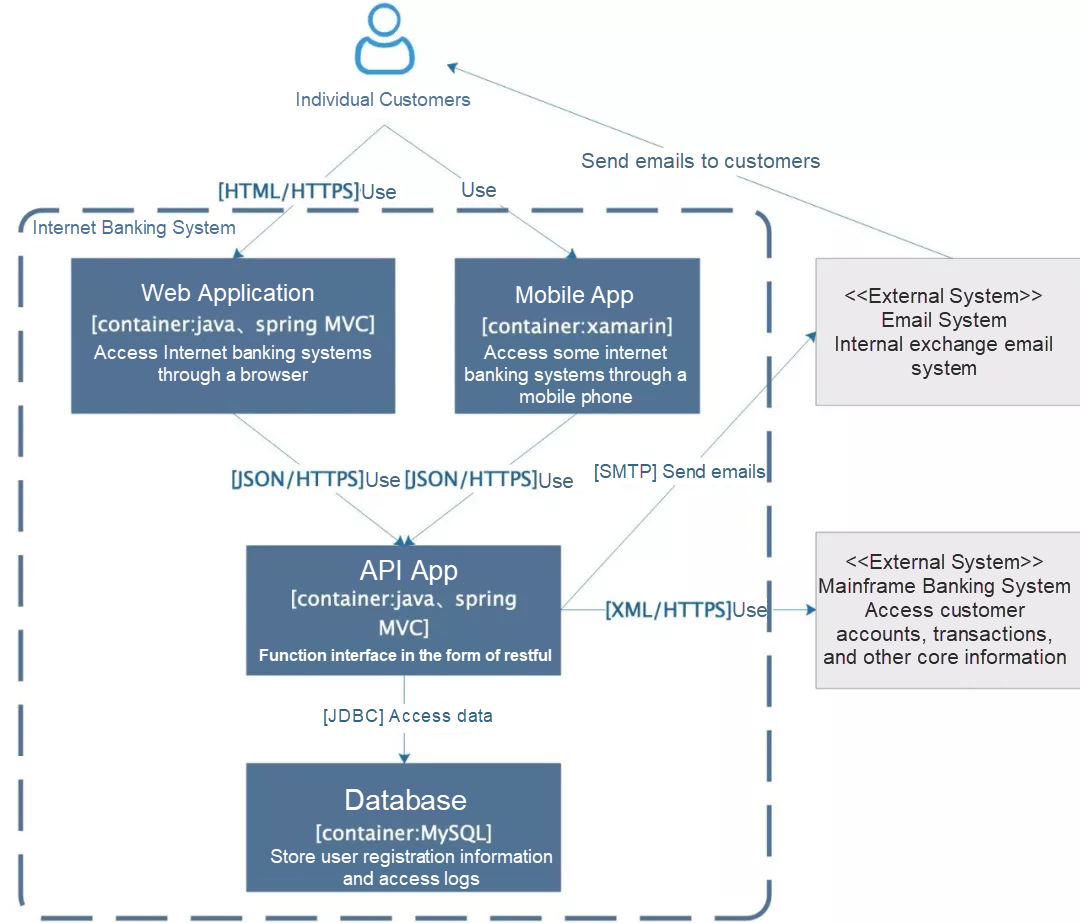
In the preceding figure, in addition to users and peripheral systems, the system to be built includes a web application based on Java Spring MVC to provide a function portal for the system, while a mobile app based on Xamarin provides a function portal for mobile clients. A Java-based API application provides services, and a MySQL database is used for storage. Arrows indicate interactions between applications.
When you look at this diagram, you will not notice whether the boxes have sharp or rounded corners or whether the arrows have solid or dotted lines. Even the directions of the arrows do not attract much attention.
There are many drawing methods, all of which define the meanings of frames and lines. This requires both the drafter and viewer of the diagram to clearly understand these definitions. Only then can all the information in the diagram be understood. However, this is demanding, and many viewers will only catch the general concepts.
The audience of this diagram can be internal or external developers or O&M personnel. This diagram serves the following purposes:
This diagram uses frames, which may include names, technical choices, responsibilities, and interactions between frames. If an external system is involved, it is best to define the boundary.
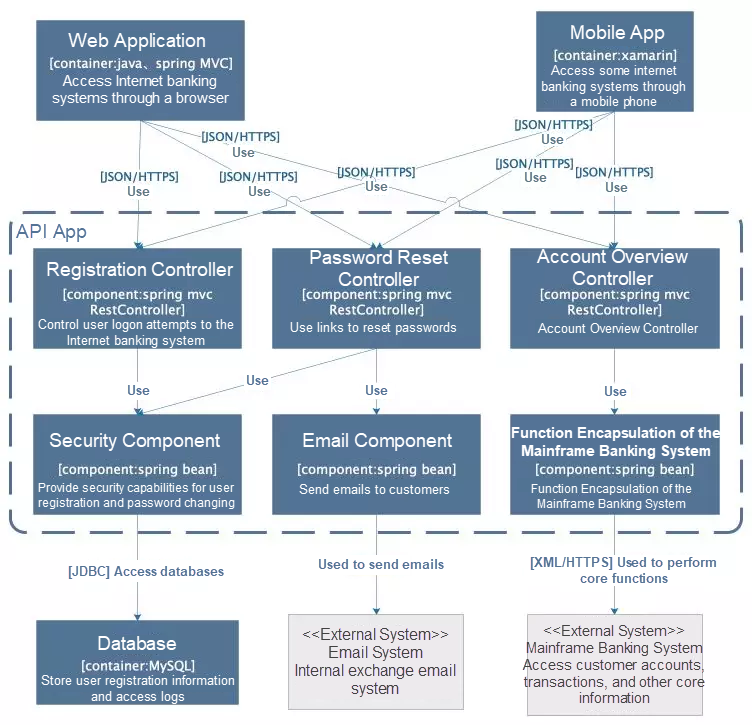
A component diagram is used to expand a container and describe its internal modules.
This diagram is intended for internal developers and shows them how to organize and develop code. This diagram serves the following purposes:
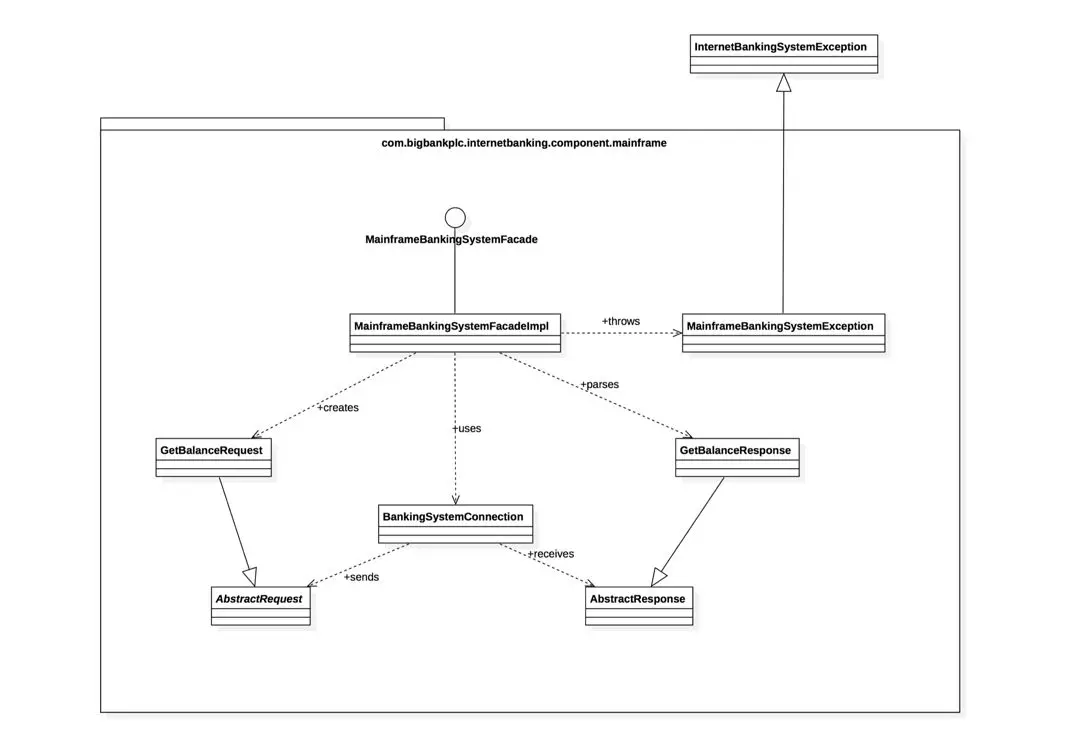
This diagram is intended for the technical support staff. It is a common type of diagram, and therefore we will not describe it in detail.
The following figure shows the architecture of an internal real-time data tool. As an architectural diagram should be self-evident, there is not much need for explanation. If you cannot clearly understand it, the diagram is definitely not good enough.
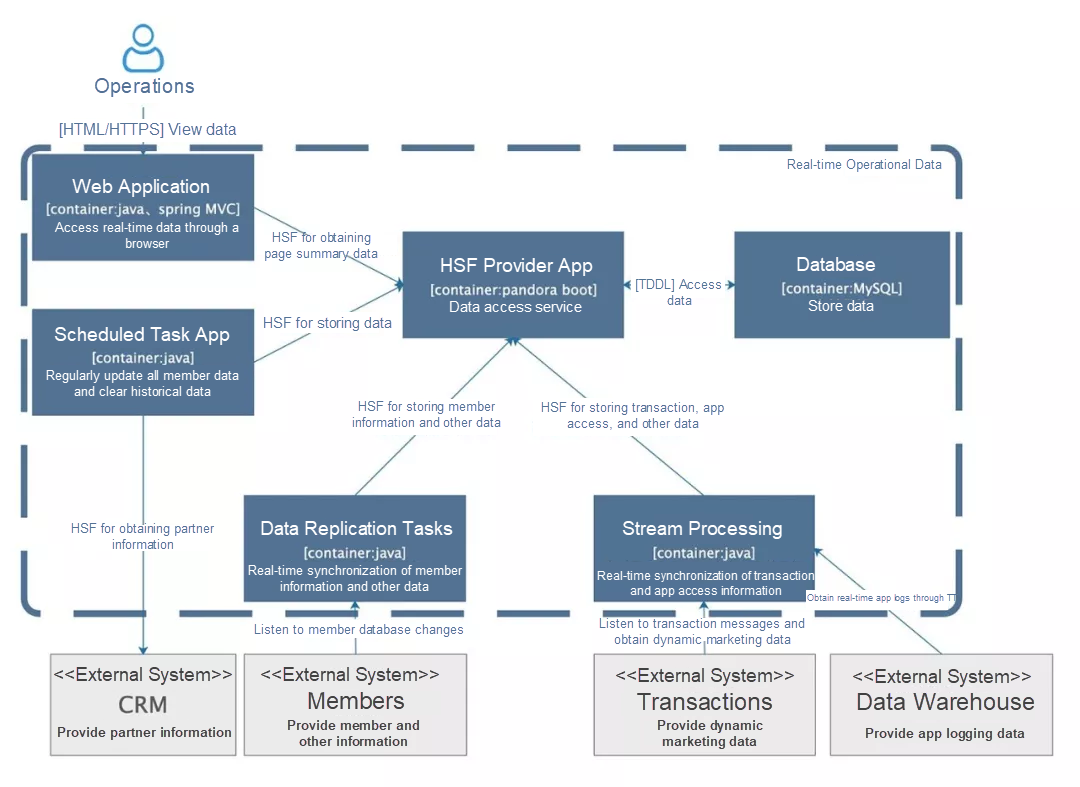
There are many methodologies for depicting a good architectural diagram. This article introduces the C4 method, which however is also constantly evolving. Despite of this, regardless of the drawing methodology, we simply need to consider the intention of the drawing and better communicate it with the audience. We do not have to be unduly restricted by rules in the drawing process. In short, before starting a diagram, ask yourself: Who is it for, what is it of, and how to make it intuitive and understandable.
About the author: Sanhua is a technical expert at Alibaba. Zijing, Pengsheng, and Yule also contributed to this article. Ding Yi previously worked in workflow engine R&D for many years, but he is now focusing on the architecture and development of high-concurrency mobile Internet applications. The contributors to this article are from the Alibaba LST Department.
Are you eager to know the latest tech trends in Alibaba Cloud? Hear it from our top experts in our newly launched series, Tech Show!
Running Microsoft Exchange Server with Alibaba Cloud ECS
This article covers setting up Exchange Server 2019 on Windows Server 2019 Datacenter edition image using an Alibaba Cloud ECS Instance.
Red Dragonfly Success Story: Doing Business in the Era of Digitization and Intelligentization

2,593 posts | 792 followers
FollowAlibaba Clouder - January 19, 2021
Alibaba Clouder - March 25, 2019
Alibaba Cloud Community - September 13, 2021
Alibaba Clouder - June 15, 2020
Alibaba Cloud Native Community - March 8, 2021
Data Geek - November 11, 2024

2,593 posts | 792 followers
Follow Tair (Redis® OSS-Compatible)
A key value database service that offers in-memory caching and high-speed access to applications hosted on the cloud
Learn More DataWorks
A secure environment for offline data development, with powerful Open APIs, to create an ecosystem for redevelopment.
Learn More DataV
DataV
A powerful and accessible data visualization tool
Learn More MaxCompute
Conduct large-scale data warehousing with MaxCompute
Learn MoreMore Posts by Alibaba Clouder
5492827963089938 August 3, 2021 at 4:00 am
Thank you for sharing, Sanhua. Helpful and easy to understand for a beginner like me. Clear, concise and comprehensive. Please keep up the excellent work!