By Liu Xiaoguo, an Elastic Community Evangelist in China and edited by Lettie and Dayu
Released by ELK Geek
RabbitMQ is a message queuing software, also known as a message broker or queue manager. Once it defines a queue, applications connect to the queue to transmit one or more messages.
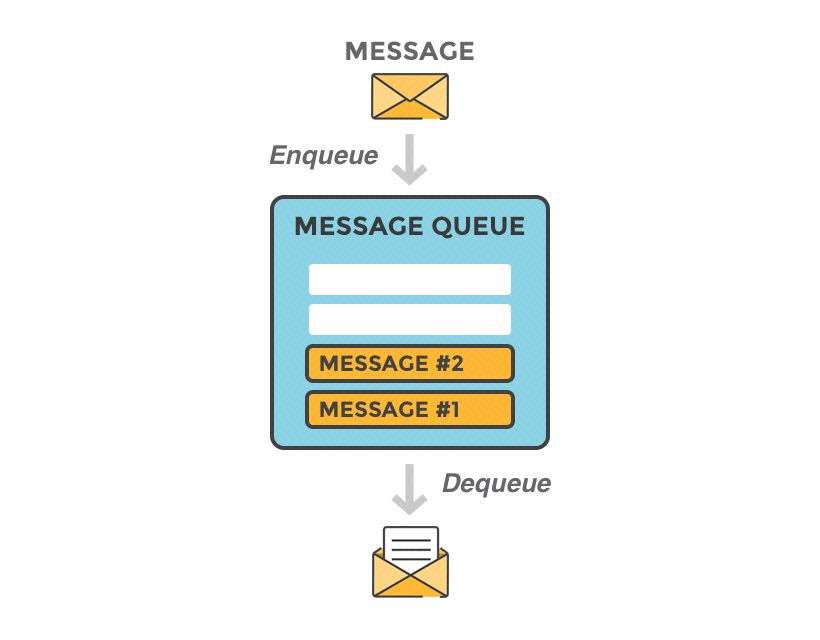
A message may contain any type of information. For example, it may have information about a process or task that should be started on another application, server, or a simple text message. The queue manager stores a message until an application connects to the queue manager and pulls the message from the queue. The application then processes the message.

A message queue simply contains 'client applications' that are defined as producers and applications that are called consumers. Producers create messages and transmit them to the proxy, that is, the message queue. Consumers connect to the queue to subscribe to messages that they need to process. Applications function as a message producer as well as a consumer or both. Messages are stored in the queue until consumers retrieve them.
Starting from RabbitMQ 3.7.0 released on November 29, 2017, RabbitMQ data was recorded to one log file. In the versions earlier than RabbitMQ 3.7.0, RabbitMQ has two log files. In this article, I have used RabbitMQ 3.8.2 as an example. Therefore, only one log file will be sent to Elasticsearch. If you are using a RabbitMQ version earlier than 3.7.0, see the relevant documentation for more information on how to obtain the two different log files.
In RabbitMQ 3.8.2, specify the position in Rabbitmq.conf where the RabbitMQ log file is stored. I will display the file during the RabbitMQ installation.
This article describes how to use Alibaba Cloud Beats to import specified RabbitMQ logs to the Alibaba Cloud Elastic Stack for visual analysis. Ensure that the following requirements are available before proceeding.
1) Prepare the Alibaba Cloud Elasticsearch 6.7 environment and use the created account and password to log on to Kibana.
2) Prepare the Alibaba Cloud Logstash 6.7 environment.
3) Prepare the RabbitMQ service.
4) Install Filebeat.
Install RabbitMQ in the Alibaba Cloud ECS environment. I will not give a detailed description of the installation process here. After installation, the RabbitMQ service will be started and enabled. To check the RabbitMQ status, run the following commands:
# cd /usr/lib/rabbitmq/bin
# rabbitmq-server startAfter RabbitMQ is installed, switch to /etc/rabbitmq/rabbitmq.config and configure the log level and file name. The default log level is "info". You may also set it to "error", to indicate error logs.
# vim /etc/rabbitmq/rabbitmq.config
{lager, [
  %%
  %% Log directory, taken from the RABBITMQ_LOG_BASE env variable by default.
  %% {log_root, "/var/log/rabbitmq"},
  %%
  %% All log messages go to the default "sink" configured with
  %% the `handlers` parameter. By default, it has a single
  %% lager_file_backend handler writing messages to "$nodename.log"
  %% (ie. the value of $RABBIT_LOGS).
   {handlers, [
     {lager_file_backend, [{file, "rabbit.log"},
                           {level, info},
                           {date, ""},
                           {size, 0}]}
  ]},
{extra_sinks, [

     {rabbit_channel_lager_event, [{handlers, [
                                     {lager_forwarder_backend,
                                      [lager_event, info]}]}]},
     {rabbit_conection_lager_event, [{handlers, [
                                       {lager_forwarder_backend,
                                        [lager_event, error]}]}]}

  ]}
After we set the configuration, the log file name is changed to "rabbit.log" and the log level is set to "info". To apply the modified configuration file, run the following command to restart rabbitmq-server:
##### Switch to the bin directory to start RabbitMQ because RabbitMQ is installed
by using the RPM package. ###
# cd /usr/lib/rabbitmq/bin
# rabbitmq-server start
View the output rabbit.log in the /var/log/rabbitmq directory.
To use the preceding RabbitMQ settings, I will use the RabbitMQ JMS client to demonstrate how to use Filebeat to send rabbit logs collected by the client to Logstash. To compile applications, install the Java 8 environment. The following figure shows the installation procedure.
# git clone https://github.com/rabbitmq/rabbitmq-jms-client-spring-boot-trader-demo
#### Switch to the root directory where the application is located. ######
# mvn clean package
# java -jar target/rabbit-jms-boot-demo-1.2.0-SNAPSHOT.jar
 .   ____          _            __ _ _
 /\\ / ___'_ __ _ _(_)_ __  __ _ \ \ \ \
( ( )\___ | '_ | '_| | '_ \/ _` | \ \ \ \
 \\/  ___)| |_)| | | | | || (_| |  ) ) ) )
  '  |____| .__|_| |_|_| |_\__, | / / / /
 =========|_|==============|___/=/_/_/_/
 :: Spring Boot ::        (v1.5.8.RELEASE)
2020-05-11 10:16:46.089  INFO 28119 --- [           main] com.rabbitmq.jms.sample.StockQuoter      : Starting StockQuoter v1.2.0-SNAPSHOT on zl-test001 with PID 28119 (/root/rabbitmq-jms-client-spring-boot-trader-demo/target/rabbit-jms-boot-demo-1.2.0-SNAPSHOT.jar started by root in /root/rabbitmq-jms-client-spring-boot-trader-demo)
2020-05-11 10:16:46.092  INFO 28119 --- [           main] com.rabbitmq.jms.sample.StockQuoter      : No active profile set, falling back to default profiles: default
2020-05-11 10:16:46.216  INFO 28119 --- [           main] s.c.a.AnnotationConfigApplicationContext : Refreshing org.springframework.context.annotation.AnnotationConfigApplicationContext@1de0aca6: startup date [Mon May 11 10:16:46 CST 2020]; root of context hierarchy
2020-05-11 10:16:47.224  INFO 28119 --- [           main] com.rabbitmq.jms.sample.StockConsumer    : connectionFactory => RMQConnectionFactory{user='guest', password=xxxxxxxx, host='localhost', port=5672, virtualHost='/', queueBrowserReadMax=0}
2020-05-11 10:16:48.054  INFO 28119 --- [           main] o.s.j.e.a.AnnotationMBeanExporter        : Registering beans for JMX exposure on startup
2020-05-11 10:16:48.062  INFO 28119 --- [           main] o.s.c.support.DefaultLifecycleProcessor  : Starting beans in phase 0
 ......
### After the preceding configuration, enter the log directory to view RabbitMQ logs.
# pwd
/var/log/rabbitmq
erl_crash.dump  rabbit.log              rabbit@zl-test001.log              rabbit@zl-test001_upgrade.log
log
rabbit.log is the file name that we configured previously.
The following sections describe how to use Alibaba Cloud Filebeat and Logstash to import these logs to Alibaba Cloud Elasticsearch.
1) Create a Filebeat collector in the Alibaba Cloud Beats data collection center.
2) Specify the collector name, installation version, output, and YAML configuration.
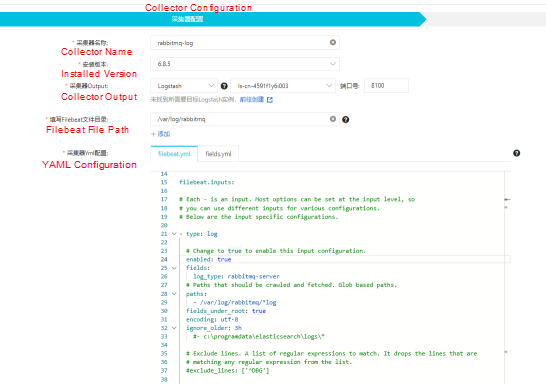
The following snapshot shows the Filebeat.input configuration.
filebeat.inputs:
# Each - is an input. Most options can be set at the input level, so
# you can use different inputs for various configurations.
# Below are the input specific configurations.
- type: log
  # Change to true to enable this input configuration.
  enabled: true
  fields:
    log_type: rabbitmq-server
  # Paths that should be crawled and fetched. Glob based paths.
  paths:
    - /var/log/rabbitmq/*log
  fields_under_root: true
  encoding: utf-8
  ignore_older: 3h
3) Select an ECS instance in the same VPC as Logstash and start the ECS instance.
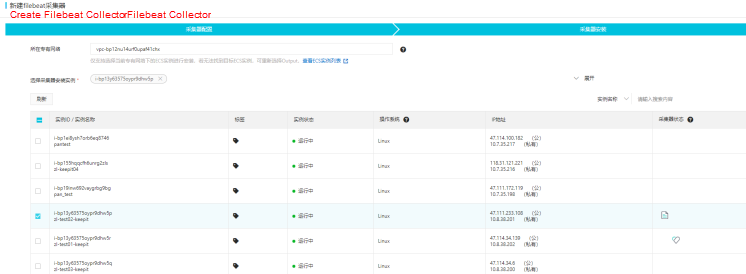
After the collector takes effect, start the Filebeat service.

The configured Beat collector sends RabbitMQ logs to port 8100 on Logstash. Then, use the basic Grok mode to configure Logstash to retrieve the timestamp, log level, and a message from the original message, send the output to Alibaba Cloud Elasticsearch and specify the index.
1) Go to the Pipeline Management page of the Logstash instance.
2) Click Create Pipeline and configure the pipeline.
The following snapshot shows the configuration file.
input {
  beats {
    port => 8100
  }
}

filter {
  grok {
    match => { "message" => ["%{TIMESTAMP_ISO8601:timestamp} \[%{LOGLEVEL:log_level}\] \<%{DATA:field_misc}\> %{GREEDYDATA:message}"] }
  }
}

output {
   elasticsearch {
      hosts => "es-cn-42333umei000u1zp5.elasticsearch.aliyuncs.com:9200"
      user => "elastic"
      password => "E222ic@123"
      index => "rabbitmqlog-%{+YYYY.MM.dd}"
  }
}
3) Define pipeline parameters and click Save and Deploy.

4) After the successful deployment, view the index data stored on Elasticsearch, which indicates that Elasticsearch has stored the data processed by Logstash.
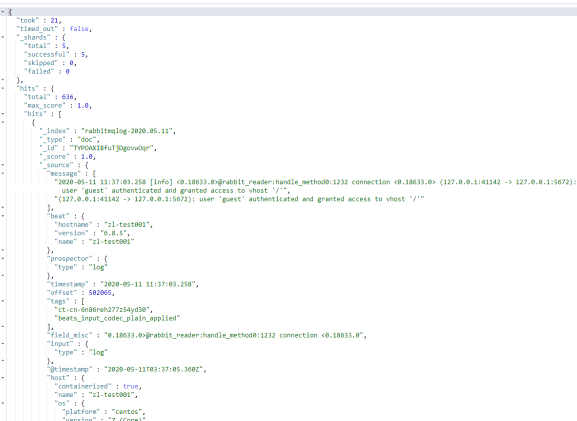
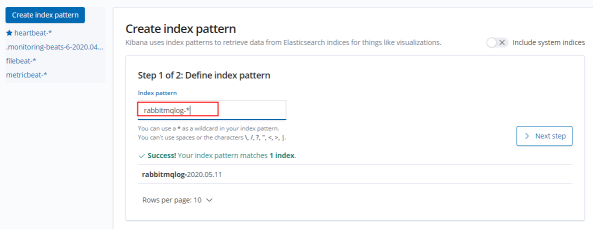
In the Alibaba Cloud Elasticsearch console, switch to the Management page in Kibana and set the Index pattern to Rabbitmlog-*.
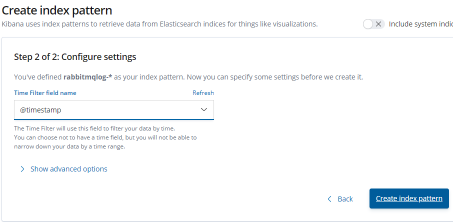
Specify the time filter field and create the index pattern module.
Go to the Discover page, select the created index pattern module, and use the filter to filter out RabbitMQ logs.
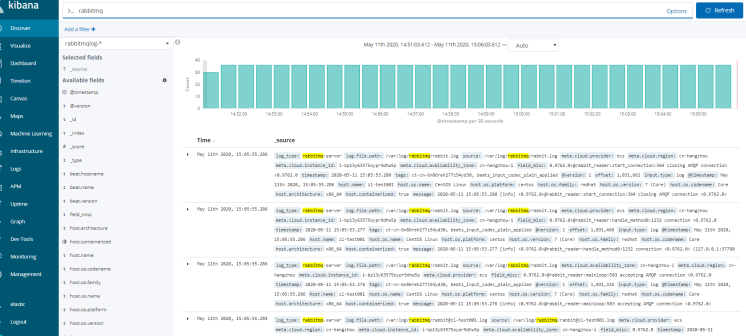
The preceding figure shows the filtered out RabbitMQ logs.
Also, use the Metricbeat index pattern to collect RabbitMQ data and visually monitor the metrics in Kibana.
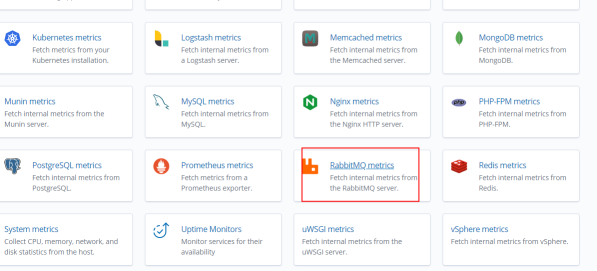
Click Add metric data.
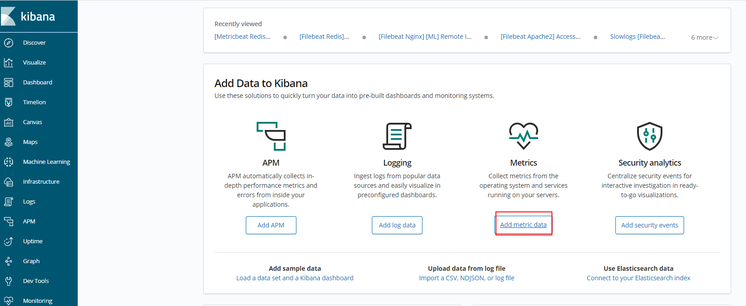
Click RabbitMQ metrics.
Download and install Metricbeat.
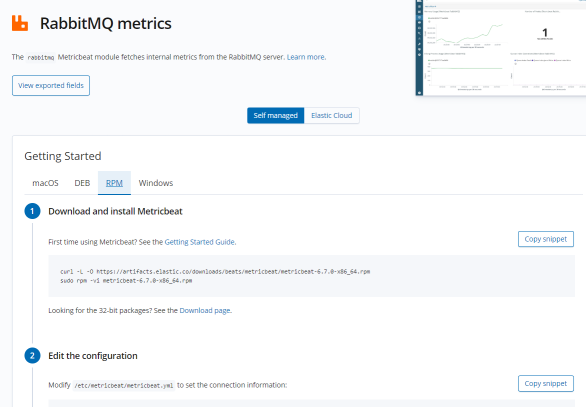
Configure Metricbeat based on the preceding instructions.
Modify the /etc/metricbeat/metricbeat.yml file to configure the Elasticsearch cluster link information.
setup.kibana:
  # Kibana Host
  # Scheme and port can be left out and will be set to the default (http and 5601)
  # In case you specify and additional path, the scheme is required: http://localhost:5601/path
  # IPv6 addresses should always be defined as: https://[2001:db8::1]:5601
   host: "https://es-cn-451233mei000u1zp5.kibana.elasticsearch.aliyuncs.com:5601"
output.elasticsearch:
  # Array of hosts to connect to.
  hosts: ["es-cn-4591jumei000u1zp5.elasticsearch.aliyuncs.com:9200"]
  # Enabled ilm (beta) to use index lifecycle management instead daily indices.
  #ilm.enabled: false
  # Optional protocol and basic auth credentials.
  #protocol: "https"
  username: "elastic"
  password: "12233"
Start the RabbitMQ module and the Metricbeat service.
# sudo metricbeat modules enable rabbitmq
##### Set the dashboard. #######
# sudo metricbeat setup
# sudo service metricbeat start
Restart the Metricbeat service and click Check data on the following page. If the prompt "Data successfully received from this module" appears, data has been received from the module.

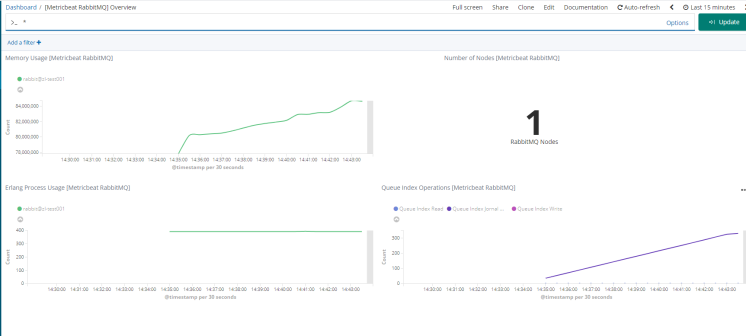
Click the RabbitMQ metrics dashboard to view the monitoring dashboard.
Statement: This article is an authorized revision of the article "Beats: Use the Elastic Stack to Monitor Redis" based on the Alibaba Cloud service environment.
Source: (Page in Chinese) https://elasticstack.blog.csdn.net/
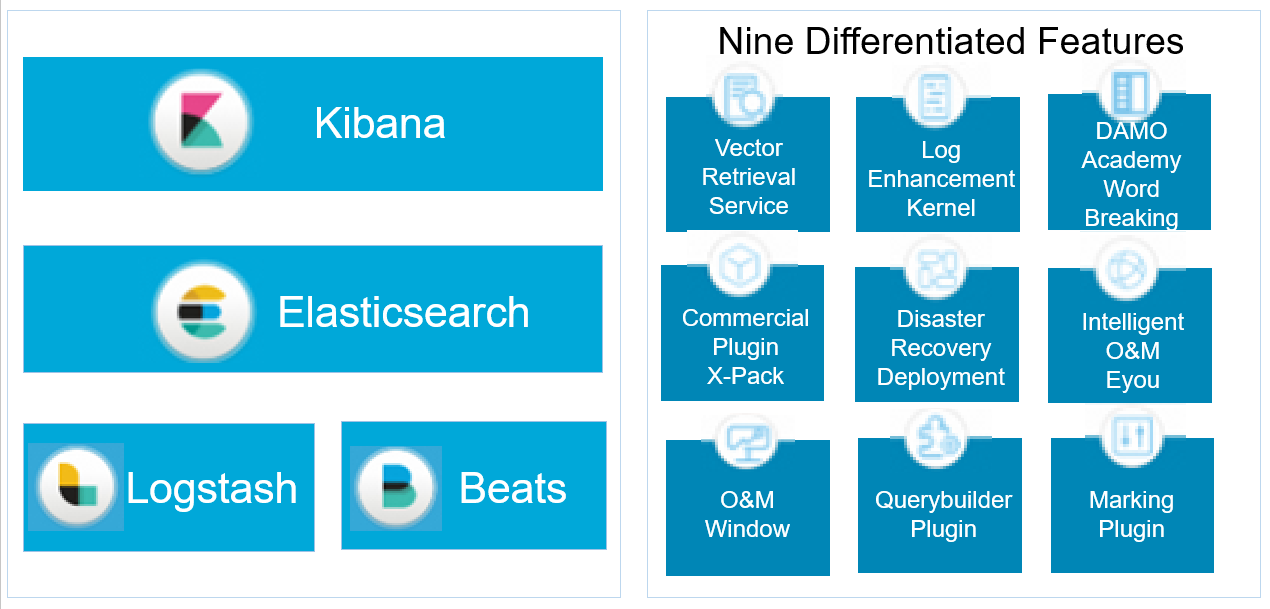
The Alibaba Cloud Elastic Stack is completely compatible with open-source Elasticsearch and has nine unique capabilities.

2,593 posts | 793 followers
FollowAlibaba Cloud Native Community - December 6, 2022
Alibaba Clouder - December 29, 2020
Alibaba Cloud New Products - January 19, 2021
Alibaba Clouder - January 4, 2021
Data Geek - May 14, 2024
Alibaba Clouder - January 29, 2021

2,593 posts | 793 followers
Follow Big Data Consulting for Data Technology Solution
Alibaba Cloud provides big data consulting services to help enterprises leverage advanced data technology.
Learn More Big Data Consulting Services for Retail Solution
Alibaba Cloud experts provide retailers with a lightweight and customized big data consulting service to help you assess your big data maturity and plan your big data journey.
Learn More Quick BI
A new generation of business Intelligence services on the cloud
Learn More Alibaba Cloud Elasticsearch
Alibaba Cloud Elasticsearch helps users easy to build AI-powered search applications seamlessly integrated with large language models, and featuring for the enterprise: robust access control, security monitoring, and automatic updates.
Learn MoreMore Posts by Alibaba Clouder