By Yahai
When it comes to tracing analysis, we will naturally think of using a call chain to troubleshoot exceptions in a single request or using pre-aggregation process statistical metrics for service monitoring and alerting. Tracing analysis also has a third use. It can delimit problems faster than the call chain. It can implement custom diagnosis more flexibly compared with the pre-aggregation monitoring chart. Thus, it can be used for post-aggregation analysis based on process detailed data (or link analysis for short).
Link analysis is based on the stored full-process detail data, providing a free combination and filtering of conditions and aggregation dimensions for real-time analysis. It can meet the custom diagnosis requirements of different scenarios. For example, we might want to see the time series distribution of slow calls that take more than three seconds, the distribution of error requests on different machines, or the traffic changes of VIP customers. This article will introduce how to quickly locate five classic online problems through process analysis. This will help you understand the usage and value of process analysis.
The usage of link analysis based on post-aggregation is very flexible. This article lists only the five most typical scenarios, but you are welcome to share your opinions on other scenarios.
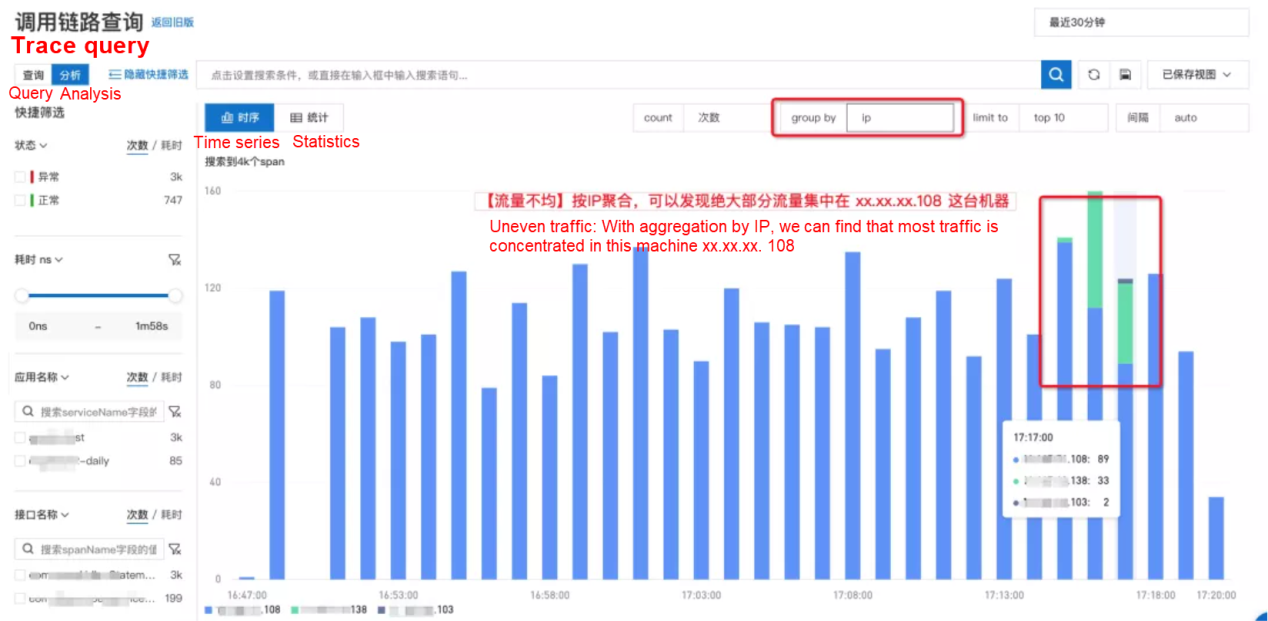
The problem of hot spot breakdown caused by uneven traffic can easily cause service unavailability. There are too many such cases in the production environment. These cases are caused by configuration errors of load balancing, registry exceptions causing services of restart nodes to be unable to launch, or abnormal DHT hash factors.
The biggest risk of uneven traffic is whether the hot spot can be found in time. It is reflected in slower service response or error reporting. Traditional monitoring cannot directly reflect the hot spot issue. Therefore, most of us do not consider this factor the first time, wasting valuable emergency treatment time and causing the failure impact to spread continuously.
Through link analysis, process data is recorded by the IP group to help quickly find out which machines call requests are distributed on, especially to find out the traffic distribution changes before and after the problem occurs. If a large number of requests are suddenly concentrated on one or a small number of machines, it is likely to be a hot spot issue caused by uneven traffic. With the change event when the problem occurred, we can quickly locate the error change that caused the fault and roll back in time.

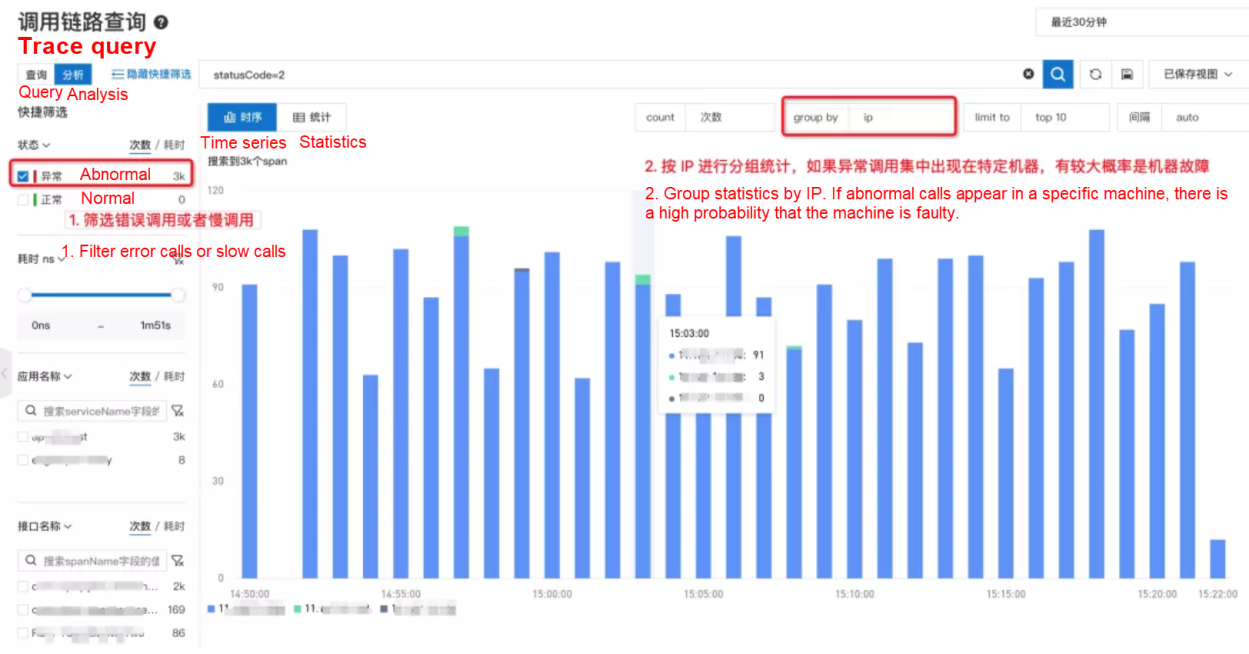
Standalone failures occur all the time, especially in the core cluster due to a large number of nodes. From the perspective of statistical probability, it is almost an inevitable event. A standalone failure does not cause a large area of service unavailability but causes a small number of user request failures or timeouts. It continuously affects the user experience and brings question-and-answer costs. Therefore, such problems need to be handled in a timely manner.
Standalone failure can be divided into two types: host failure and container failure. (It can be divided into Node and Pod in a Kubernetes environment.) For example, CPU oversold and hardware failure are at the host level and affect all containers, but failures (such as full disk and memory overflow) only affect a single container. Therefore, when troubleshooting standalone failure, we can analyze it from the dimensions of the host IP and container IP separately.
When faced with such problems, we can filter out abnormal or timeout requests through link analysis. Then, we perform aggregation analysis according to the host IP or container IP to quickly determine whether there is a standalone failure. If abnormal requests are concentrated on a single machine, we can try to replace the machine for quick recovery. Alternatively, we can check various system parameters of the machine, such as whether the disk space is full or the CPU steal time is too high. If abnormal requests are distributed on multiple machines, the possibility of standalone failure can be ruled out. You can focus on analyzing whether downstream dependent services or program logic are abnormal.

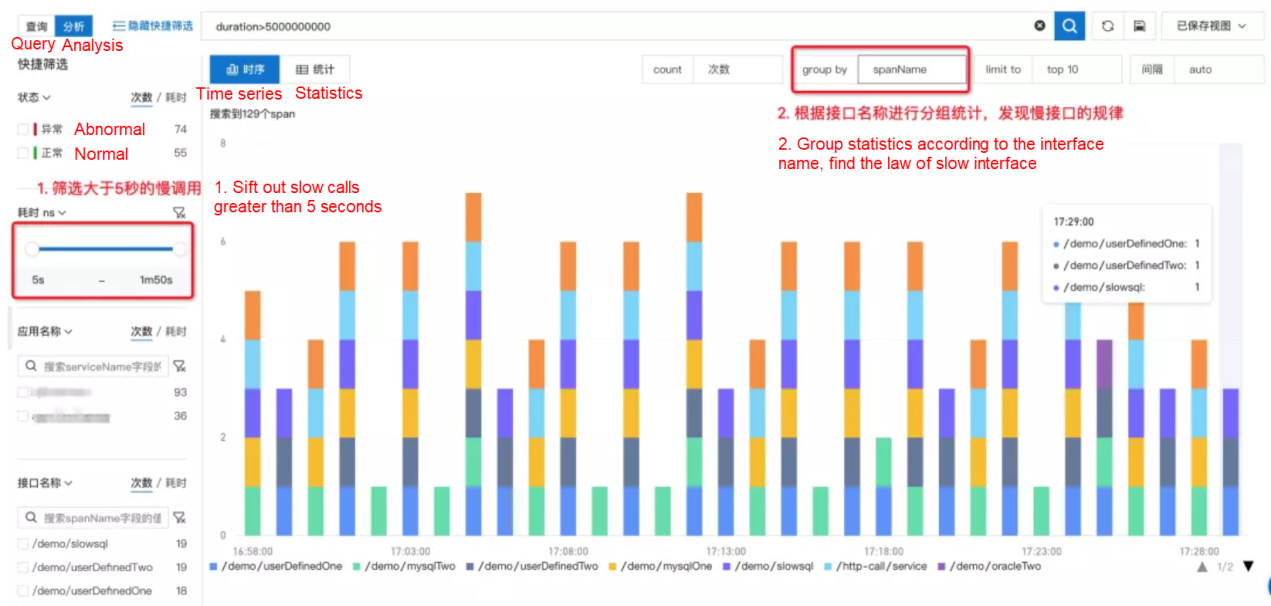
A systematic performance tuning is usually required when a new application is launched or when making preparations for promotion activities. The first step is to analyze the performance bottlenecks in the current system and tease out the slow interface list and its frequency.
At this time, the calls with time consumption greater than a certain threshold can be filtered out through link analysis and grouped for recording according to the interface name. This way, the list and rules of slow interfaces can be quickly located. Then, we can govern the slow interfaces with the highest frequency one by one.
After finding the slow interfaces, we can locate the root causes of slow calls by combining data from the relevant call chain, method stack, and thread pool. Common causes include the following categories:

In the production environment, services are usually standardized, while businesses need to be classified and graded. For the same order service, we need to classify it by category, channel, user, and other dimensions to achieve refined operations. For example, for offline retail channels, the stability of every order and POS machine may trigger public opinion. Service-level Agreement (SLA) requirements for offline channels are much higher than for online channels. How do we accurately monitor the traffic status and service quality of offline retail processes in a common e-commerce service system?
Here, we can use custom attributes filtering and statistics of link analysis to achieve low costs. For example, we put a label {"attributes.channel": "offline"} on the portal service for offline orders. Then, we can add labels according to different stores, user groups, and product categories separately. Finally, we can quickly analyze the traffic trend and service quality of each type of business scenario by setting attributes.channel=offline to do filtering and using Group By statement to group different business tags and calculate call times.
The capability of gray release, monitoring, and rollback is an important criterion for ensuring online stability. Among them, batch gray change is the key means to reducing online risk and controlling the explosion radius. Once we find the service status of the gray batch abnormal, we should roll back in time instead of continuing to release. However, many failures in the production environment are caused by the lack of effective gray monitoring.
For example, when the microservice registry is abnormal, the republished machine cannot be launched for service registration. Due to the lack of gray monitoring, all the restarted machines of the first several batches fail to register, resulting in all traffic being centrally routed to the last batch of machines. However, the overall traffic and duration of the application monitoring do not change significantly until the last batch of machines fails to register. The entire application enters a completely unavailable state, causing serious online failures.
In the case above, if you label the version of different machine traffic {"attributes.version": "v1.0.x"} and use link analysis to group and record attributes.version, you can clearly distinguish the traffic changes and service quality of different versions before and after the release. There will not be gray batch exceptions masked by global monitoring.
Although link analysis is very flexible and can meet the custom diagnostic requirements of different scenarios, it also has several usage constraints:
Link data contains rich values. Traditional call chains and service views are just two classic usages in fixed mode. Link analysis based on post-aggregation can fully unleash the flexibility of diagnosis, meeting the requirements of custom diagnosis in any scenario and dimension. Combined with custom indicator generation rules, it can significantly improve the precision of monitoring and alert and facilitate your Application Performance Management (APM). We welcome everyone to explore, experience, and share!
KubeDL 0.4.0: AI Model Version Management and Tracking Based on Kubernetes
Redefining Analysis: EventBridge Real-Time Event Analysis Platform

664 posts | 55 followers
FollowAlibaba F(x) Team - June 20, 2022
Alibaba Cloud Community - March 21, 2022
Apache Flink Community China - December 25, 2020
ApsaraDB - March 17, 2025
Alibaba Cloud Native - October 11, 2024
Alibaba Cloud Native Community - November 29, 2024

664 posts | 55 followers
Follow Microservices Engine (MSE)
MSE provides a fully managed registration and configuration center, and gateway and microservices governance capabilities.
Learn More ACK One
Provides a control plane to allow users to manage Kubernetes clusters that run based on different infrastructure resources
Learn More Big Data Consulting for Data Technology Solution
Alibaba Cloud provides big data consulting services to help enterprises leverage advanced data technology.
Learn More Cloud Migration Solution
Secure and easy solutions for moving you workloads to the cloud
Learn MoreMore Posts by Alibaba Cloud Native Community