By Renjie from Alibaba Cloud Database OLAP Product Department
ClickHouse is an analytic database based on column-storage computing, developed by the Russian company Yandex. It has been very popular in the OLAP field for the past two years and has been widely used by large Internet enterprises in China. Elasticsearch is an engine tailored for near-real-time distributed search analysis, and its underlying storage is entirely based on Lucene. The standalone search capability of Lucene is extended by Elasticsearch to provide distributed search analysis capabilities. Elasticsearch, along with its open-source components Logstash and Kibana, provides end-to-end log and search analysis functions. Together, they are also referred to as ELK.
In real-world business scenarios, many users are faced with the technical selection challenge of ClickHouse and Elasticsearch. Users do not know enough about ClickHouse and Elasticsearch kernels, so they choose what they want only by testing the performance. This article describes the advantages and disadvantages of ClickHouse and Elasticsearch by analyzing their kernel architectures. Also, a multi-scenario test report is attached for reference.
ClickHouse and Elasticsearch are data products that can be deployed on multiple machines in a distributed manner. First, the author would like to compare the differences in their distributed architectures. The distributed architecture design has a significant impact on the ease of use and scalability of the products. The core issues to be solved for the distributed architecture include node discovery, Meta synchronization, and replica data synchronization. Elasticsearch is an established open-source product, so its technologies are relatively mature. Native node discovery and the Meta synchronization protocol ensure an easy-to-use user experience. The Meta synchronization protocol of Elasticsearch needs to solve problems similar to the open-source Raft protocol. Since Raft did not exist when when Elasticsearch was created, Elasticsearch has to develop its exclusive protocol. After years of development, the Meta synchronization protocol of Elasticsearch is quite mature. Based on the protocol, Elasticsearch provides multi-role distinguishing and auto schema inference features. It is worth mentioning that Elasticsearch does not reuse the Meta synchronization protocol for multi-replica data synchronization. Instead, Elasticsearch uses the traditional primary-standby synchronization mechanism where the primary node synchronizes data to standby nodes. This method is simpler and more efficient.
The capabilities of the ClickHouse distributed architecture are relatively simple because ClickHouse was only developed a few years ago. Its distributed architecture is still in iteration, and the ease of use feature is constantly improving. ClickHouse introduces an external ZooKeeper cluster to issue distributed DDL tasks (node Meta changes) and primary/standby synchronization tasks. The data synchronization tasks between multiple replicas are also issued by the ZooKeeper cluster. However, the data transmission between multiple replicas is ultimately point-to-point data replication through the HTTP protocol. All replicas are writable, and data synchronization is completely multi-directional. As for node discovery, ClickHouse does not have this capability currently. Users need to configure the cluster node address manually to realize node discovery. The "scaffold" distributed architecture of ClickHouse ensures its strong flexible deployment and O&M intervention capabilities, but the ease of use feature is poor. In terms of the elasticity of distributed deployment and cluster scale, there is no difference between ClickHouse and Elasticsearch. The ClickHouse architecture is flat and does not have a front-end node or a back-end node. Clusters of any size can be deployed. In addition, ClickHouse has fine-grained control over multi-replica functions, allowing users to configure table replicas. A single physical cluster can be divided into multiple logical clusters, and users can set the number of shards and replicas for each logical node as needed.
The write throughput is a core metric in big data scenarios. Big data products require fast writes and enough storage space. The design of the real-time write procedure in Elasticsearch is listed below:
In each shard of Elasticsearch, the write process is divided into two parts.
First, data is written to Lucene and then to TransLog. After the write request reaches the shard, the Lucene memory index is written first while the data is still in the memory. Then, TransLog is written. After the TransLog is written, the TransLog data is flushed to the disk. Then, the request is returned to the user. There are some key points. First, data is written to Lucene first to prevent "invalid" data in the write requests from users. Second, a Lucene index is not searchable after being written. It must be flushed and converted to a complete segment and then reopened. The refresh interval can be set by the user. Lucene indexes cannot be viewed in real-time after writing, so Elasticsearch is a near-real-time system. Third, at regular intervals (for example, 30 minutes), Lucene flushes new segments generated in the memory to the disk. After this process, the index files are persistent. The old TransLog data is cleared only when it will not be used anymore.
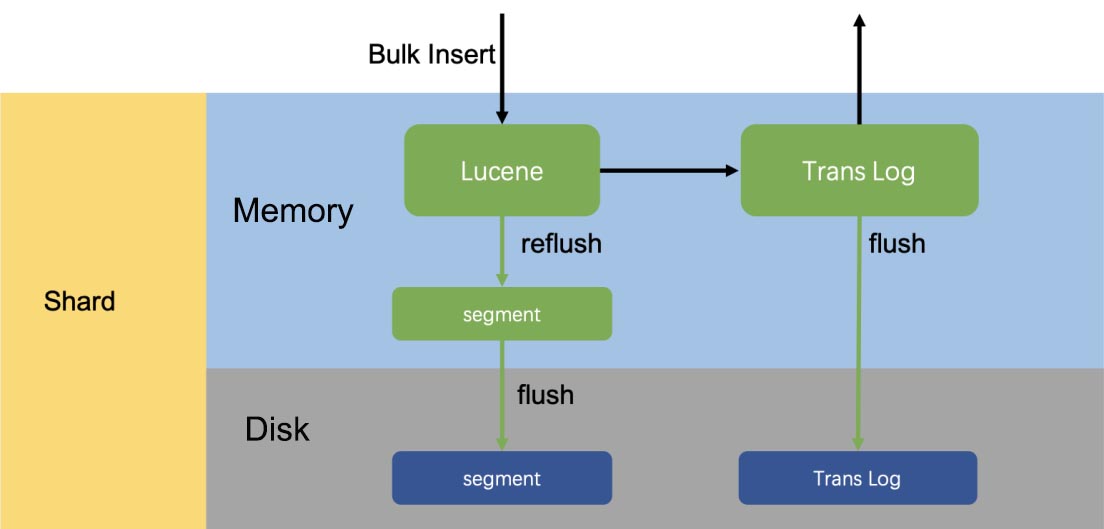
Single-Shard Write Procedure in Elasticsearch
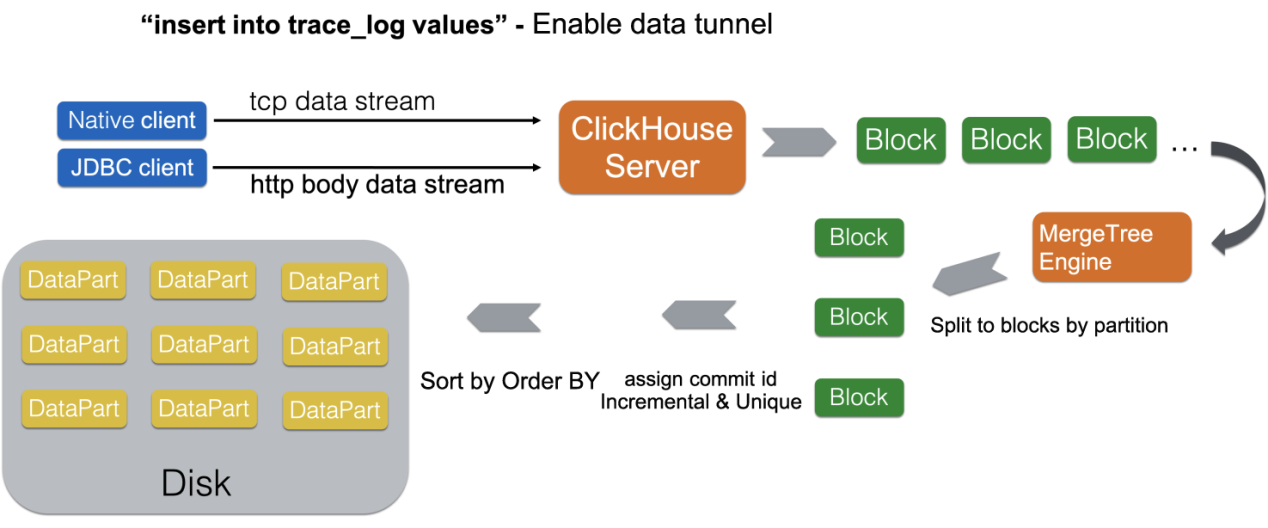
Single-Shard Write Procedure in ClickHouse
The data write in ClickHouse is more simple, direct, and extreme compared to Elasticsearch. As mentioned above, Elasticsearch is a near-real-time system, so the newly written data in the memory storage engine needs to be flushed for search regularly. ClickHouse abandons the memory storage engine and writes all data to the disk directly for persistence. At the same time, the traditional stage of writing redo logs is omitted. In scenarios requiring extremely high write throughput, Elasticsearch and ClickHouse need to sacrifice real-time visibility of data writes to improve throughput. However, ClickHouse realizes high write throughput by implementing delayed data batch write on the client side. In terms of multi-replica synchronization, Elasticsearch requires real-time synchronization. Write requests are processed in multiple replicas before they are returned. ClickHouse relies on ZooKeeper for asynchronous disk file synchronization. In practice, the write throughput of a ClickHouse node is much higher than an Elasticsearch node of the same specification.
The storage designs of Elasticsearch and ClickHouse look similar, but their capabilities are quite different. Elasticsearch disk files are composed of individual segments, and a segment is the smallest unit of the Lucene index. Segments are merged asynchronously in the background, which solves two problems:
A secondary index is a globally ordered index since one index for all data is better for query acceleration than multiple indexes. Elasticsearch supports the primary key deletion and update operations that rely on the deletion feature of Lucene indexes. The update operation is converted into the deletion and write operations. If there are multiple deletion records in segments in the Lucene index, the system needs to merge segments to remove these records. When multiple segments are merged, the stored data in the Lucene index are merged in append-only mode. In this situation, "reordering" of secondary indexes is not required after the merging.
Compared with segments in Elasticsearch, the smallest unit in ClickHouse storage is DataPart. Data written in a batch at a time is written into a DataPart. The data stored in DataPart is completely ordered by the ORDER BY statement defined in the table. This ordered storage is a default clustered index that can be used to accelerate data scanning. ClickHouse also asynchronously merges Data Parts, which also solves two issues:
DataParts are merged in merge-sorted mode, and the merged DataParts are still in a completely ordered state. Depending on the setting of completely ordered DataPart storage, ClickHouse updates primary key data in a completely different way. When changing the primary key, Elasticsearch uses a method with this procedure:
checking the original record > generating a new record > deleting the original record > writing data to the new record
This method limits the efficiency of the primary key update, and there is a significant difference between the efficiency of data writing after the primary key update and append-only writing. The primary key update in ClickHouse is completely asynchronous, so the latest versions of multiple records with the same primary key are generated during an asynchronous merge. This asynchronous batch mode is more efficient for the primary key update.
To sum up, the file storage capability differences between segment and DataPart are listed below:
When it comes to the feature of Elasticsearch, the word schemaless is mentioned. Elasticsearch can infer the json-schema of written data automatically and then adjust the Meta structure of the storage table. This feature saves users from creating tables and adding columns. However, the author thinks auto schema inference is a more appropriate name because it benefits from the distributed Meta synchronization capability of Elasticsearch. The storage of Elasticsearch requires schema and is strongly bound to schema because the core of Elasticsearch storage is secondary indexes. An index cannot be created for a field without type. The real schemaless requires the field types to be flexibly and efficiently changed while the query performance does not decline significantly. Currently, if a user wants to change a field type in the Elasticsearch index, only one method is available: re-index the entire data. In contrast, the storage of ClickHouse is not strongly bound to schema because the analysis capability of ClickHouse is centered on storage scanning. The data types can be converted dynamically during data scanning, and field types can also be slowly and asynchronously adjusted when merging DataParts. The cost of changing field types during query is that the overhead of the cast operator is increased. However, users will not experience a sharp performance decline. In the author's view, schemaless is not the strong point of Elasticsearch, but its weakness. As for auto schema inference, it is very friendly to small-scale users. However, it will never be able to create a schema with the best performance for users. In scenarios with a large amount of data, it is still necessary to create a schema based on specific query requirements. After all, convenience is accompanied by costs.
The compute engine of Elasticsearch is a general-purpose search engine. The query complexity that a search engine can deal with is limited. All search queries in a search engine can be returned with a result through several definite stages, while the computing engine cannot. Although Elasticsearch has SQL plug-ins, the implementation logic of these plug-ins is to translate simple SQL queries into specific search modes. For data analysis that is not supported by the search engine, Elasticsearch-SQL can do nothing. In addition, the current translation capabilities of Elasticsearch SQL are not perfect and intelligent. Users still need to try the native query APIs of Elasticsearch to achieve the best search performance. The query APIs of Elasticsearch are unfamiliar to users accustomed to using SQL because the code for complex queries is difficult to write.
The search engine of Elasticsearch supports three different search modes: query_and_fetch, query_then_fetch, and dfs_query_then_fetch. The first mode is very simple. Each distributed node searches independently and then returns the results to the client. In the second mode, each distributed storage node searches for the IDs and corresponding scores of TopN records. Then, IDs and scores are sent to the node with a query to obtain the final TopN result. Next, the storage node is requested to obtain the detailed data. The design of the two-round request aims to minimize the amount of detailed data, which is the number of disk scans. For the last mode, count the global Term Frequency (TF) and Document Frequency (DF) first and then perform query_then_fetch to balance the scoring criteria of each storage node. The search engine of Elasticsearch does not have the streaming processing capability of the database computing engine. It processes requests in a completely turn-based manner. When the amount of data to be returned is large, the query will fail easily or triggers garbage collection (GC). Generally, the upper capability limit of the search engine in Elasticsearch is a two-phase query. So, Elasticsearch cannot process some queries, such as multi-table associated queries.
The computing engine of ClickHouse is vectorized. It uses vectorization functions and aggregator operators based on C++ templates to achieve excellent processing performance on aggregate queries. In combination with the excellent parallel scanning capability of storage, resources can be fully utilized. The computing engine of ClickHouse covers the capabilities of the search engine of Elasticsearch in terms of analysis query support. A computing engine with full SQL capabilities allows users to analyze data more flexibly.
ClickHouse is a computing engine based on column storage, and it takes ordered storage as the core. In the process of querying and scanning data, information, such as storage orderliness, column-storage block statistics, and partition keys, infers the column-storage blocks to be scanned. Then, data scanning is performed in parallel. Expression computing and aggregate computing are processed in a normal computing engine. From the computing engine to data scanning, data is transferred in column-storage blocks, which is highly vectorized. As described in the preceding section, Elasticsearch mainly scans data in the query and fetch phases. In the query phase, Elasticsearch scans the Lucene index files to obtain the queried DocIds and scans the column-storage files for aggregate computing. In the fetch phase, point queries are performed on row-storage files in Lucene indexes to read detailed data. Both expression computing and aggregate computing can occur in both phases, and the computing is completed by rows. In general, neither the data scanning nor the computing capabilities of Elasticsearch are vectorized and are based on secondary index results. If the number of target rows returned by secondary indexes is particularly large (for analysis queries involving a large amount of data), you can see the data processing weakness of the Elasticsearch search engine clearly.
Many users think ClickHouse is strong in query processing but weak in concurrency because the parallelism in ClickHouse is awesome and a major strength of ClickHouse. The disk throughput can be fully occupied for processing just one query, and query parallelism does not depend on shards, which can be adjusted at will. The throughput of processing concurrent requests is the key metric for measuring the efficiency of a data system. On the architecture of ClickHouse, there are no natural concurrency defects. For ClickHouse, the data volume to be scanned and the computing complexity of a query determine the computing operations of ClickHouse. The concurrency limit of ClickHouse is determined by the hardware capability. The concurrency capability of ClickHouse is quite good, so it is a misunderstanding that its concurrency capability is not so good. ClickHouse aims to keep the latency of a single query as low as possible by default. In some scenarios, users can improve the concurrency by setting appropriate system parameters, such as max_threads. Why does Elasticsearch have good concurrency in some scenarios?
First, from the perspective of cache design, Elasticsearch cache includes query cache, request cache, data cache, and index cache. The cache is accelerated at all stages, from query results to index scanning results, because Elasticsearch believes the scenario contains hot data, which may be queried frequently. However, ClickHouse only contains the UnCompressedBlockCache for I/O and PageCache for the system. Why? ClickHouse focuses on query analysis scenarios where the data and queries are changeable, and the other caches, such as cache for query results, are hard to hit. Therefore, ClickHouse always focuses on disk data with excellent I/O cache capabilities.
Second, in terms of the data scanning granularity, Elasticsearch can create secondary indexes on all columns. Secondary indexes are generally loaded in the memory in advance, so the cost of obtaining index query results is low even in changeable query conditions. Once the result is obtained, Elaticsearch can read data by rows for computing. Native ClickHouse does not support secondary indexes. It can only scan a large amount of data to filter results under changeable query conditions.
Note: Alibaba Cloud ClickHouse supports secondary indexes to solve this problem, and the performance is comparable to that of Elasticsearch. For more information, please see the performance evaluation section.
However, even though Elasticsearch supports secondary indexes, is its concurrency any good? Maybe not. If a large result set is returned for a secondary index, a large number of I/O scans will also be performed. This means the concurrency is not high unless the data cache of Elasticsearch is large enough to load all original data to the memory.
In summary, Elasticsearch is stronger in concurrency only in pure search scenarios (only a small number of records are filtered out by the WHERE clause) and a running environment with sufficient memory. In analysis scenarios with a large number of records filtered out by the WHERE clause, ClickHouse is stronger due to its excellent column-storage mode and vectorized computing. The two focus on different aspects. In addition, the concurrent processing capability of ClickHouse is based on the disk throughput, while in Elasticsearch, it is based on the memory cache. ClickHouse is more suitable for low-cost analysis scenarios with a data volume because it can make full use of the disk bandwidth.
In this section, the author selects multiple typical data scenarios of the user business and makes a comprehensive performance test for Elasticsearch and ClickHouse. The specific cluster environment for testing is listed below:
| ClickHouse | Elasticsearch | Node Number |
| CPU: 8 cores Memory: 32 GB Storage: ESSD PL1 1,500 GB |
CPU: 8 cores Memory: 32 GB Storage: ESSD PL1 1,500 GB |
4 |
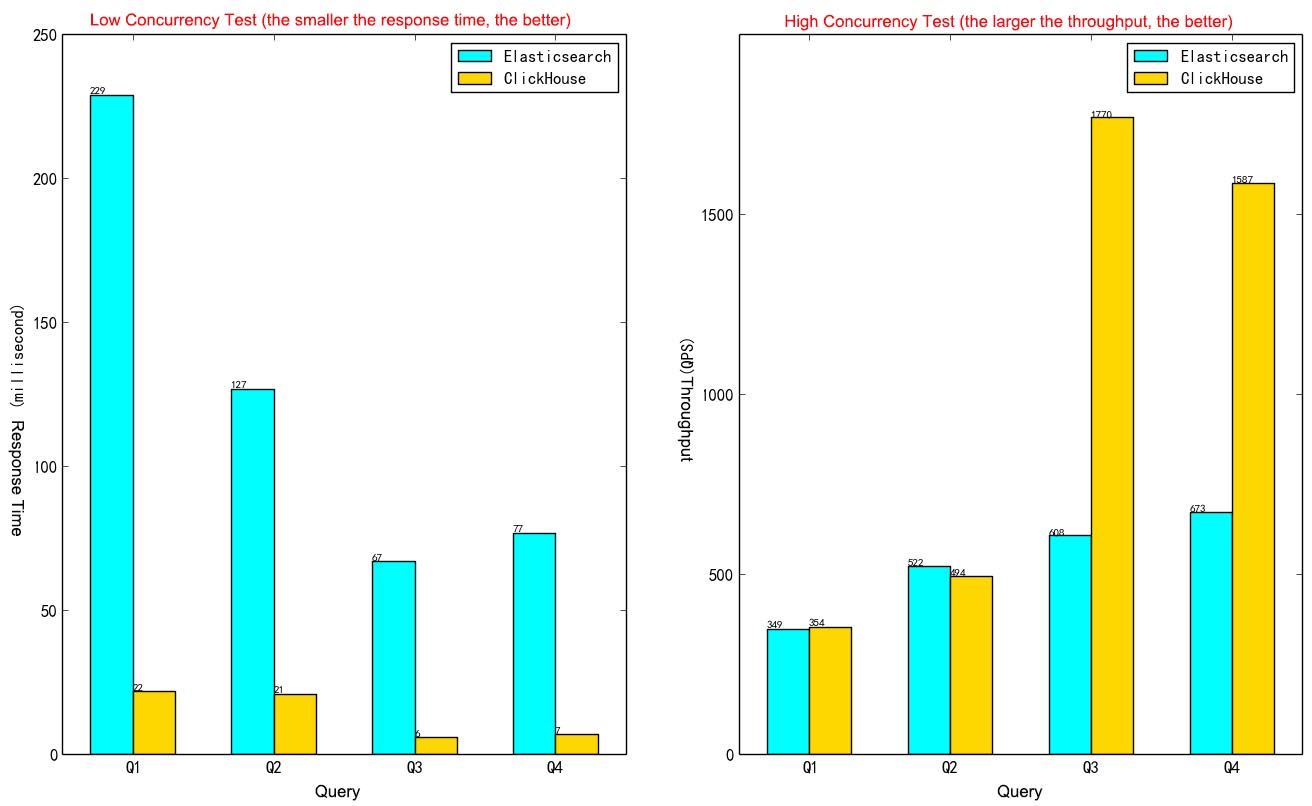
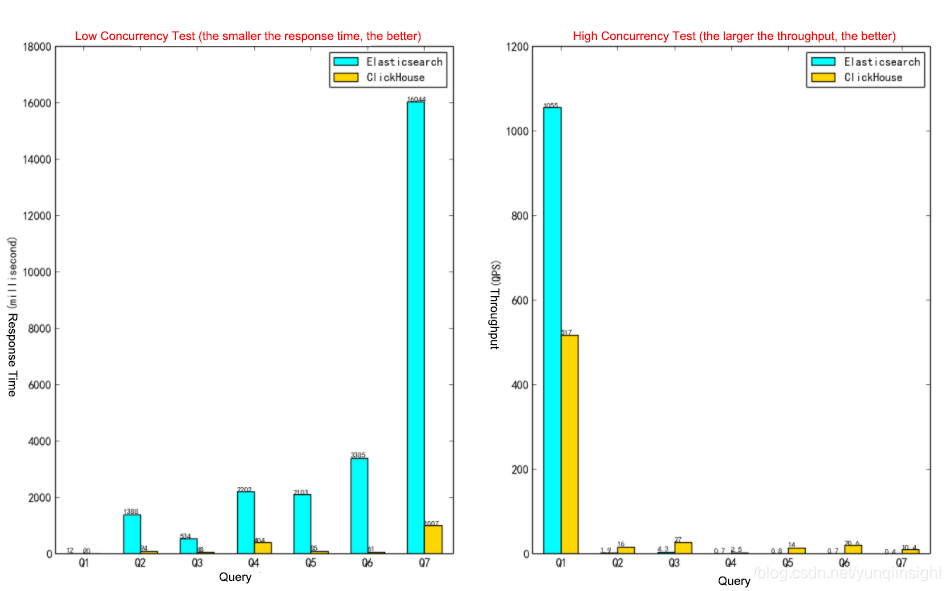
For log analysis, the author selected two representative query scenarios for comparative testing, and the results are listed below. The results show how the performance gap between ClickHouse and Elasicsearch increases as the number of records filtered by the WHERE clause increases. In trace_log scenarios with larger data volumes, the performance gap of query analysis is clear. Please refer to Log Analysis Scenarios to download table creation and query statements for Elasticsearch and ClickHouse.
access_log (Data Volume: 197,921,836 Records)The table creation statements for ClickHouse are listed below:
CREATE TABLE access_log_local on cluster default
(
  `sql` String,
  `schema` String,
  `type` String,
  `access_ip` String,
  `conn_id` UInt32,
  `process_id` String,
  `logic_ins_id` UInt32,
  `accept_time` UInt64,
  `_date` DateTime,
  `total_time` UInt32,
  `succeed` String,
  `inst_name` String
)
ENGINE = MergeTree()
PARTITION BY toYYYYMMDD(_date)
ORDER BY (logic_ins_id, accept_time);

CREATE TABLE access_log on cluster default as access_log_local
engine = Distributed(default, default, access_log_local, rand());
The query statements for ClickHouse are listed below:
--Q1
select _date, accept_time, access_ip, type, total_time, concat(toString(total_time),'ms') as total_time_ms, sql,schema,succeed,process_id,inst_name from access_log where _date >= '2020-12-27 00:38:31' and _date <= '2020-12-28 00:38:31' and logic_ins_id = 502680264 and accept_time <= 1609087111000 and accept_time >= 1609000711000 and positionCaseInsensitive(sql, 'select') > 0 order by accept_time desc limit 50,50;
--Q2
select
case
when total_time <=100 then 1
when total_time > 100 and total_time <= 500 then 2
when total_time > 500 and total_time <= 1000 then 3
when total_time > 1000 and total_time <= 3000 then 4
when total_time > 3000 and total_time <= 10000 then 5
when total_time > 10000 and total_time <= 30000 then 6
else 7
end as reorder,
case
when total_time <=100 then '0~100ms'
when total_time > 100 and total_time <= 500 then '100ms~500ms'
when total_time > 500 and total_time <= 1000 then '500ms~1s'
when total_time > 1000 and total_time <= 3000 then '1s~3s'
when total_time > 3000 and total_time <= 10000 then '3s~10s'
when total_time > 10000 and total_time <= 30000 then '10s~30s'
else '30s以上'
end as label,
case
when total_time <= 100 then '0~100'
when total_time > 100 and total_time <= 500 then '100~500'
when total_time > 500 and total_time <= 1000 then '500~1000'
when total_time > 1000 and total_time <= 3000 then '1000~3000'
when total_time > 3000 and total_time <= 10000 then '3000~10000'
when total_time > 10000 and total_time <= 30000 then '10000~30000'
else '30000~10000000000'
end as vlabel,
count() as value
from access_log
where logic_ins_id = 502867976 and _date >= '2020-12-27 00:38:31' and _date <= '2020-12-28 00:38:31' and accept_time <= 1609087111000 and accept_time >= 1609000711000
group by label,vlabel,reorder
order by reorder;
--Q3
select toStartOfMinute(_date) as time, count() as value
from access_log
where logic_ins_id = 500152868 and accept_time <= 1609087111000 and accept_time >= 1609000711000
group by time
order by time;
--Q4
select count(*) as c from (
  select _date, accept_time, access_ip, type, total_time, concat(toString(total_time),'ms') as total_time_ms, sql, schema, succeed, process_id, inst_name
  from access_log
  where logic_ins_id = 501422856 and _date >= '2020-12-27 00:38:31' and _date <= '2020-12-28 00:38:31' and accept_time <= 1609087111000 and accept_time >= 1609000711000
);
Performance Comparison:
trace_log (Data Volume: 569,816,761 Records)The table creation statements for ClickHouse are listed below:
CREATE TABLE trace_local on cluster default
(
  `serviceName` LowCardinality(String),
  `host` LowCardinality(String),
  `ip` String,
  `spanName` String,
  `spanId` String,
  `pid` LowCardinality(String),
  `parentSpanId` String,
  `ppid` String,
  `duration` Int64,
  `rpcType` Int32,
  `startTime` Int64,
  `traceId` String,
  `tags.k` Array(String),
  `tags.v` Array(String),
  `events` String,
  KEY trace_idx traceId TYPE range
) ENGINE = MergeTree()
PARTITION BY intDiv(startTime, toInt64(7200000000))
PRIMARY KEY (serviceName, host, ip, pid, spanName)
ORDER BY (serviceName, host, ip, pid, spanName, tags.k);

CREATE TABLE trace on cluster default as trace_local
engine = Distributed(default, default, trace_local, rand());
The query statements for ClickHouse are listed below:
--Q1
select *
from trace
prewhere
traceId ='ccc6084420b76183'
where startTime > 1597968000300000  and startTime <  1598054399099000 settings max_threads = 1;
--Q2
select count(*) count, spanName as name from trace
where serviceName ='conan-dean-user-period'
and startTime > 1597968000300000  and startTime <  1598054399099000
group by spanName
order by count desc limit 1000;
--Q3
select host as name, count(*) count
from trace
where serviceName ='conan-dean-user-period'
and startTime > 1597968000300000  and startTime <  1598054399099000
group by host;
--Q4
select count(*) count, tags.k as name  from trace
array join tags.k
where serviceName ='conan-dean-user-period'
and startTime > 1597968000300000  and startTime <  1598054399099000
group by tags.k;
--Q5
select count(*) spancount,
sum(duration) as sumDuration, intDiv(startTime, 1440000000) as timeSel
from trace
where serviceName ='conan-dean-user-period'
and startTime > 1597968000300000  and startTime <  1598054399099000
group by timeSel;
--Q6
select count(*) spanCount,
countIf(duration  <=1000000), countIf(duration > 1000000),  countIf(duration > 3000000)
from trace
where serviceName ='conan-dean-user-period'
and startTime > 1597968000300000  and startTime <  1598054399099000;
--Q7
select  host, startTime,traceId,spanName,duration,tags.k,tags.v
from trace
where serviceName ='conan-dean-user-period'
and startTime > 1597968000300000  and startTime <  1598054399099000 limit 1000000;
Performance Comparison:
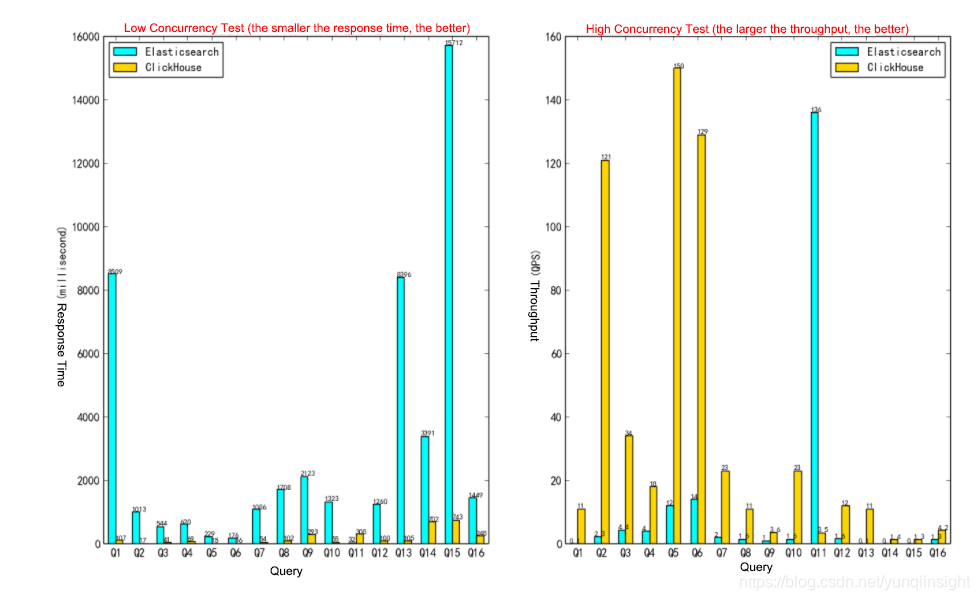
OnTime Test Set is an analytical query benchmark recommended on the ClickHouse official website to compare the performance differences between ClickHouse and Elasticsearch. The author used this dataset for testing and comparison, and the results are as listed below. ClickHouse has huge performance advantages in analytical query scenarios. Please refer to Aggregate Analysis Scenarios to download the table creation and query statements for Elasticsearch and ClickHouse.
User persona is a typical scenario where it is difficult to choose Elasticsearch or ClickHouse. In this scenario, tables are super-large wide tables, the data is updated and written in large scales, data volume returned by a query is large, and filtering conditions are complex and changeable. Users encounter two problems when using Elasticsearch:
Based on the real-world business scenarios, for this scenario, the author mocked a large wide table with nearly 150 columns to perform relevant query tests. The specific queries are listed below, and the result set of each query contains 0.1 million to 1 million rows. Please refer to User Persona Scenarios to download the table creation and query statements for Elasticsearch and ClickHouse.
The query statements for ClickHouse are listed below:
--Q1
select user_id
from person_tag
where mock3d_like > 8 and mock3d_consume_content_cnt > 8 and mock_10_day_product_avg_amt < 1 settings append_squashing_after_filter = 1;
--Q2
select user_id
from person_tag
where mock_7_day_receive_cnt > 8 and like_fitness = 1 and mock14d_share_cnt > 8 settings append_squashing_after_filter = 1;
--Q3
select user_id
from person_tag
where home_perfer_mock_score > 8 and mock7d_access_homepage_cnt > 8 settings append_squashing_after_filter = 1;
--Q4
select user_id
from person_tag
where is_send_register_coupon > 8 and mock1d_like > 8 settings append_squashing_after_filter = 1;
--Q5
select user_id
from person_tag
where like_sports = 1 and like_3c = 1 and sex = 1 and like_dance = 1 and mock1d_share_cnt > 6 settings append_squashing_after_filter = 1;
--Q6
select user_id
from person_tag
where mock14d_access_homepage_cnt > 8 and like_anime = 1 settings append_squashing_after_filter = 1;
--Q7
select user_id,offline_ver,is_visitor,mock1d_comment_like,reg_days,mock14d_share_cnt,mock_30_order_avg_delivery_time_cnt,mock7d_comment_cnt,performance_rate,mock3d_valid_user_follow_cnt,mock30d_consume_content_cnt,like_cnt,like_photo,ls90_day_access_days,mock3d_release_trend_cnt,mock14d_access_homepage_range,qutdoor_perfer_mock_score,mock3d_access_homepage_cnt,mock_15_order_avg_delivery_time_cnt,mock7d_release_trend_cnt,like_food,mock30d_follow_topic_cnt,mock7d_is_access_topic,like_music,mock3d_interactive_cnt,mock14d_valid_user_follow_cnt,reg_platform,mock_7_day_lottery_participate_cnt,pre_churn_users,etl_time,like_anime,mock14d_access_homepage_cnt,mock14d_consume_content_cnt,like_travel,like_watches,mock14d_comment_like,ls30_day_access_days,mock14d_release_trend_cnt,ftooeawr_perfer_mock_score,mock7d_valid_user_follow_cnt,beauty_perfer_mock_score
from person_tag
where mock3d_like > 8 and mock3d_consume_content_cnt > 8 and mock_10_day_product_avg_amt < 1 settings append_squashing_after_filter = 1;
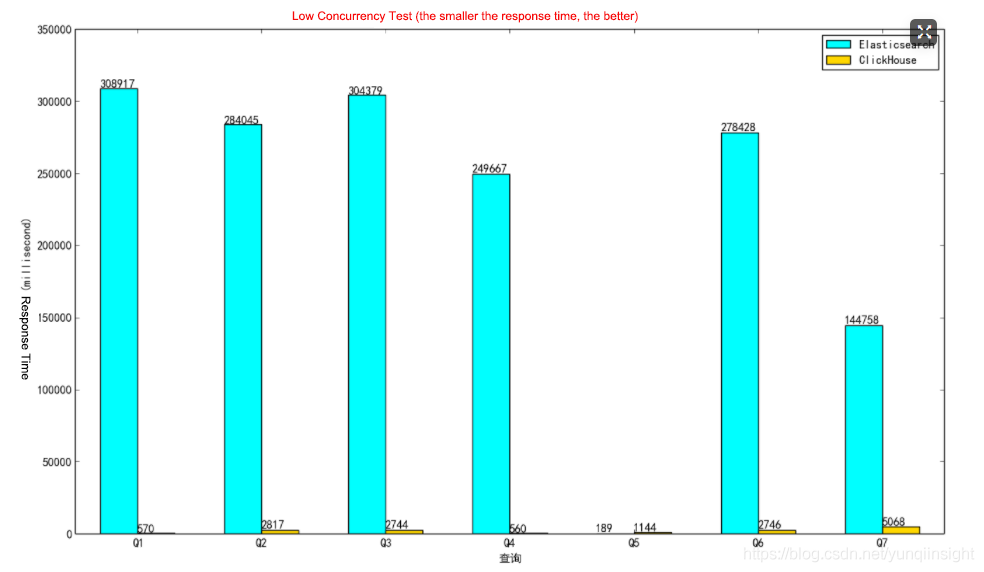
The following figure compares the query performance in Elasticsearch and ClickHouse. It shows how the performance of Elasticsearch varies dramatically in the scenario of scanning and exporting a large amount of result data; the larger the result set, the slower the response. Q5 is the comparison case where the result set is very small.
In analytic query scenarios, users may need to perform a point query on detailed data. For example, they may query detailed information by the TraceId of logs. Open-source ClickHouse does not have secondary index capabilities. If this is the case, the query performance of ClickHouse cannot compete with that of Elasticsearch. Alibaba Cloud ClickHouse provides an exclusive secondary index capability to strengthen the weakness. Here, the author added a point query scenario of secondary indexes to test and compare the query performance. Please refer to Point Query Scenarios of Secondary Indexes to download the table creation and query statements for Elasticsearch and ClickHouse.
The table creation statements for ClickHouse are listed below:
CREATE TABLE point_search_test_local on cluster default (
 `PRI_KEY` String,
 `SED_KEY` String,
 `INT_0` UInt32,
 `INT_1` UInt32,
 `INT_2` UInt32,
 `INT_3` UInt32,
 `INT_4` UInt32,
 `LONG_0` UInt64,
 `LONG_1` UInt64,
 `LONG_2` UInt64,
 `LONG_3` UInt64,
 `LONG_4` UInt64,
 `STR_0` String,
 `STR_1` String,
 `STR_2` String,
 `STR_3` String,
 `STR_4` String,
 `FIXSTR_0` FixedString(16),
 `FIXSTR_1` FixedString(16),
 `FIXSTR_2` FixedString(16),
 `FIXSTR_3` FixedString(16),
 `FIXSTR_4` FixedString(16),
 KEY SED_KEY_IDX SED_KEY Type range
) ENGINE = MergeTree ORDER BY PRI_KEY
SETTINGS index_granularity_bytes = 4096, secondary_key_segment_min_rows = 1000000000, min_rows_for_wide_part = 2000000000;

CREATE TABLE point_search_test on cluster default as point_search_test_local
engine = Distributed(default, default, point_search_test_local, rand());
The query statement for ClickHouse is listed below:
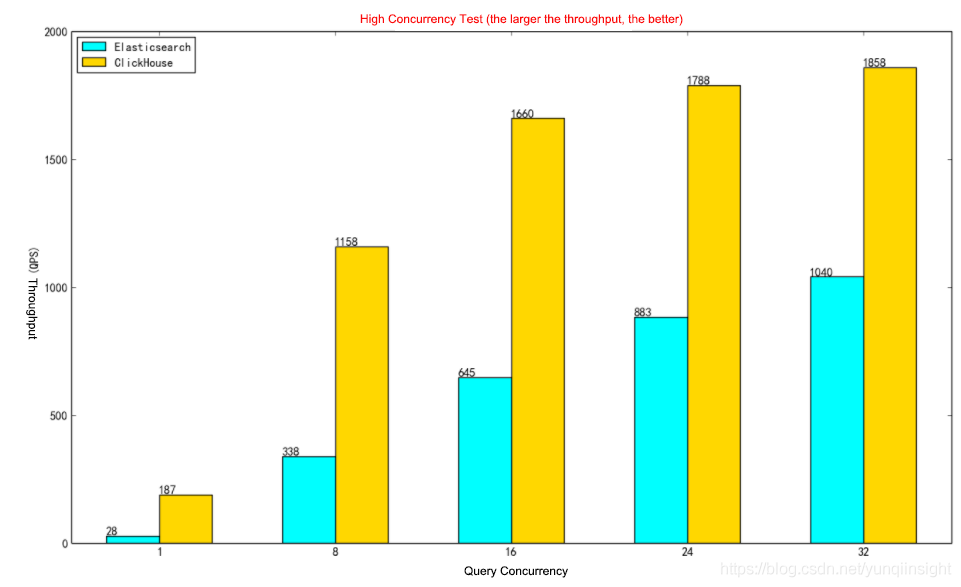
select * from point_search_test where SED_KEY = 'XXX' settings max_threads = 1;The following figure shows the comparison of the query performance. With the secondary index capability, the point query performance of Alibaba Cloud ClickHouse is as strong as that of Elasticsearch. Secondary indexes are supported natively by ClickHouse storage, and the performance is excellent. For more information about the secondary indexes of Alibaba Cloud ClickHouse, please see the document about Alibaba Cloud ClickHouse secondary indexes.
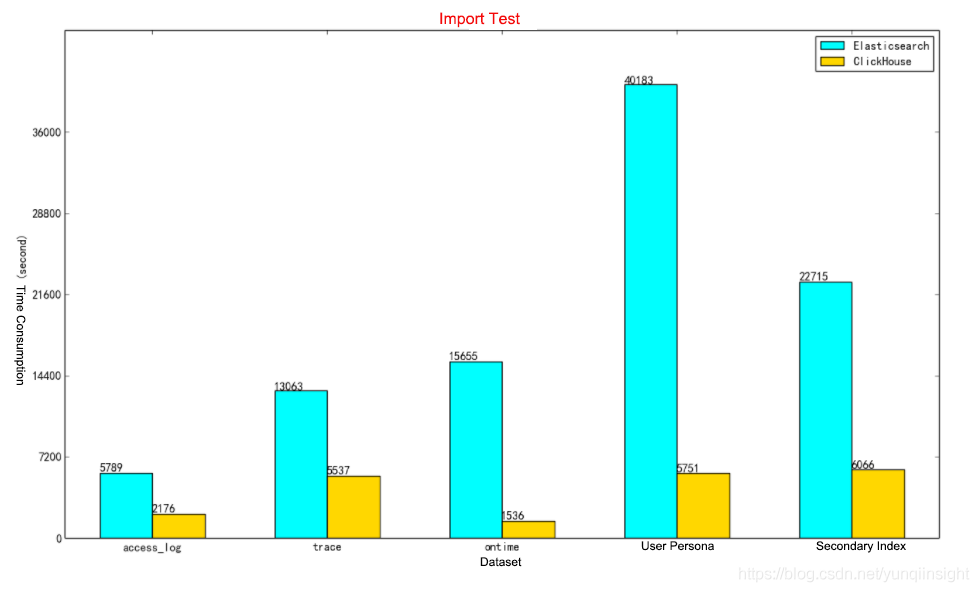
For data in datasets mentioned above, the author used the ESSD local file import method to test and compare the import performance in Elasticsearch and ClickHouse. ClickHouse uses the ClickHouse-Client to read local files of various formats and import the data. Elasticsearch uses Logstash to import data. The specific time-consumption results are listed as follows:
Elasticsearch is excellent in search scenarios where only a few records are filtered out by the WHERE clause. In a running environment with sufficient memory resources, Elasticsearch has excellent concurrent query capabilities. However, in analysis scenarios of large-scale data where a large number of records are filtered out by the WHERE clause, ClickHouse will have better concurrency performance due to its excellent column-storage mode and vectorized computing. In addition, ClickHouse supports more types of queries. The concurrent processing capabilities of ClickHouse are based on the disk throughput, while those of Elasticsearch are based on the memory cache. Therefore, their costs are different.
ClickHouse is suitable for low-cost analysis scenarios with large data volumes because it can fully utilize the disk bandwidth. In terms of data import and storage costs, ClickHouse has an advantage.
Secondary Index in Alibaba Cloud ClickHouse – Best Practices
Introduction to the Usage and Principles of MongoDB Sharded Cluster
ApsaraDB - July 7, 2021
ApsaraDB - May 7, 2021
Data Geek - June 6, 2024
ApsaraDB - November 26, 2025
Alibaba EMR - March 18, 2022
Alibaba Cloud Big Data and AI - February 26, 2026
 ApsaraDB for HBase
ApsaraDB for HBase is a NoSQL database engine that is highly optimized and 100% compatible with the community edition of HBase.
Learn More Big Data Consulting for Data Technology Solution
Alibaba Cloud provides big data consulting services to help enterprises leverage advanced data technology.
Learn More Big Data Consulting Services for Retail Solution
Alibaba Cloud experts provide retailers with a lightweight and customized big data consulting service to help you assess your big data maturity and plan your big data journey.
Learn More Alibaba Cloud Elasticsearch
Alibaba Cloud Elasticsearch helps users easy to build AI-powered search applications seamlessly integrated with large language models, and featuring for the enterprise: robust access control, security monitoring, and automatic updates.
Learn MoreMore Posts by ApsaraDB