By Liu Jianwei.
In the operation and management processes of actual data platforms, data tables often grow very large with the inflow of more business data and the construction of data applications. Data management personnel often want to use metadata analysis to better understand the usage of different data tables in order to optimize their data models.
In this article, we are going to show you one way how you can use metadata Analysis with Alibaba Cloud MaxCompute. Specifically, this article shows how you can analyze hot and cold tables through MaxCompute metadata.
MaxCompute InformationSchema provides tables that contains the full table metadata for a project and tasks_history that contains detailed data for jobs that access tables. By summarizing the number of times each table is accessed by a job, you can see how often different tables are used.
input_tables field in the tasks_history table, and then use count to count the number of times each table is used in a certain time window.input_tables in tables and tasks_history. This allows you to count the number of times each table is used within the specified time window and list the tables in ascending order.To implement the solution we discussed above, follow the steps given below:
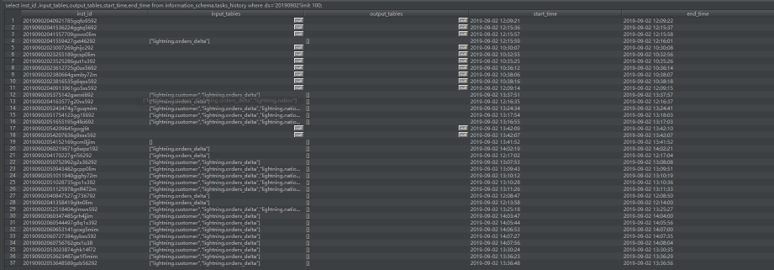
1. Obtain the details of the input_tables field in the tasks_history table with the following command:
select
inst_id ,
input_tables,
output_tables,
start_time,
end_time
from information_schema.tasks_history
where ds='20190902'limit 100;
For the above command, you can adjust the time condition to suit your specific needs. The results should look something like this:

The format of the input_tables field in the tasks_history table is ["lightning.customer","lightning.orders_delta"]. Therefore, you need to separate the fields with commas (,) when compiling statistics.
Function processing:
select
--Remove the brackets ([]) at the beginning and end of the input_tables field
trans_array(1,",",inst_id,replace(replace(input_tables,"[",""),"]","")) as (inst_id,input_table)
from information_schema.tasks_history
--The date can be defined based on actual requirements, in which case 20190902 is used as an example
where ds='20190902' limit 100;
The results should look something like this:

2. Compile an SQL statement to collect statistics on hot tables:
select
--Calculate statistics by table name
input_table
,count(distinct inst_id) table_read_num
from
(
select
--Remove the brackets ([]) at the beginning and end of the input_tables field
trans_array(1,",",inst_id,replace(replace(input_tables,"[",""),"]","")) as (inst_id,input_table)
from information_schema.tasks_history
where ds='20190902'
) t
group by input_table
order by table_read_num desc
limit 1000;
The results should look something like this:

3. Compile an SQL statement to collect statistics on cold tables:
Associate and sort by using the total number of jobs in the input_tables in tables and tasks_history. This allows you to count the number of times each table is used within the specified time window and list the tables in ascending order.
select
t1.table_schema,
t1.table_name,
--Join two tables
if(t2.table_read_num is null,0,table_read_num) as table_read_num
FROM information_schema.tables t1
left join(
select
--Remove the quotation marks ("") before and after the table name
regexp_replace(t.input_table,""","") as input_table
,count(distinct t.inst_id) table_read_num
from
(
select
--Remove the brackets ([]) at the beginning and end of the input_tables field
trans_array(1,",",inst_id,replace(replace(input_tables,"[",""),"]","")) as (inst_id,input_table)
from information_schema.tasks_history
where ds='20190902' )t
group by input_table
)t2
--Match by using join conditions
on concat('your_project_name.',t1.table_name)=t2.input_table
order by table_read_num desc
limit 1000;
In the SQL statement, your_project_name. is the table name prefix. You need to modify the name based on your actual data. The results should look something like this:


Now, all the tables are sorted by the number of times they have been used. This means you can obtain the sorting information based on the number of times each table is used.

137 posts | 20 followers
FollowAlibaba EMR - February 20, 2023
Alibaba Cloud MaxCompute - March 2, 2020
Alibaba Cloud New Products - January 19, 2021
Alibaba Cloud MaxCompute - December 22, 2021
ApsaraDB - December 17, 2024
ApsaraDB - October 29, 2024

137 posts | 20 followers
Follow Big Data Consulting for Data Technology Solution
Alibaba Cloud provides big data consulting services to help enterprises leverage advanced data technology.
Learn More MaxCompute
Conduct large-scale data warehousing with MaxCompute
Learn More Big Data Consulting Services for Retail Solution
Alibaba Cloud experts provide retailers with a lightweight and customized big data consulting service to help you assess your big data maturity and plan your big data journey.
Learn More ApsaraDB for HBase
ApsaraDB for HBase is a NoSQL database engine that is highly optimized and 100% compatible with the community edition of HBase.
Learn MoreMore Posts by Alibaba Cloud MaxCompute