Join us at the Alibaba Cloud ACtivate Online Conference on March 5-6 to challenge assumptions, exchange ideas, and explore what is possible through digital transformation.
By Garvin Li
Note: Data in this article is hypothetical and is created for experimental usage only.
Graph algorithms are typically applied to relationship-based business. Unlike structured data, graph algorithms organize data into relationship graphs with nodes connected to each other by edges. Alibaba Cloud Machine Learning Platform for AI (PAI) provides several graph algorithm components, including K-Core, maximum connected subgraph, and label propagation classification.
This section uses graph algorithm components in the Alibaba Cloud Machine Learning Platform for AI to create an experiment as follows:
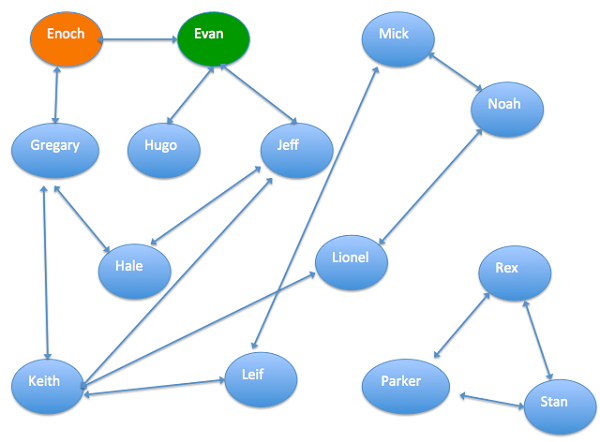
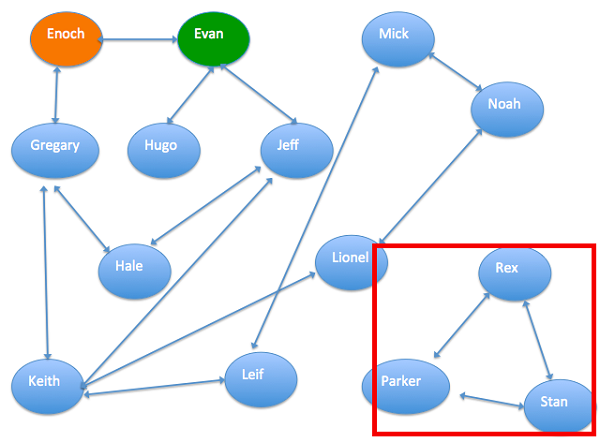
The figure above shows the relationships among a group of people. The arrows in the figure represent the relationships between these people, for example, coworkers or relatives. Enoch is a trusted customer and Evan is a fraudulent customer. Graph algorithms are used to calculate the credit score of other people in order to learn the probability of a person being a fraudulent customer. The results can be used by corresponding institutions for risk control.
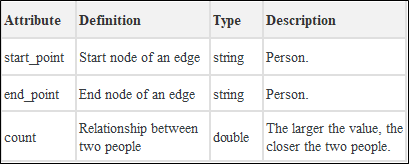
The following table shows the attributes in the dataset.
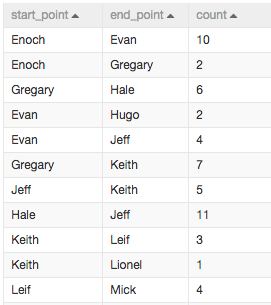
The following figure shows the dataset.
The experiment flowchart is as follows:
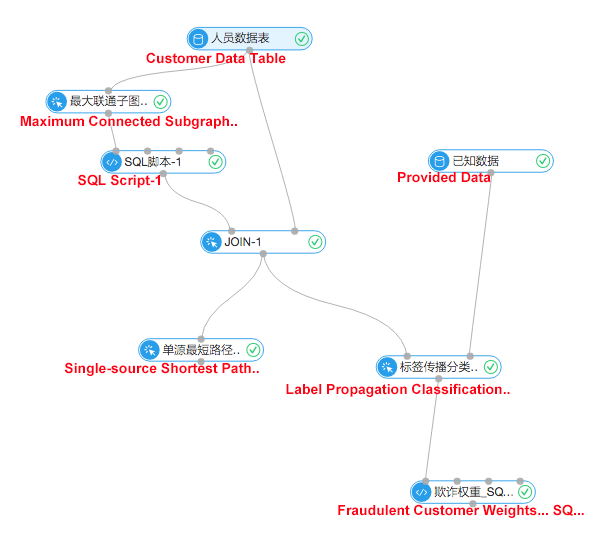
Maximum connected subgraph: the input data in graph algorithms is represented by a map of relationships. The maximum connected subgraph is used to find the cluster that contains the most interconnections, in order to remove people that do not contribute from risk control.
This experiment uses the maximum connected subgraph component to divide the people into two groups and assign each group a group_id. You can use the SQL script component and JOIN component to remove this group from the subgraph.
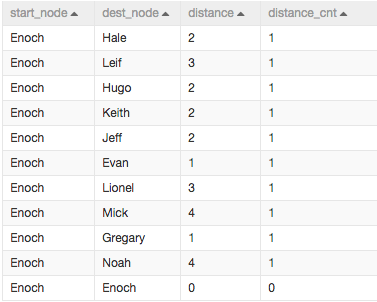
The single-source shortest path component allows you to explore the close and distant relationships. The distance field indicates how many people Enoch needs to contact the target, as shown in the following figure:
Label propagation classification is a semi-supervised classification algorithm. It uses the existing label information of the nodes to predict the label information of the unlabeled nodes. Based on the similarity of nodes, label propagation classification propagates each label to other nodes.
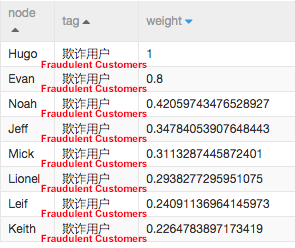
To use the label propagation classification component, make sure that you have a connected graph containing all entities and the data for labelling. This experiment uses the read MaxCompute table component to import the labeled data, as shown in the following figure. The weight field indicates the probability of a person being a fraudulent customer.

By using SQL filtering, the final results show the fraud committing probabilities for all people. The larger the value is, the larger the probability that a person may be a fraudulent customer.
Alibaba Cloud Machine Learning Platform for AI: News Classification Case
Alibaba Cloud Machine Learning Platform for AI: Image Classification by Caffe
Alibaba Clouder - August 12, 2020
Alipay Technology - December 26, 2019
Ellen Cibula - January 18, 2023
Merchine Learning PAI - October 30, 2020
GarvinLi - November 7, 2018
Alibaba Clouder - November 11, 2020
 Big Data Consulting for Data Technology Solution
Alibaba Cloud provides big data consulting services to help enterprises leverage advanced data technology.
Learn More MaxCompute
Conduct large-scale data warehousing with MaxCompute
Learn More Big Data Consulting Services for Retail Solution
Alibaba Cloud experts provide retailers with a lightweight and customized big data consulting service to help you assess your big data maturity and plan your big data journey.
Learn More ApsaraDB for HBase
ApsaraDB for HBase is a NoSQL database engine that is highly optimized and 100% compatible with the community edition of HBase.
Learn MoreMore Posts by GarvinLi