By Garvin Li
In today's top trending topics, you would most probably see air pollution in the list. In cities such as Beijing, it is not uncommon to see people wearing masks while walking in the streets. The haze not only affects people's travel and entertainment, but also causes significant harm to people's health. By analyzing the real weather data of Beijing over the past year, this article discovers that nitrogen dioxide is the most relevant pollutant with haze (i.e. PM 2.5), thus revealing the culprit for haze.
In this article, we will be creating a haze prediction model using the template from Alibaba Cloud Machine Learning Platform.

Data source: Beijing weather index for the whole year of 2016.
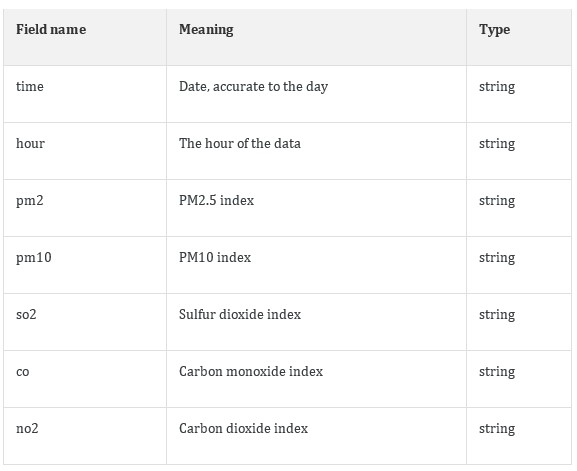
The air index data for each hour since January 1, 2016 is collected. The detailed fields are as follows.
The experiment process is as follows.
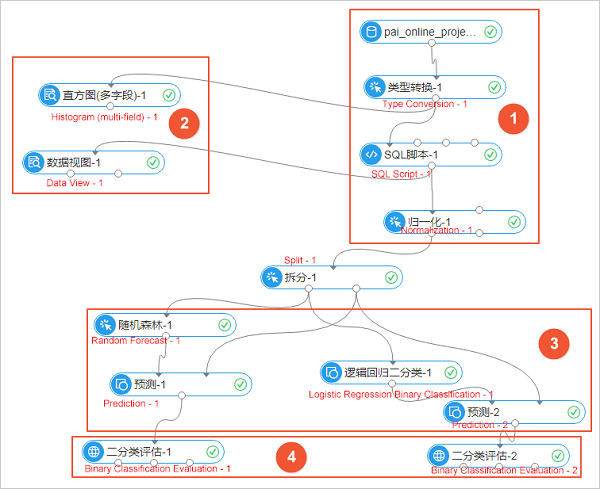
The entire experiment is divided into four parts:
The details are as follows.
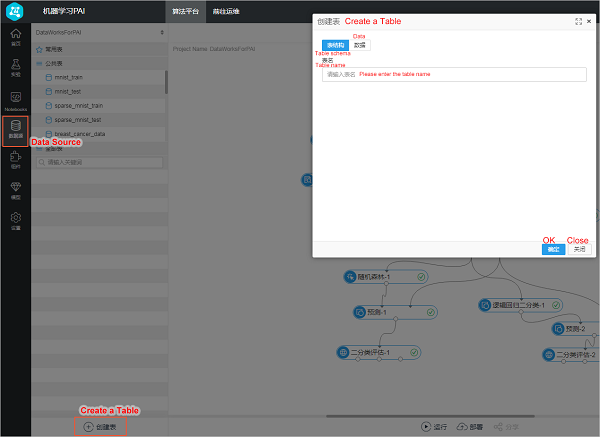
Click Data Source and select Create Table. The uploaded data supports .txt and .csv files.
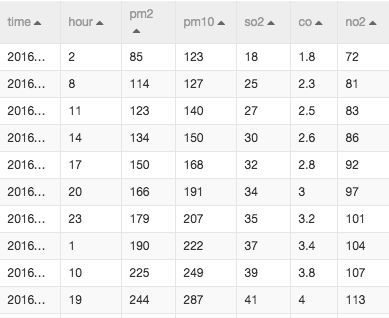
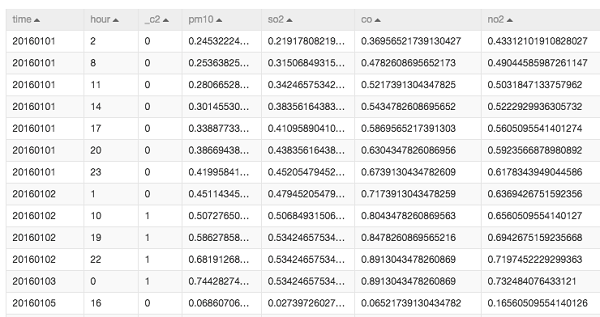
After the data is imported, right click the component and select View Data. The result is as follows.
Convert string-type data to a double type through the "Type Conversion" component.
Convert the target column to a boolean type of 0 and 1 through the "SQL Script" component. In this experiment, "pm2" is listed as the target column. Values above 200 are marked as 1 for heavy haze, and values below 200 are marked as 0. The SQL statement is as follows.
select time,hour,(case when pm2>200 then 1 else 0 end),pm10,so2,co,no2 from ${t1};The main purpose of normalization is to remove the dimension, that is, to unify the units of pollutants with different indexes.
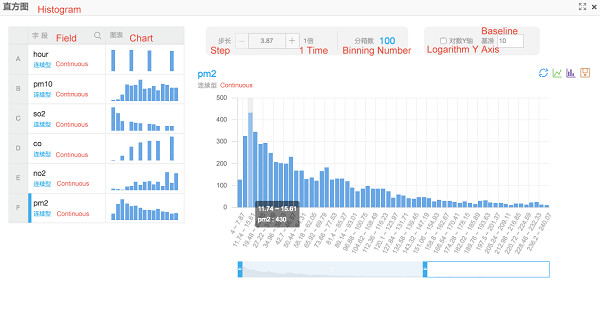
The Histogram component allows you to visually view the distribution of different data in different ranges.
This experiment visually presents the distribution of data in each field. As shown in the figure below, taking PM2.5 as an example, the most significant range of values is 11.74 to 15.61, with a total of 430 records.
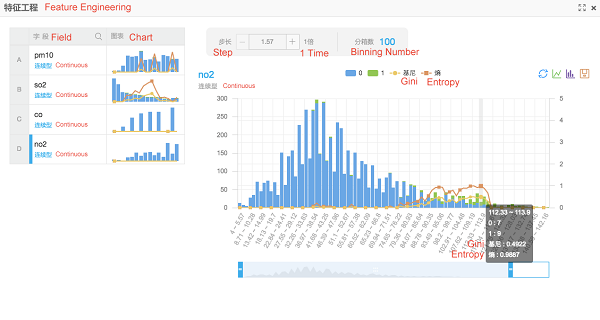
The data view allows you to see the impact of different ranges of different indexes on the results.
As shown in the following figure, taking NO2 as an example, 7 targets with a target column of 0 are generated in the range 112.33 to 113.9, and 9 targets with a target column of 1 are generated. That is, when NO2 is in the range of 112.33 to 113.9, there is a very high chance of severe haze. The entropy and Gini coefficient indicate the impact of this feature range on the target value (the impact on the aspect of information), and the larger the value, the greater the impact.
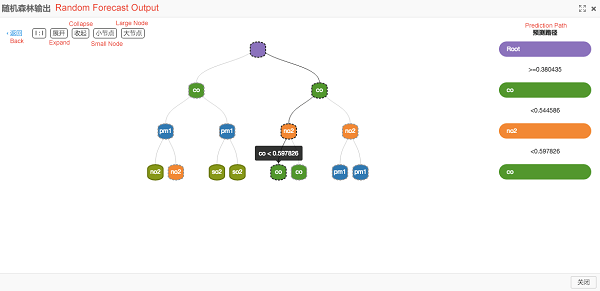
In this case, two different algorithms are used to predict and analyze the results: random forest and logistic regression.
The data set is split, in which 80% is used for model training, and 20% is used for prediction. Click Model on the left side of the console, select Saved Models. Right click the model, select View Model, then the tree model of the random forest is visually shown as follows.
The prediction result is as follows:
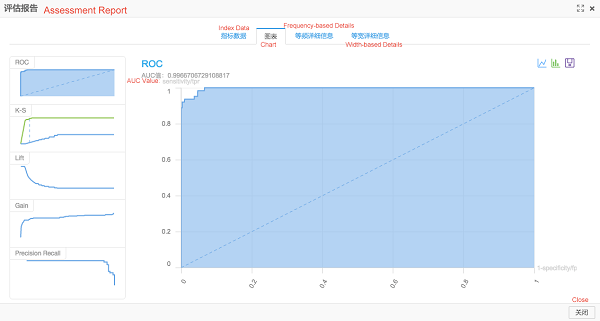
The AUC in the above figure is 0.99, which indicates that with the weather index data used in this document, it can predict whether there will be haze or not, and the accuracy rate can reach more than 90%.
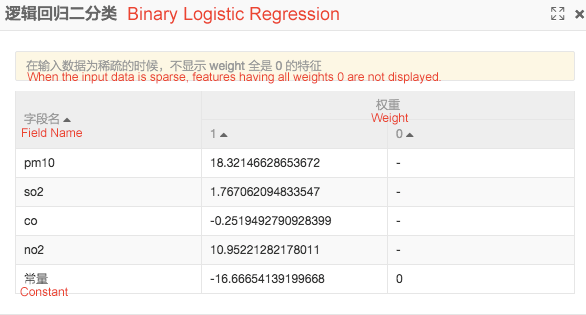
A linear model can be obtained by training with the logistic regression algorithm, as shown in the following figure.
The prediction result is as follows:
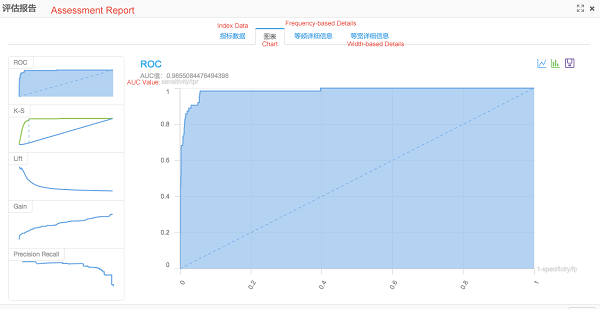
The AUC in the above figure is 0.98, which is slightly lower than the result computed through the random forest algorithm. When excluding the impact of the parameter adjustment on the results, it indicates that the training effect of the random forest is be better for this data set.
Based on the model and prediction results above, the air index having the greatest impact on PM2.5 is analyzed.
The logistic regression model generated is shown as the following figure:
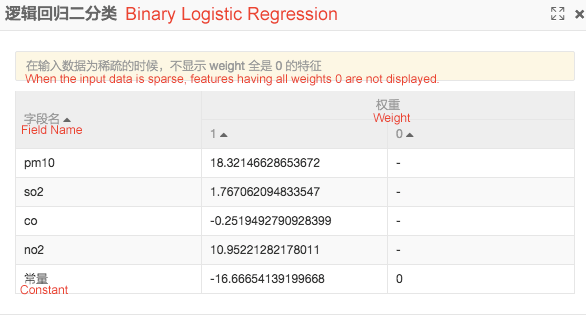
The larger the model coefficient of the logistic regression algorithm after normalized computing, the greater the impact on the result. The coefficient symbol is positive for positive correlation and negative for negative correlation. In the above figure, PM10 and NO2 have the largest positive coefficients.
NO2 emission is often reported as one the main factors that creates PM2.5 pollutants. Our results are consistent with findings from the scientific community, which also indicate that NO2 is mainly from automobile exhaust emission.
To learn more about Alibaba Cloud Machine Learning Platform for Artificial Intelligence (PAI), visit www.alibabacloud.com/product/machine-learning
Alibaba Cloud Machine Learning Platform for AI: Offline Scheduling Instructions
Alibaba Cloud Machine Learning Platform for AI: News Classification Case
Alibaba Cloud Project Hub - November 16, 2021
Alibaba Cloud Community - August 22, 2024
Alibaba Cloud Community - January 11, 2023
Alibaba Cloud Community - July 25, 2022
Amuthan Nallathambi - May 12, 2024
Maya Enda - June 16, 2023
 Big Data Consulting for Data Technology Solution
Alibaba Cloud provides big data consulting services to help enterprises leverage advanced data technology.
Learn More Big Data Consulting Services for Retail Solution
Alibaba Cloud experts provide retailers with a lightweight and customized big data consulting service to help you assess your big data maturity and plan your big data journey.
Learn More Platform For AI
A platform that provides enterprise-level data modeling services based on machine learning algorithms to quickly meet your needs for data-driven operations.
Learn More ApsaraDB for HBase
ApsaraDB for HBase is a NoSQL database engine that is highly optimized and 100% compatible with the community edition of HBase.
Learn MoreMore Posts by GarvinLi