可觀測監控 Prometheus 版支援使用CRD ServiceMonitor的方式來滿足您自訂服務發現的採集需求。通過使用ServiceMonitor,您可以自行定義Pod發現的Namespace範圍以及通過matchLabel來選擇監聽的Service。本文將基於SpringBoot架構示範如何通過ServiceMonitor建立服務發現。
Demo
您可以通過下載Demo工程,同步體驗通過ServiceMonitor建立服務發現的完整過程。
步驟一:建立基礎代碼依賴
建立一個Maven應用,並在pom.xml檔案中添加以下依賴。
<dependencies> <dependency> <groupId>org.springframework.boot</groupId> <artifactId>spring-boot-starter-actuator</artifactId> </dependency> <dependency> <groupId>org.springframework.boot</groupId> <artifactId>spring-boot-starter-web</artifactId> </dependency> <dependency> <groupId>io.micrometer</groupId> <artifactId>micrometer-registry-prometheus</artifactId> <version>1.6.6</version> </dependency> <dependency> <groupId>org.springframework.boot</groupId> <artifactId>spring-boot-configuration-processor</artifactId> <optional>true</optional> </dependency> <dependency> <groupId>org.projectlombok</groupId> <artifactId>lombok</artifactId> <optional>true</optional> </dependency> <dependency> <groupId>org.springframework.boot</groupId> <artifactId>spring-boot-starter-test</artifactId> <scope>test</scope> </dependency> </dependencies>在專案的src/resources/applications.properties檔案中添加以下配置。
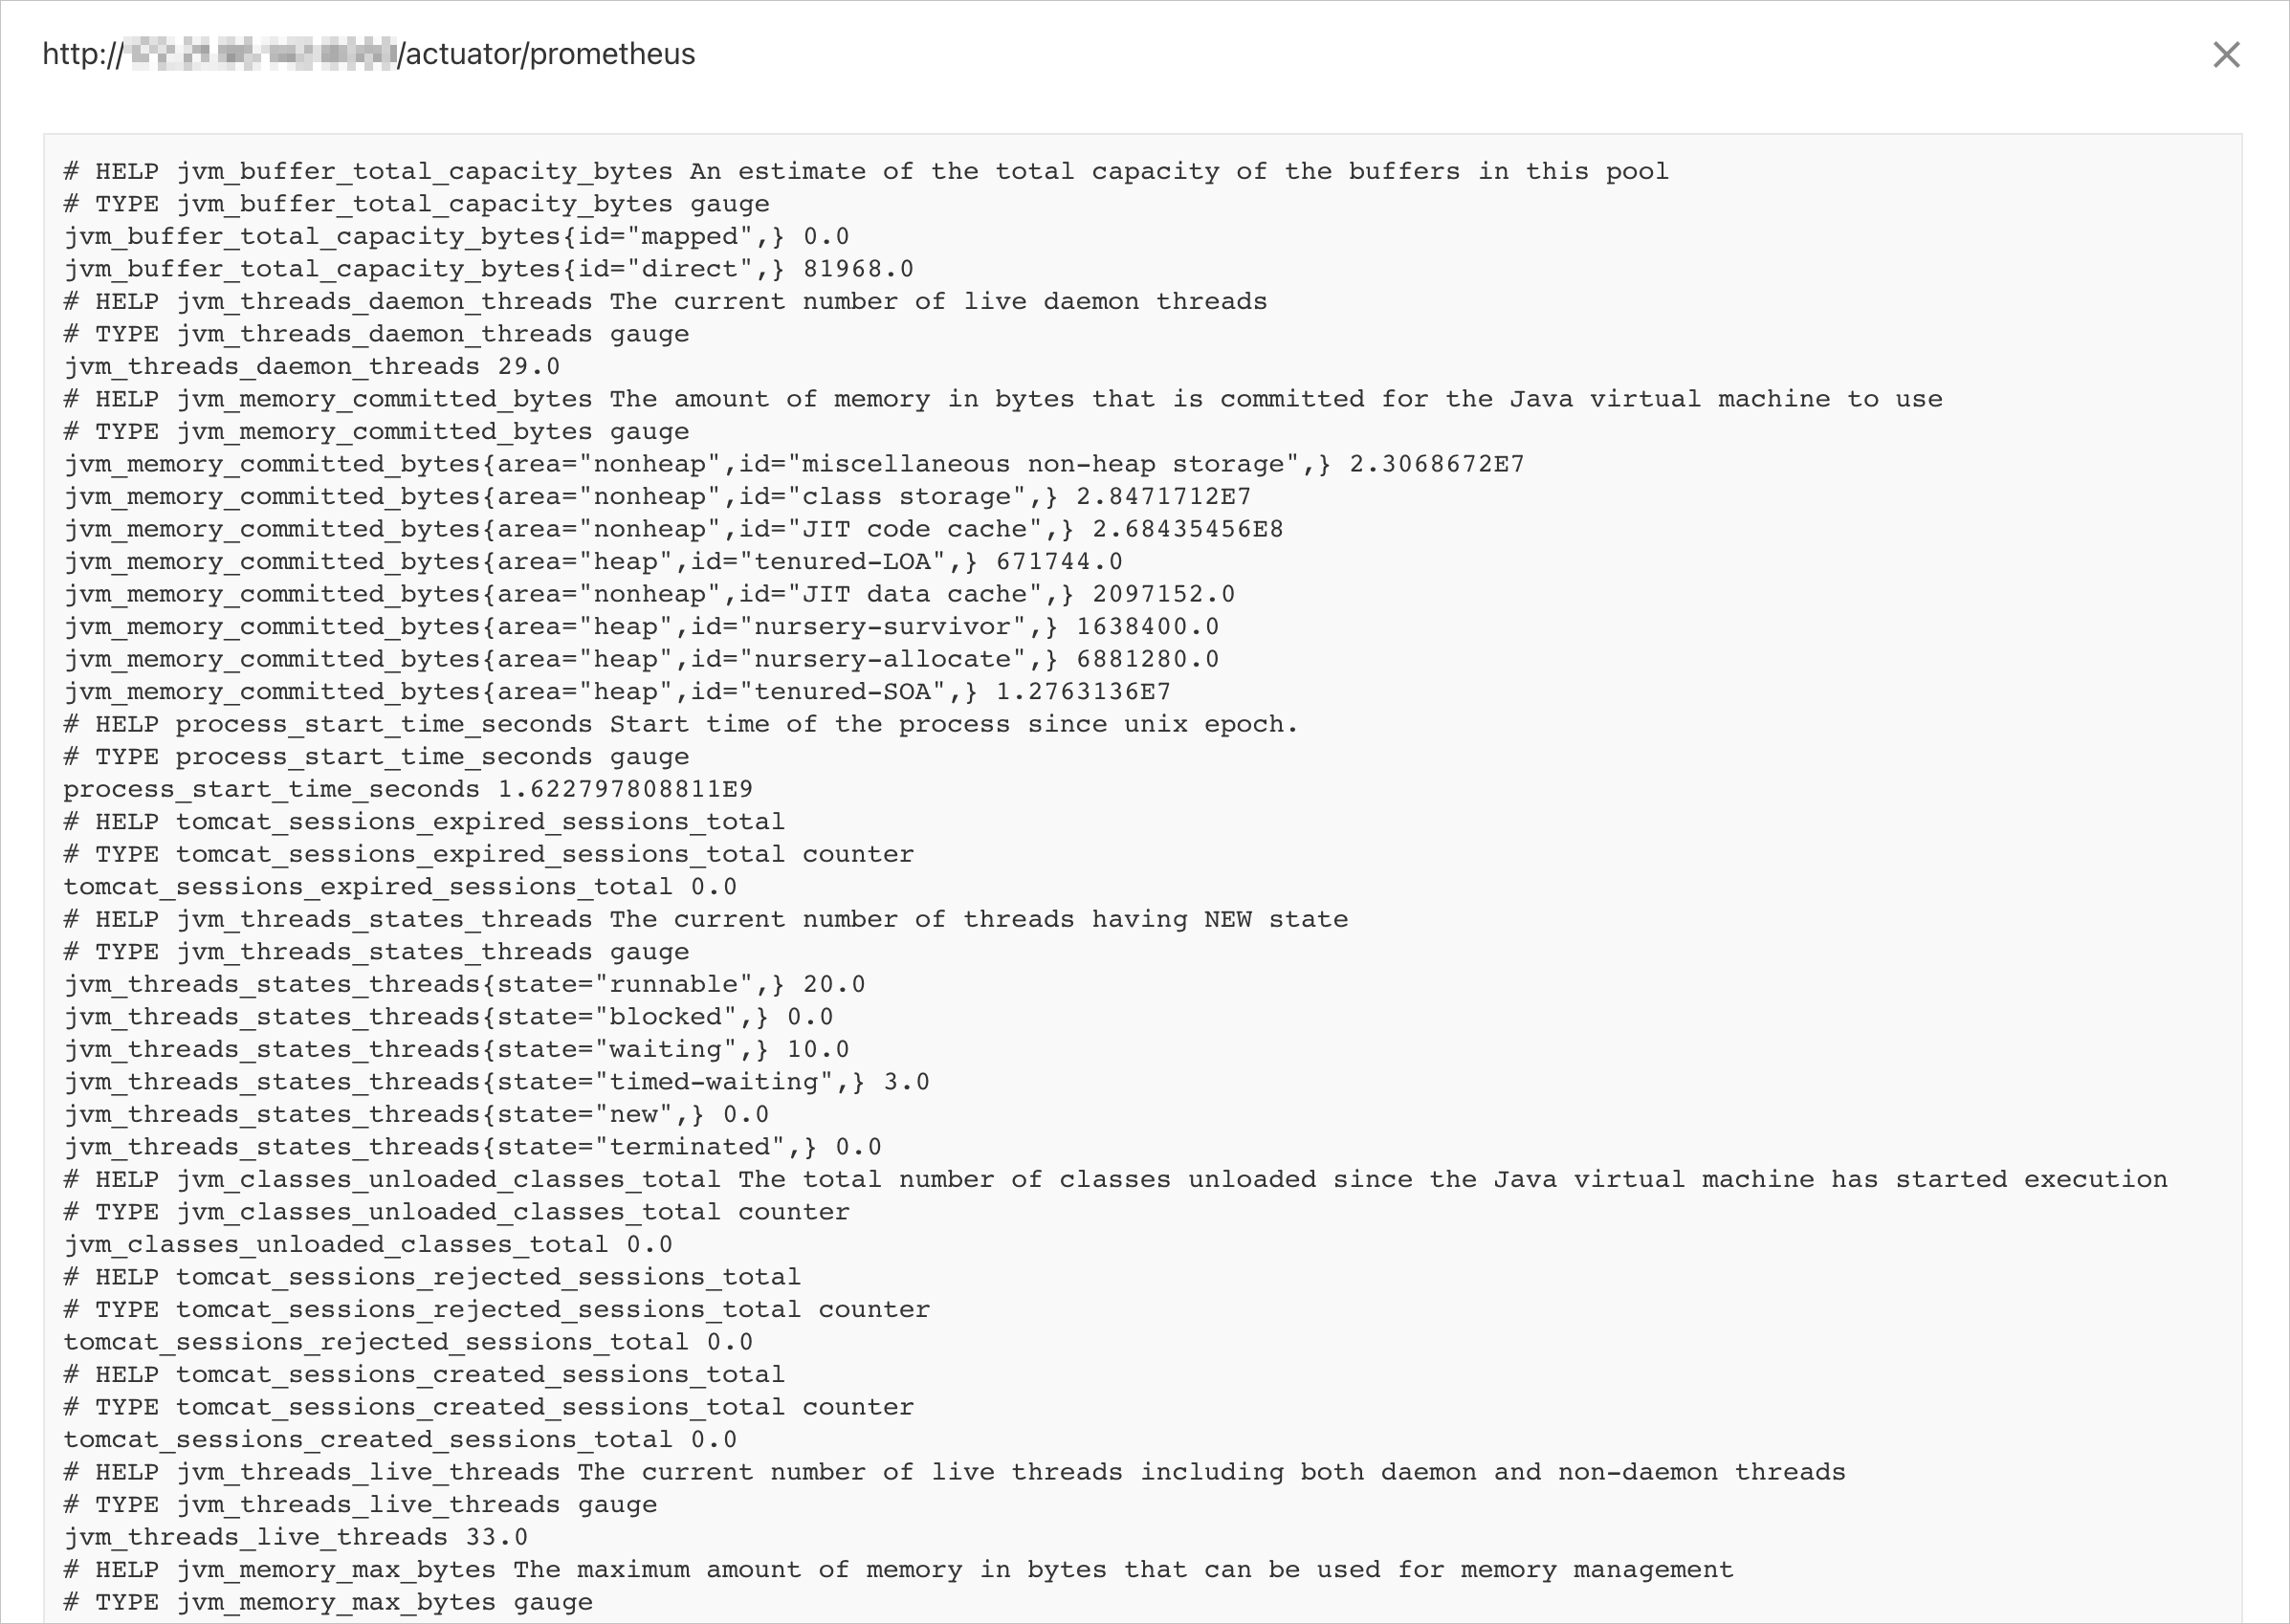
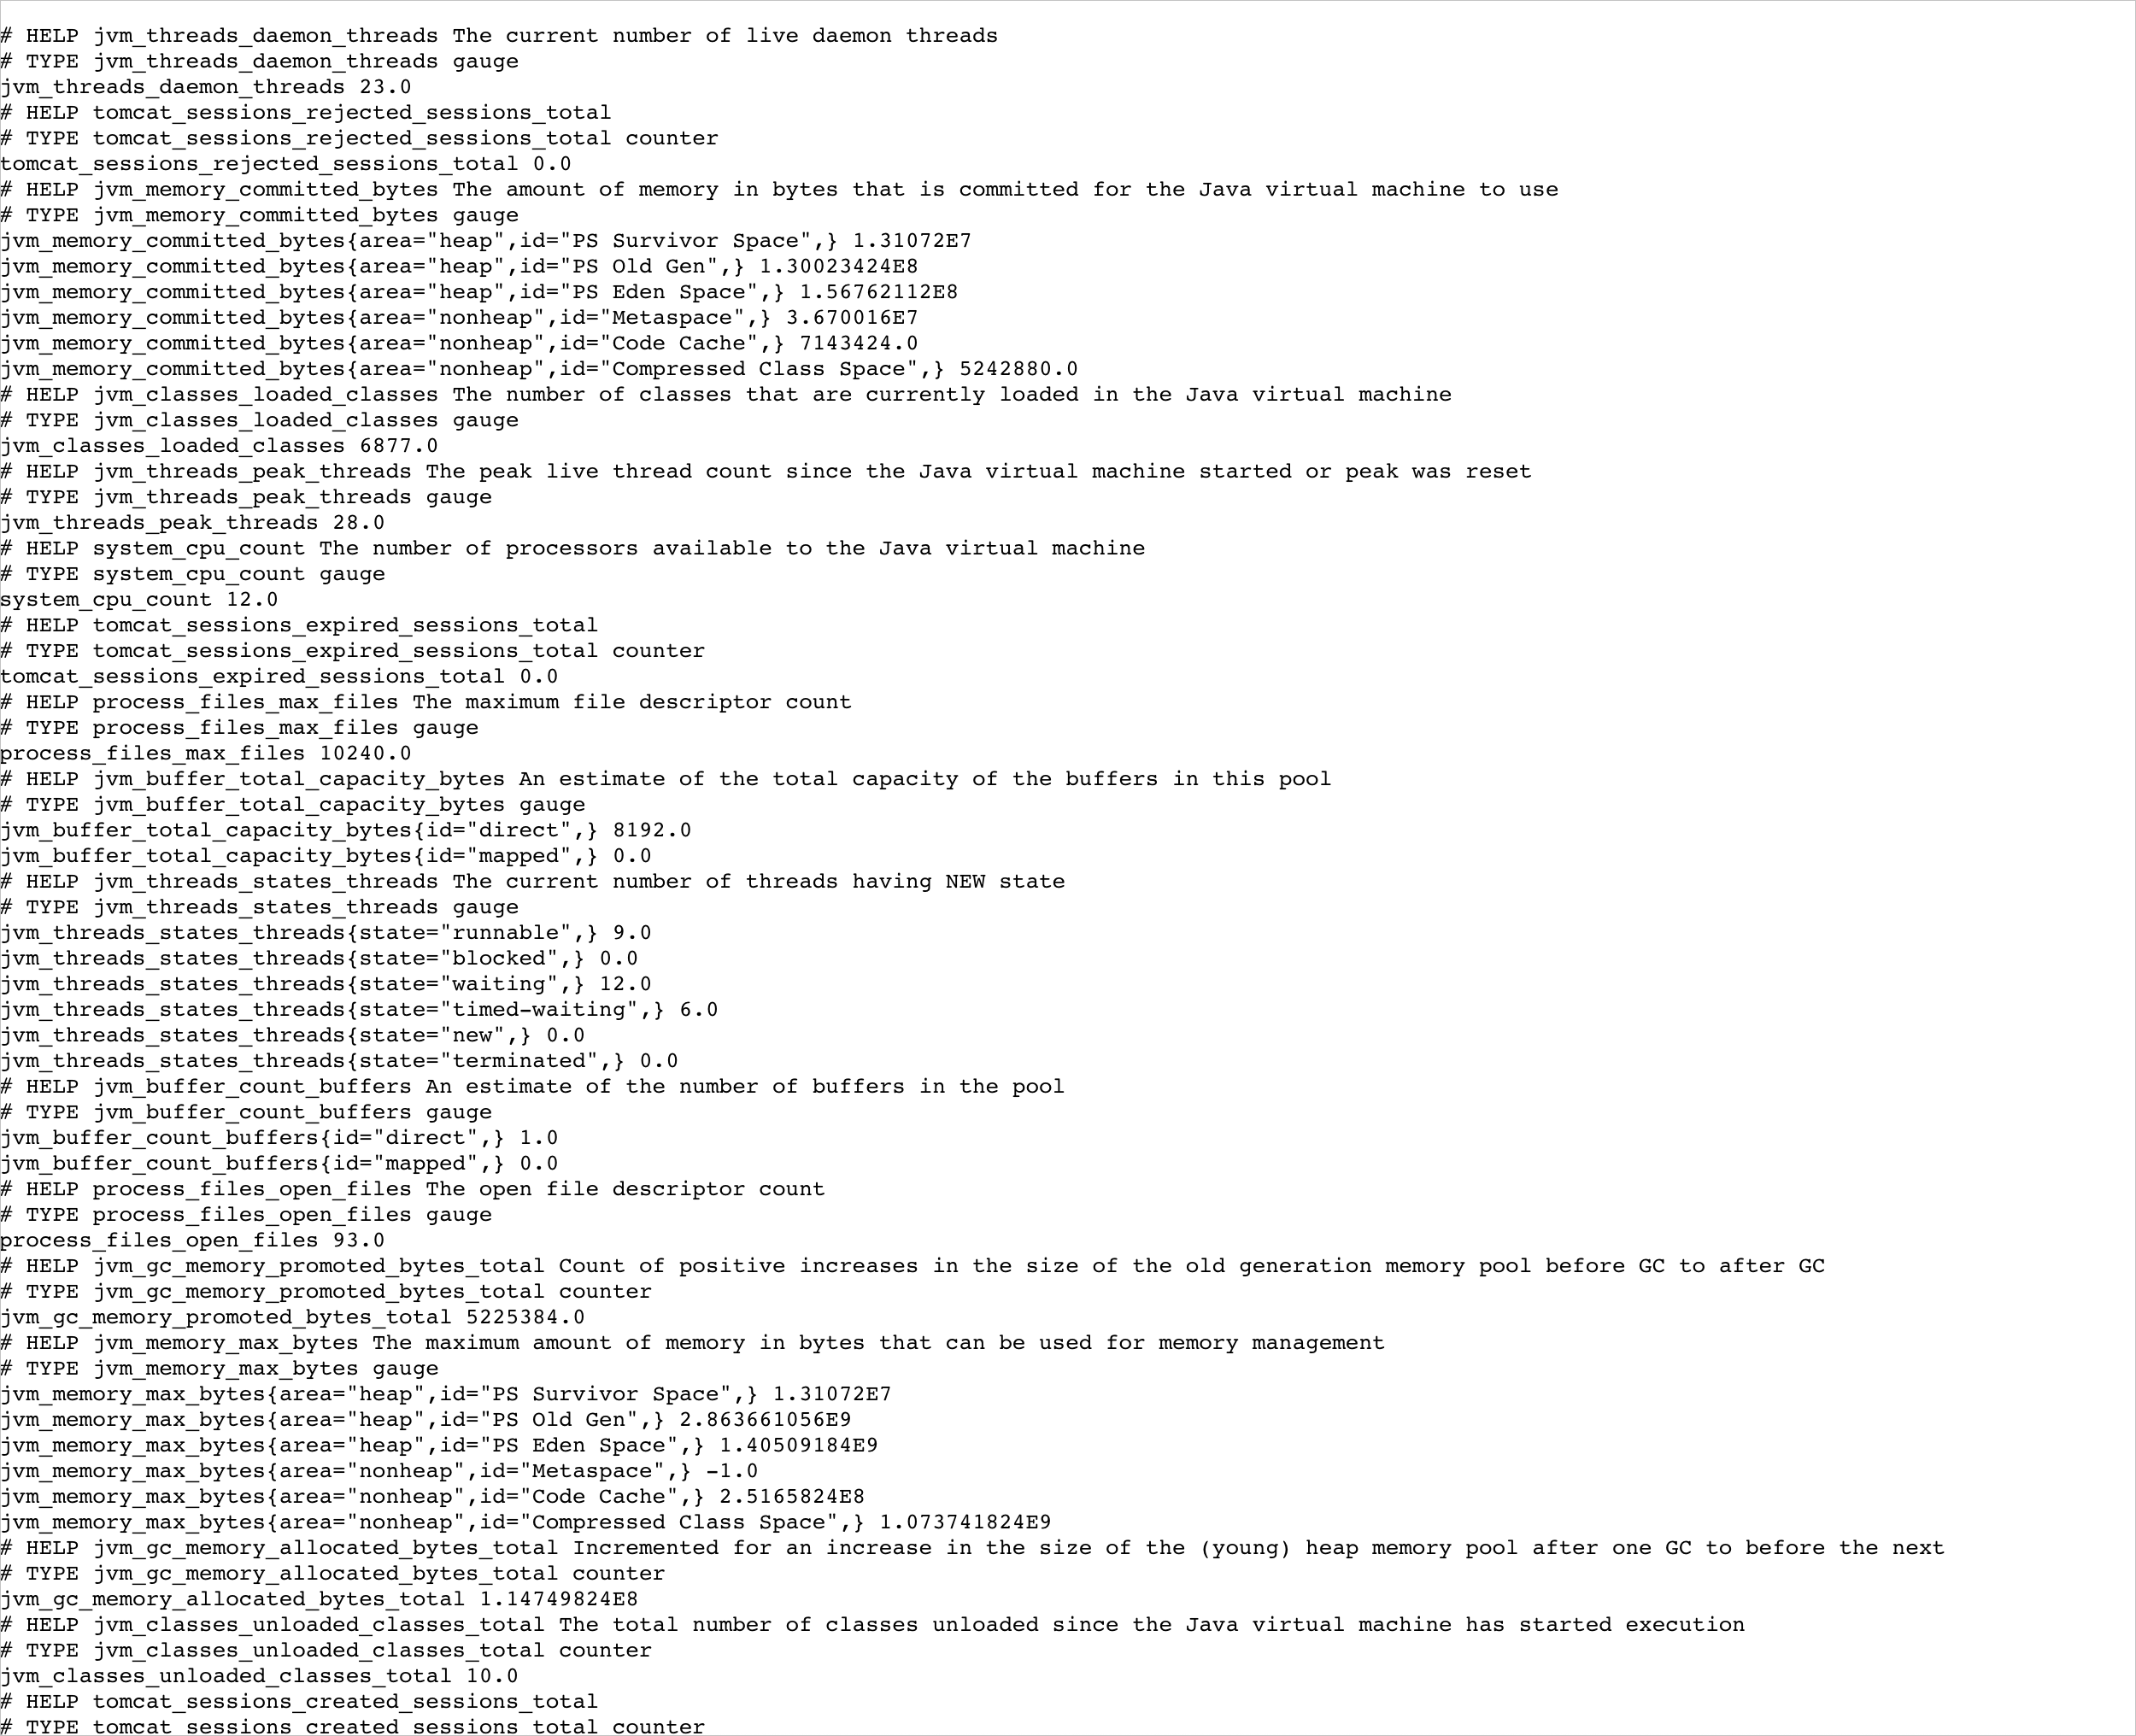
management.endpoints.web.exposure.include=prometheus啟動專案,通過瀏覽器訪問
http://{host}:{port}/actuator/prometheus。擷取到對應的JVM監控,返回樣本如下:
步驟二:部署Kubernetes叢集
構建一個鏡像,並將構建鏡像的Dockerfile檔案上傳至鏡像倉庫。有關鏡像的更多資訊,請參見繫結來源代碼託管平台。
參考以下內容建立Deployment。
apiVersion: apps/v1
kind: Deployment
metadata:
  name: micrometer-prometheus
  namespace: default
  labels:
    app: demo-prometheus
spec:
  replicas: 3
  selector:
    matchLabels:
      app: demo-prometheus
  template:
    metadata:
      labels:
        app: demo-prometheus
    spec:
      containers:
        - name: micrometer-prometheus
          image: manjusakalza/micrometer-prometheus:latest
          ports:
            - containerPort: 8080
參考以下內容建立Service。
apiVersion: v1
kind: Service
metadata:
  name: prometheus-metrics-demo
  namespace: default
  labels:
    micrometer-prometheus-discovery: 'true'
spec:
  selector:
    app: demo-prometheus
  ports:
    - protocol: TCP
      port: 8080
      targetPort: 8080
      name: metrics
步驟三:建立ServiceMonitor
將寫好的YAML檔案儲存至本地,並執行
kubectl apply -f {YAML檔案所在的路徑}使YAML檔案生效。
ServiceMonitor的YAML檔案樣本如下:
apiVersion: monitoring.coreos.com/v1
kind: ServiceMonitor
metadata:
  name: micrometer-demo
  namespace: default
spec:
  endpoints:
    - interval: 15s
      path: /actuator/prometheus
      port: metrics    #注意:這裡port配置的是連接埠名,並非連接埠號碼。
  namespaceSelector:
    any: true
  selector:
    matchLabels:
      micrometer-prometheus-discovery: 'true'
在這段YAML檔案中,各程式碼片段的含義如下:
metadata下的name和namespace將指定ServiceMonitor所需的一些關鍵元資訊。spec的endpoints為服務端點,代表Prometheus所需的採集Metrics的地址。endpoints為一個數組,同時可以建立多個endpoints。每個endpoints包含三個欄位,每個欄位的含義如下:interval:指定Prometheus對當前endpoints採集的周期。單位為秒,在本次樣本中設定為15s。path:指定Prometheus的採集路徑。在本次樣本中,指定為/actuator/prometheus。port:指定採集資料需要通過的連接埠,設定的連接埠為步驟二建立Service時連接埠所設定的name。在本次樣本中,設定為metrics。重要這裡port配置的是連接埠名,並非連接埠號碼。
spec的namespaceSelector為需要發現的Service的範圍。namespaceSelector包含兩個互斥欄位,欄位的含義如下:any:有且僅有一個值true,當該欄位被設定時,將監聽所有符合Selector過濾條件的Service的變動。matchNames:數組值,指定需要監聽的namespace的範圍。例如,只想監聽default和arms-prom兩個命名空間中的Service,那麼matchNames設定如下:namespaceSelector: matchNames: - default - arms-prom
spec的selector用於選擇Service。在本次樣本所使用的Service有micrometer-prometheus-discovery: 'true' Label,所以
selector設定如下:selector: matchLabels: micrometer-prometheus-discovery: 'true'
如需使用 basic auth 功能,請參考如下YAML檔案。
apiVersion: monitoring.coreos.com/v1
kind: ServiceMonitor
metadata:
  name: cloud-open-api-monitor     #  設定 ServiceMonitor 唯一的名字
  namespace: default   #  設定當前 ServiceMonitor 所在的命名空間
spec:
  endpoints:
  - interval: 30s
    # 指定 Prometheus 對當前 endpoints 採集的周期
    port: tcp-8080
    # 填寫 Prometheus exporter代碼中暴露的地址
    path: /api/actuator/prometheus
    basicAuth:
      password:
        name: basic-auth
        key: <password>
      username:
        name: basic-auth
        key: <userName>
    scheme: http
  namespaceSelector:
    any: true
  selector:
    matchLabels:
      # 匹配具有如下標籤的 Service
      edas.oam.acname: cloud-open-api
如果使用 basic auth 功能時沒有許可權, 需要在叢集裡添加一個有對應許可權的 ClusterRole,然後將此 ClusterRole 通過 ClusterRoleBinding 綁定到 arms-prom 命名空間下名字為 arms-prom-operator 的 ServiceAccount 上,這樣可以讓 Prometheus Agent 具有對應許可權。
ClusterRole YAML 檔案
apiVersion: rbac.authorization.k8s.io/v1
kind: ClusterRole
metadata:
  name: prometheus-agent-role
  labels:
    app: prometheus-agent
rules:
  - apiGroups: [""]
    resources: ["pods", "services", "endpoints", "nodes"]
    verbs: ["get", "list", "watch"]  #根據具體需求調整
  - apiGroups: ["monitoring.coreos.com"]  # 根據需要調整apiGroups
    resources: ["*"]
    verbs: ["get", "list", "watch", "create", "update", "delete"]  # 根據需要調整
ClusterRoleBinding YAML 檔案
apiVersion: rbac.authorization.k8s.io/v1
kind: ClusterRoleBinding
metadata:
  name: prometheus-agent-binding
subjects:
  - kind: ServiceAccount
    name: arms-prom-operator  # 服務賬戶名稱
    namespace: arms-prom      # 服務賬戶所在的命名空間
roleRef:
  kind: ClusterRole
  name: prometheus-agent-role  # 上面定義的 ClusterRole 名稱
  apiGroup: rbac.authorization.k8s.io
步驟四:驗證ServiceMonitor
通過以下操作,驗證Prometheus是否成功進行服務發現。
登入Prometheus控制台,在左側導覽列單擊接入管理。
在已接入環境頁簽,查看容器環境列表,單擊目標容器環境名稱。
單擊自監控頁簽,然後單擊Targets頁簽。
在Targets頁簽,查看是否存在名稱為{namespace}/{serviceMonitorName}/x的Target。

單擊{namespace}/{serviceMonitorName}/x所在行展開Target,然後單擊Endpoint連結。
驗證Metrics是否正常。