本文為服務商介紹計算巢全託管服務-ACK部署方案中業務監控和警示的配置方案。
ACK部署方案中的託管版單租服務(每個使用者獨享叢集)和託管版多租服務(多個使用者共用叢集)接入Prometheus的解決方案一致,都是通過配置ACK叢集中的Prometheus的租戶指標轉寄能力,實現使用者側和服務商側均能看到服務執行個體的監控指標。(支援人員DingTalk群:31045016300)
工作原理
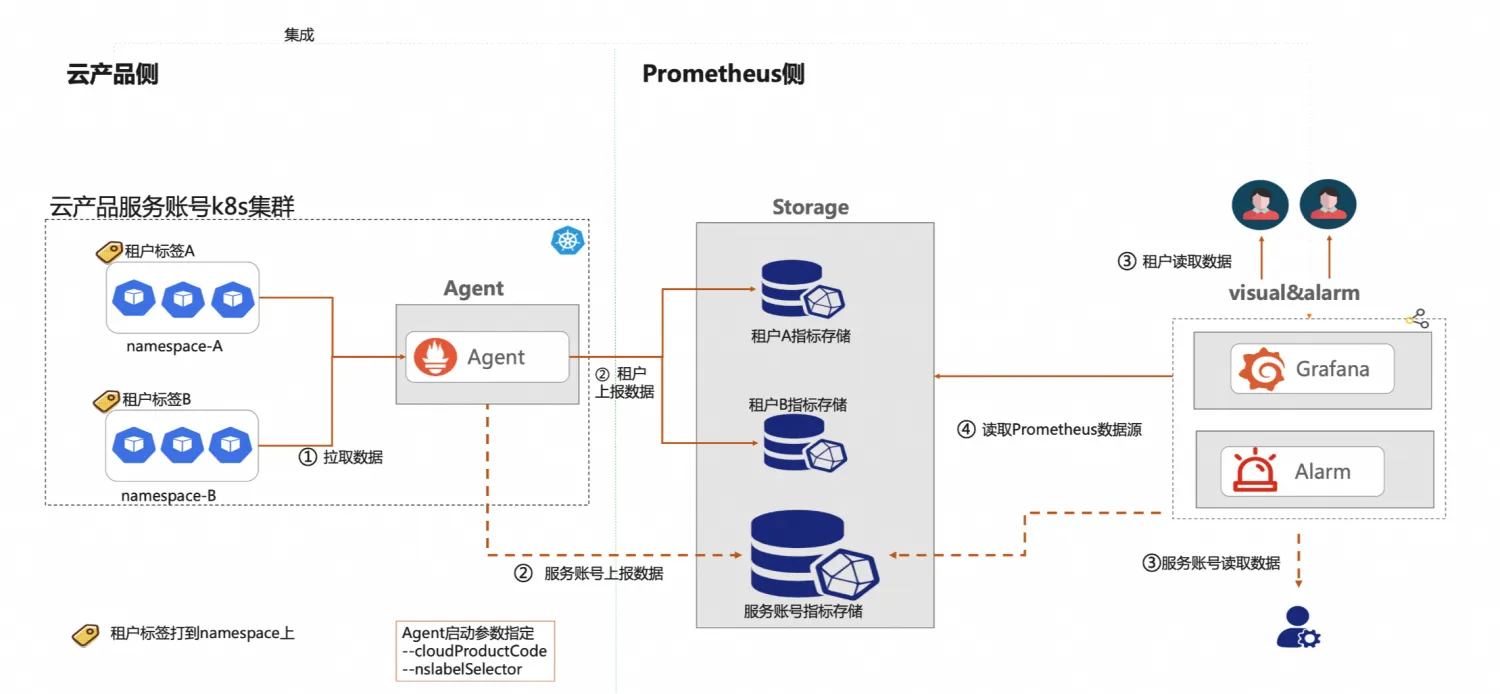
計算巢採用了阿里雲ARMS提供的Prometheus多租監控的方案。
阿里雲Prometheus服務內建了多租能力支援,在採集側agent端會根據workload資源(支援Pod/Namespace層級)上特定的租戶標籤來區分租戶指標,不同租戶的指標會分發到租戶對應的雲端服務執行個體中。
儲存側天然支援多租隔離特徵。接入的服務商需要在相應的租戶workload資源上打上規定的“租戶標籤”即可。
計算巢的全託管多租服務執行個體是以namespace來隔離各個租戶的資源的,當對Namespace打上相應的租戶標籤,後端程式可實現租戶的指標自動轉寄到租戶對應的雲端服務執行個體中。
另外通過設定服務商的RemoteWrite,可以把租戶的監控資料再投遞一份到服務商的帳號下,即可實現服務商查看所有租戶的監控資料,租戶僅可查看自己的監控資料。
操作步驟
步驟一:配置ACK叢集的Prometheus組件
Prometheus本身不支援指標轉寄功能,阿里雲託管的Prometheus進行額外的配置後,才能將與使用者應用相關的監控指標轉寄給具體的使用者。
託管版單租情境
在託管版單租情境中,計算巢將此配置過程封裝為ROS模板的一個模組,您可直接在ROS模板中使用。
在建立服務時將此模板內容整合至ROS模板中,模板的樣本及說明如下所示。
模板樣本:
ClusterArmsConfig:
  Type: 'MODULE::ACS::ComputeNest::AckArmsConfig'
  Version: v1
  Properties:
    ClusterId:
      Fn::If:
        - Condition: CreateACKCondition
        - Ref: ManagedKubernetesCluster
        - Ref: ClusterId
    WhetherSupplierNeedMetric: true
    AccessKeyID: LTAI****************
    AccessKeySecret: yourAccessKeySecret
    SupplierAliuid: 15634578xxxxxx
參數說明:
WhetherSupplierNeedMetric:表示服務商是否需要收到租戶的資料,如果服務商也需要收到租戶的指標,則需要設定為true。如果WhetherSupplierNeedMetric為true,則需要配置AccessKeyID、AccessKeySecret和SupplierAliuid這三個屬性,SupplierAliuid為服務商的阿里uid,AccessKeyID和AccessKeySecret都為服務商的AK。重要您可以為AK設定如下許可權,僅允許調用
arms:GetPrometheusApiToken介面,用於監控情境下的資料擷取或查詢。此配置在滿足監控需求的同時,遵循最小許可權原則,有效降低安全風險。{ "Version": "1", "Statement": [ { "Effect": "Allow", "Action": [ "arms:GetPrometheusApiToken" ], "Resource": "*" } ] }SyncServiceMonitor: 是否自動同步叢集中的ServiceMonitor。您可通過設定此選項來選擇監聽的Service,具體操作,請參見通過ServiceMonitor建立服務發現。SyncPodMonitor:是否自動同步叢集中的PodMonitor。
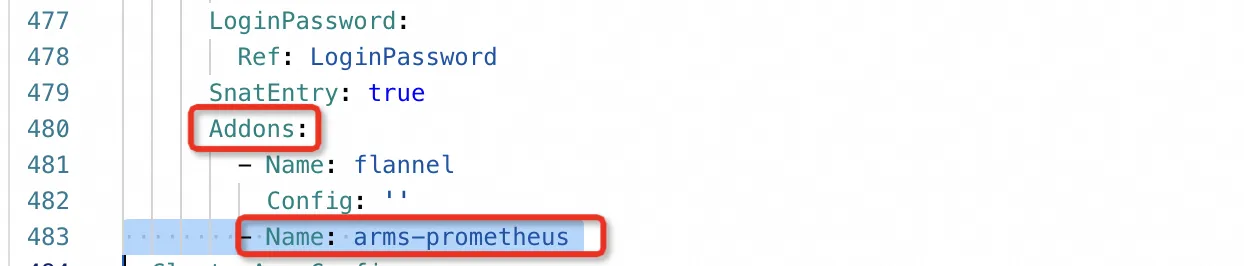
(可選)如果是通過ROS模板建立的ACK叢集,需要在ROS模板的ACK資源中添加Addons參數,如下圖所示。
託管版多租情境
在託管版多租情境中,計算巢提供的服務ACK全託管多租情境-容器基礎資源部署,您可以通過建立服務執行個體的方式,完成ACK叢集的Prometheus配置。
您可以為AK設定如下許可權,僅允許調用 arms:GetPrometheusApiToken 介面,用於監控情境下的資料擷取或查詢。此配置在滿足監控需求的同時,遵循最小許可權原則,有效降低安全風險。
{
  "Version": "1",
  "Statement": [
    {
      "Effect": "Allow",
      "Action": [
        "arms:GetPrometheusApiToken"
      ],
      "Resource": "*"
    }
  ]
}步驟二:配置ROS模板
需要建立一個以服務執行個體ID為名稱的命名空間,並給該命名空間打上租戶標籤。
說明其中
tenant_userid、tenant_clusterid、tenant_token和tenant_cloudproductcode為租戶標籤的key,模板中只需填寫固定的預留位置即可。該命名空間的名稱設定為{{ serviceInstanceId }}預留位置,表示以建立出來的服務執行個體的serviceInstanceId命名。ClusterNameSpaceApplication: Type: ALIYUN::CS::ClusterApplication Properties: YamlContent: Fn::Sub: - | apiVersion: v1 kind: Namespace metadata: name: '${Name}' labels: tenant_userid: '{{ aliUid }}' tenant_clusterid: '{{ tenantClusterId }}' tenant_token: '{{ tenantToken }}' tenant_cloudproductcode: '{{ tenantCloudProductCode }}' - Name: '{{ serviceInstanceId }}' ClusterId: Fn::If: - Condition: CreateACKCondition - Ref: ManagedKubernetesCluster - Ref: ClusterId重要服務商的應用要部署在上述建立的命名空間下,才能實現應用的監控指標分發到租戶。
(可選)如果是託管單租情境,ROS模板中要引用上述
AckArmsConfig模組,為每個新建立的ACK叢集配置Prometheus。(可選)如果是自訂監控指標,可以通過HTTP連接埠透出或者Exporter暴露,但暴露指標的
Service也必須以{{ serviceInstanceId }}命名, 且定義一個ServiceMonitor用於服務發現,以下是通過mysqld-exporter採集MySQL監控指標時對應的Service和ServiceMonitor的樣本。apiVersion: v1 kind: Service metadata: name: {{ serviceInstanceId }} labels: io.mysql.service: {{ serviceInstanceId }} spec: selector: app: mysql ports: - protocol: TCP port: 3306 targetPort: 3306 name: mysql - protocol: TCP port: 9104 targetPort: 9104 name: mysql-exporter type: LoadBalancerapiVersion: monitoring.coreos.com/v1 kind: ServiceMonitor metadata: name: prometheus-service-monitor annotations: arms.prometheus.io/discovery: 'true' labels: prometheus-service-monitor: prometheus-service-monitor spec: selector: matchLabels: io.mysql.service: {{ serviceInstanceId }} namespaceSelector: matchNames: - {{ serviceInstanceId }} endpoints: - port: mysql-exporter scheme: http path: /metrics interval: 10s scrapeTimeout: 10s
步驟三:配置Grafana大盤
目前一個服務執行個體只支援展示一個大盤,如果服務商有多個大盤,需要將多個大盤組合成一個大盤,大盤需要滿足一個規則:
設定大盤的一個固定變數為Namespace,且大盤通過Namespace這個全域變數篩選各個應用的監控指標。在阿里雲託管版的Grafana建立大盤,得到此大盤的連結。
步驟四:配置產品標識和對應的大盤連結
託管版多租服務使用計算巢提供的Prometheus能力,需要設定服務識別和監控大盤資訊:
服務識別:表示服務在監控系統中的唯一標識,目前cn-mariadb這個產品標識用於測試,所有服務共用使用該產品標識。目前cn-mariadb已開通杭州和中國香港兩個地區,並支援在這兩個地區下測試。
說明服務上線需要使用專用服務識別的,請加入文章開頭的支援人員群擷取支援人員。
監控大盤設定包括監控大盤標題和Grafana大盤連結,監控大盤資訊與服務識別是對應關係,大盤連結為上述建立大盤的連結,大盤標題為上述配置的大盤的標題。
說明這裡的配置目前需要一定的手工配置,請加入支援人員群擷取支援。
下是樣本服務中使用
cn-mariadb產品標識的配置資訊。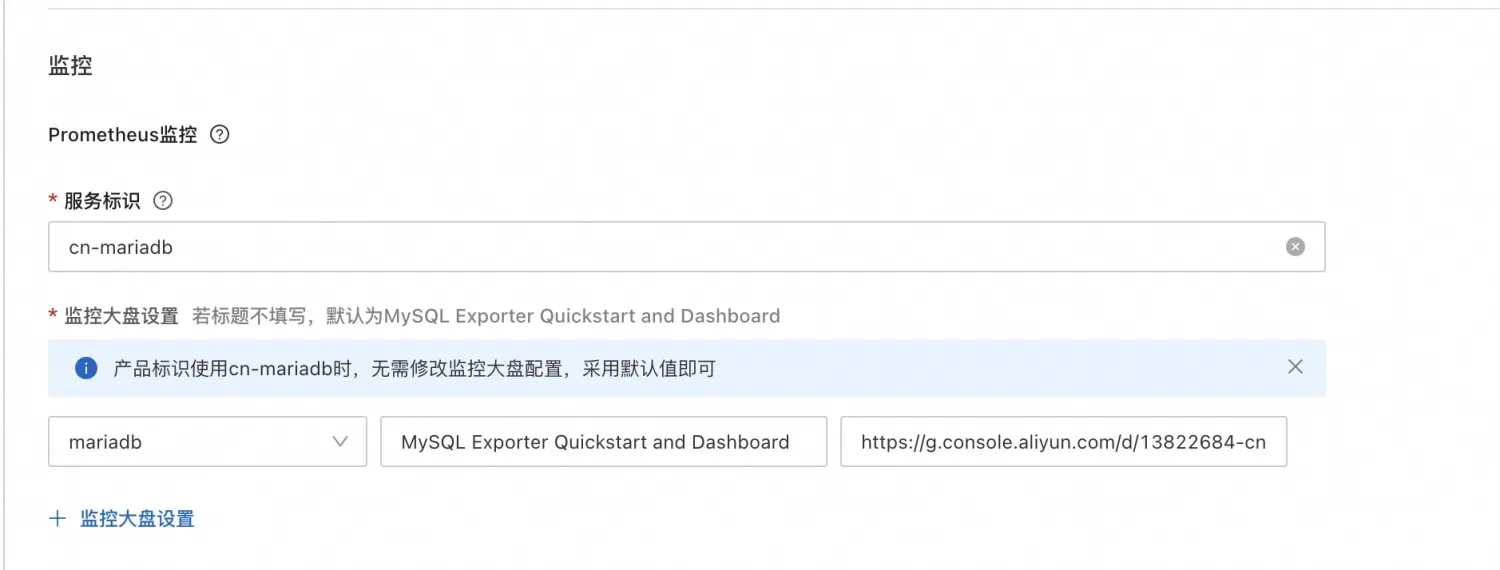
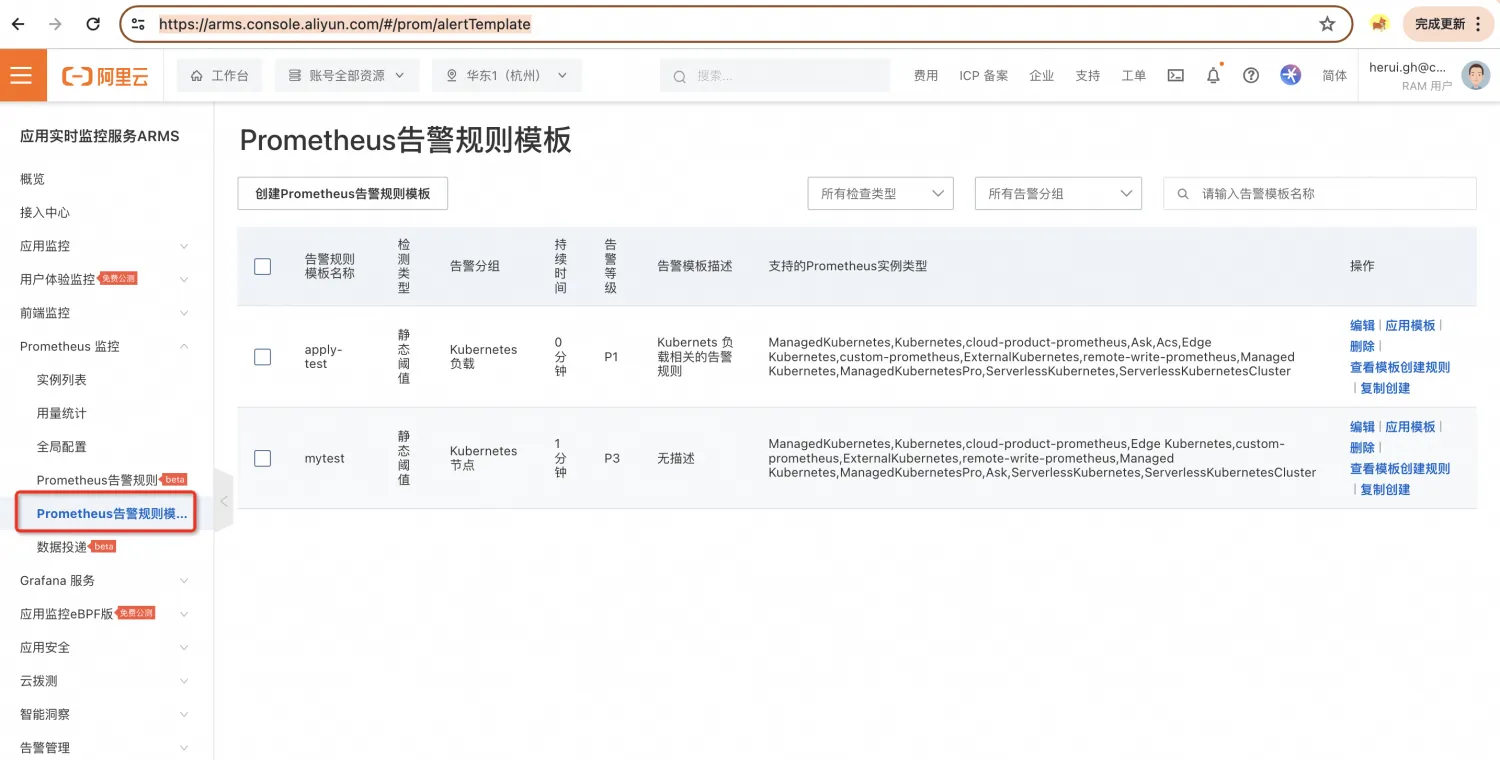
步驟五:配置警示
訪問ARMS-Prometheus監控控制台,建立Prometheus警示規則模板。具體操作,請參見建立Prometheus警示規則模板。
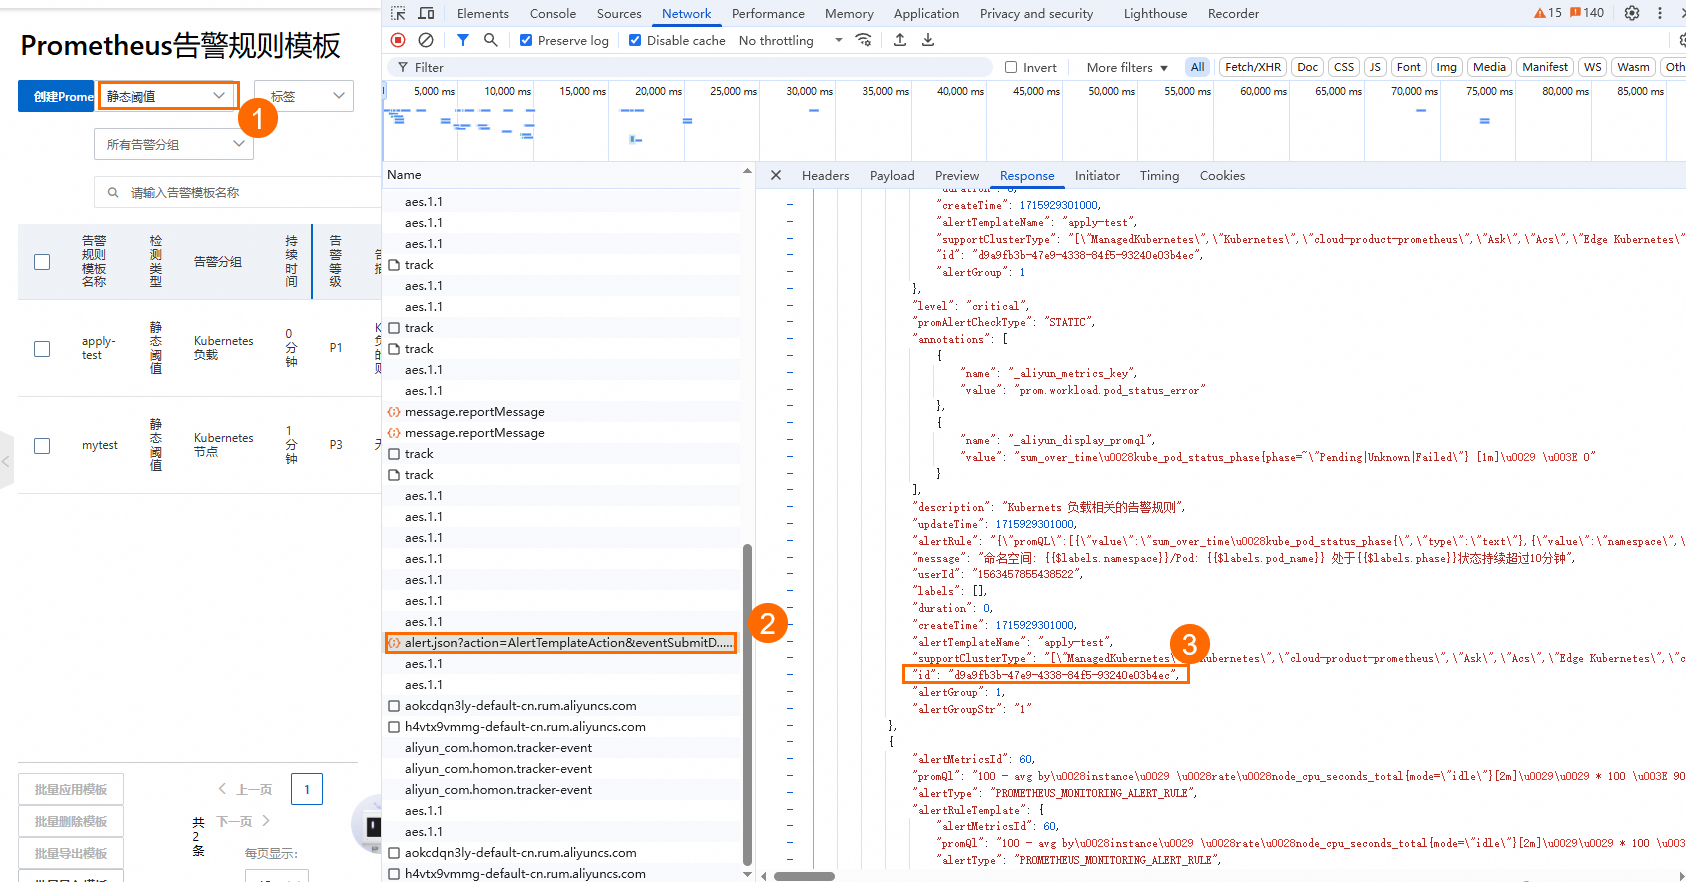
建立完成後,在控制台的網路請求中擷取TemplateId,擷取方式如下圖所示。
重要只有在圖中①處,通過篩選搜尋才會出現②處的請求。
ROS模板中編排警示模板,通過ALIYUN::ARMS::ApplyAlertRuleTemplate資源將此警示模板應用到ACK叢集中,即可實現在ACK叢集中建立對應的警示規則,ROS模板樣本如下所示。
ROSTemplateFormatVersion: '2015-09-01'
Description:
  en: ApplyAlertRule
  zh-cn: ApplyAlertRule
Parameters:
  ClusterIds:
    AssociationPropertyMetadata:
      Parameter:
        Required: true
        Type: String
        Description:
          en: The ID of the Prometheus Instance.
    Description:
      en: The IDs list of Prometheus Instances.
    Default: Null
    MinLength: 1
    Required: false
    MaxLength: 100
    AssociationProperty: List[Parameter]
    Type: Json
  TemplateIds:
    AssociationPropertyMetadata:
      Parameter:
        Required: true
        Type: String
        Description:
          en: The ID of the Prometheus alert rule template.
    Description:
      en: The IDs list of Prometheus alert rule templates.
    Default: Null
    MinLength: 1
    Required: false
    MaxLength: 100
    AssociationProperty: List[Parameter]
    Type: Json
Resources:
  ApplyAlertRuleTemplate:
    Type: ALIYUN::ARMS::ApplyAlertRuleTemplate
    Properties:
      ClusterIds:
        Ref: ClusterIds
      TemplateIds:
        Ref: TemplateIds
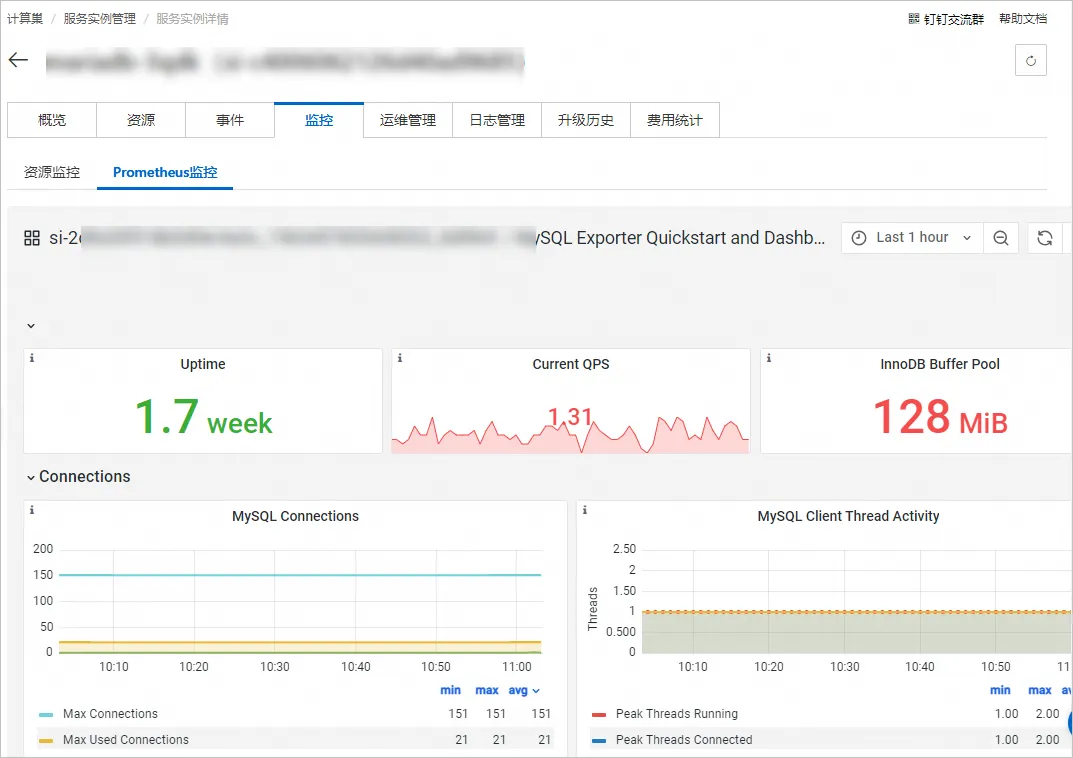
步驟六:查看監控
服務執行個體部署完成後,使用者側和服務商側均能在服務執行個體詳情頁查看監控大盤。
使用者側:
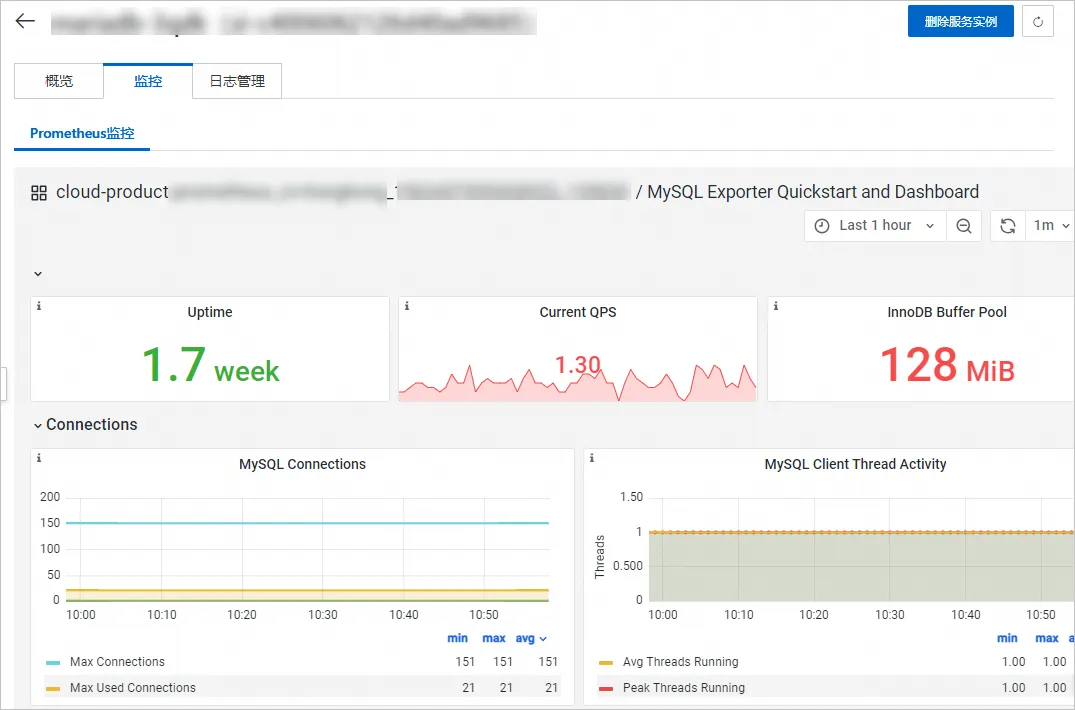
服務商側: