Jaeger を使用して .NET アプリケーションをインストルメント化し、トレースデータを Managed Service for OpenTelemetry にレポートすると、Managed Service for OpenTelemetry は .NET アプリケーションの監視を開始します。アプリケーショントポロジー、トレース、異常トランザクション、低速トランザクション、SQL 分析などのアプリケーションの監視データを表示できます。このトピックでは、OpenTracing、.NET Core、および gRPC コンポーネントを使用して、.NET アプリケーションを自動または手動でインストルメント化し、.NET アプリケーションのトレースデータをレポートする方法について説明します。
C# 用の Jaeger クライアントは、もはやメンテナンスされていません。トレースデータのレポートには、OpenTelemetry SDK for .NET を使用することをお勧めします。詳細については、OpenTelemetry を使用して .NET アプリケーションのトレースデータを送信する を参照してください。
前提条件
Managed Service for OpenTelemetry コンソール にログインします。
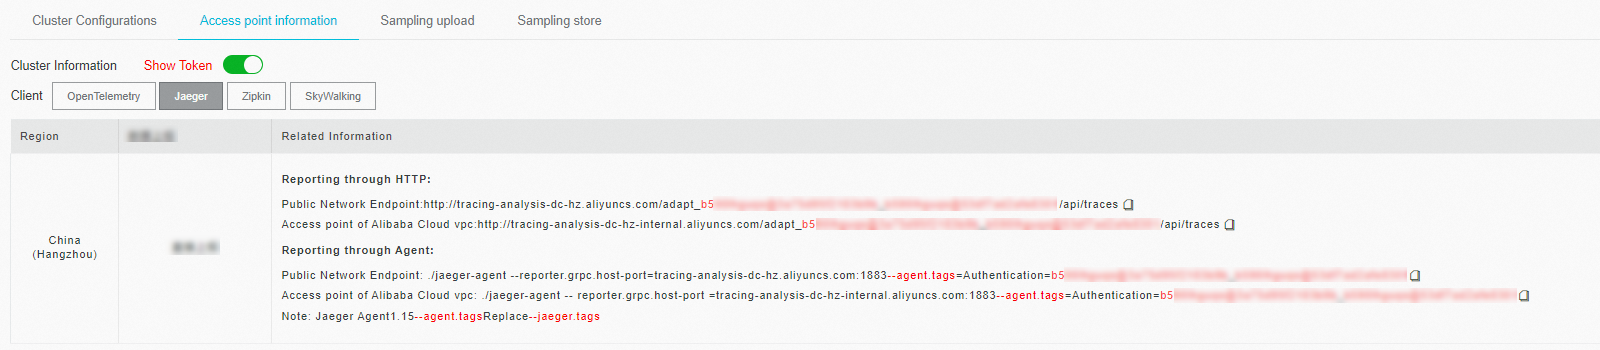
左側のナビゲーションペインで、クラスタ設定 をクリックします。表示されるページで、アクセスポイント情報 タブをクリックします。
上部のナビゲーションバーで、リージョンを選択します。クラスタ情報 セクションで、トークンを表示 をオンにします。
クライアント パラメーターを Jaeger または Zipkin に設定します。この例では、Jaeger が選択されています。
下部の表の 関連情報 列で、Jaeger または Zipkin のエンドポイントを取得します。
 説明
説明アプリケーションが Alibaba Cloud 本番環境にデプロイされている場合は、VPC エンドポイントを使用します。それ以外の場合は、パブリックエンドポイントを使用します。一般的に、Zipkin には v2 のエンドポイントを使用します。Zipkin をよく知っている場合にのみ、v1 のエンドポイントを使用します。
背景情報
Jaeger は、Uber によって作成および使用されているオープンソースの分散トレーシングシステムです。Jaeger は OpenTracing API と互換性があり、Cloud Native Computing Foundation (CNCF) のメンバーです。Jaeger は、さまざまな異種システムからリアルタイムの監視データを収集します。
OpenTracing コミュニティは、次の .NET フレームワークをサポートする複数のコンポーネントを提供しています。
次の図は、Jaeger エージェントを使用せずにデータをレポートする方法を示しています。

次の図は、Jaeger エージェントを使用してデータをレポートする方法を示しています。

サンプルコード
dotnet-demo からサンプルコードをダウンロードします。
.NET 6.0 アプリケーションをインストルメント化する
OpenTracing コンポーネントを使用して .NET アプリケーションを自動的にインストルメント化する
サンプルコードを実行するには、次の要件を満たす必要があります。
Jaeger 1.0.2 がインストールされている。
.NET 6.0 がインストールされている。
サンプルプロジェクトの dotnet-demo/net6.0/Shared/JaegerServiceCollectionExtensions.cs ファイルで、トレースデータのレポートに使用する Jaeger エンドポイントと、トレースデータをレポートするアプリケーションの名前を指定して、ITracer オブジェクトを初期化および登録します。
public static class JaegerServiceCollectionExtensions
{
    // Jaeger エンドポイントを指定します。Jaeger エンドポイントの取得方法については、このトピックの「前提条件」セクションを参照してください。
    private static readonly Uri _jaegerUri = new Uri("http://tracing-analysis-dc-sz.aliyuncs.com/adapt_your_token/api/traces");

    public static IServiceCollection AddJaeger(this IServiceCollection services)
    {
        if (services == null)
            throw new ArgumentNullException(nameof(services));

        services.AddSingleton<ITracer>(serviceProvider =>
        {
            // アプリケーション名を指定します。
            string serviceName = Assembly.GetEntryAssembly().GetName().Name;

            ILoggerFactory loggerFactory = serviceProvider.GetRequiredService<ILoggerFactory>();

            ISampler sampler = new ConstSampler(sample: true);

            IReporter reporter = new RemoteReporter.Builder()
                .WithSender(new HttpSender.Builder(_jaegerUri.ToString()).Build())
                .Build();

            ITracer tracer = new Tracer.Builder(serviceName)
                .WithLoggerFactory(loggerFactory)
                .WithSampler(sampler)
                .WithReporter(reporter)
                .Build();

            GlobalTracer.Register(tracer);

            return tracer;
        });

        // OpenTracing が Jaeger への HTTP リクエストを追跡しているときに無限ループが発生しないようにします。
        services.Configure<HttpHandlerDiagnosticOptions>(options =>
        {
            options.IgnorePatterns.Add(request => _jaegerUri.IsBaseOf(request.RequestUri));
        });

        return services;
    }
}
サンプルプロジェクトの dotnet-demo/net6.0/CustomersApi ディレクトリに移動し、次のコマンドを実行します。
dotnet run --framework:net6.0アプリケーションを起動し、次の URL にアクセスします。
http://localhost:5001/healthARMS コンソール にログインします。左側のナビゲーションペインで、 を選択します。[アプリケーション] ページで、アプリケーション名でアプリケーションを検索して、レポートされたデータを表示します。
説明 アイコンが言語列に表示されている場合、アプリケーションはApplication Monitoringに接続されています。ハイフン (-) が表示されている場合、アプリケーションはManaged Service for OpenTelemetryに接続されています。
.NET Core 3.1 アプリケーションをインストルメント化する
サンプルコードを実行するには、次の要件を満たす必要があります。
Jaeger 1.0.2 がインストールされている。
.NET Core 3.1 がインストールされている。
ASP.NET Core を使用して .NET アプリケーションを自動的にインストルメント化する
サンプルプロジェクトの dotnet-demo/netcoreapp3.1/Shared/JaegerServiceCollectionExtensions.cs ファイルで、トレースデータのレポートに使用する Jaeger エンドポイントと、トレースデータをレポートするアプリケーションの名前を指定して、ITracer オブジェクトを初期化および登録します。
public static class JaegerServiceCollectionExtensions
{
    // Jaeger エンドポイントを指定します。Jaeger エンドポイントの取得方法については、このトピックの「前提条件」セクションを参照してください。
    private static readonly Uri _jaegerUri = new Uri("http://tracing-analysis-dc-sz.aliyuncs.com/adapt_your_token/api/traces");

    public static IServiceCollection AddJaeger(this IServiceCollection services)
    {
        if (services == null)
            throw new ArgumentNullException(nameof(services));

        services.AddSingleton<ITracer>(serviceProvider =>
        {
            // アプリケーション名を指定します。
            string serviceName = Assembly.GetEntryAssembly().GetName().Name;

            ILoggerFactory loggerFactory = serviceProvider.GetRequiredService<ILoggerFactory>();

            ISampler sampler = new ConstSampler(sample: true);

            IReporter reporter = new RemoteReporter.Builder()
                .WithSender(new HttpSender.Builder(_jaegerUri.ToString()).Build())
                .Build();

            ITracer tracer = new Tracer.Builder(serviceName)
                .WithLoggerFactory(loggerFactory)
                .WithSampler(sampler)
                .WithReporter(reporter)
                .Build();

            GlobalTracer.Register(tracer);

            return tracer;
        });

        // OpenTracing が Jaeger への HTTP リクエストを追跡しているときに無限ループが発生しないようにします。
        services.Configure<HttpHandlerDiagnosticOptions>(options =>
        {
            options.IgnorePatterns.Add(request => _jaegerUri.IsBaseOf(request.RequestUri));
        });

        return services;
    }
}
サンプルプロジェクトの dotnet-demo/netcoreapp3.1/Shared ディレクトリに移動し、次のコマンドを実行します。
// ASP.NET Core 3.1 ミドルウェアを追加します。
dotnet add  package OpenTracing.Contrib.NetCore
サンプルプロジェクトの dotnet-demo/netcoreapp3.1/CustomersApi ディレクトリに移動し、次のコマンドを実行します。
// ASP.NET Core 3.1 ミドルウェアを追加します。
dotnet add  package OpenTracing.Contrib.NetCore
// デモプログラムを実行します。
dotnet run --framework:netcoreapp3.1
アプリケーションを起動し、次の URL にアクセスします。
http://localhost:5001/healthARMS コンソール にログインします。左側のナビゲーションペインで、 を選択します。[アプリケーション] ページで、アプリケーション名でアプリケーションを検索して、レポートされたデータを表示します。
説明言語 列に - アイコンが表示されている場合、アプリケーションはアプリケーション監視に接続されています。ハイフン () が表示されている場合、アプリケーションは Managed Service for OpenTelemetry に接続されています。
gRPC を使用して .NET アプリケーションを自動的にインストルメント化する
NuGet パッケージをインストールします。
// 次のコンポーネントを追加します。
// OpenTracing.Contrib.Grpc: gRPC ミドルウェア。
// Jaeger: OpenTracing の実装コンポーネント。
// Microsoft.Extensions.Logging.Console: ログコンポーネント。

dotnet add  package OpenTracing.Contrib.grpc
dotnet add  package Jaeger
ITracer オブジェクトを初期化します。
public static Tracer InitTracer(string serviceName, ILoggerFactory loggerFactory)
        {
            Configuration.SamplerConfiguration samplerConfiguration = new Configuration.SamplerConfiguration(loggerFactory)
                .WithType(ConstSampler.Type)
                .WithParam(1);
            Configuration.SenderConfiguration senderConfiguration = new Configuration.SenderConfiguration(loggerFactory)
                    // Jaeger エンドポイントを指定します。Jaeger エンドポイントの取得方法については、このトピックの「前提条件」セクションを参照してください。
                   .WithEndpoint("http://tracing-analysis-dc-sz.aliyuncs.com/adapt_your_token/api/traces");
            Configuration.ReporterConfiguration reporterConfiguration = new Configuration.ReporterConfiguration(loggerFactory)
                .WithSender(senderConfiguration);

            return (Tracer)new Configuration(serviceName, loggerFactory)
                .WithSampler(samplerConfiguration)
                .WithReporter(reporterConfiguration)
                .GetTracer();
        }
サーバーにインストルメンテーションを追加します。ServerTracingInterceptor オブジェクトを作成し、オブジェクトをアプリケーションにバインドします。
ILoggerFactory loggerFactory = new LoggerFactory().AddConsole();
ITracer tracer = TracingHelper.InitTracer("dotnetGrpcServer", loggerFactory);
ServerTracingInterceptor tracingInterceptor = new ServerTracingInterceptor(tracer);
Server server = new Server
 {
    Services = { Greeter.BindService(new GreeterImpl()).Intercept(tracingInterceptor) },
     Ports = { new ServerPort("localhost", Port, ServerCredentials.Insecure) }
 };
クライアントにインストルメンテーションを追加します。ServerTracingInterceptor オブジェクトを作成し、オブジェクトを指定されたチャネルにバインドします。
ILoggerFactory loggerFactory = new LoggerFactory().AddConsole();
ITracer tracer = TracingHelper.InitTracer("dotnetGrpcClient", loggerFactory);
ClientTracingInterceptor tracingInterceptor = new ClientTracingInterceptor(tracer);
Channel channel = new Channel("127.0.0.1:50051", ChannelCredentials.Insecure);

var client = new Greeter.GreeterClient(channel.Intercept(tracingInterceptor));
サンプルプロジェクトの dotnet-demo/netcoreapp3.1/GreeterServer ディレクトリに移動し、ターミナルで次のコマンドを実行して gRPC サーバーを起動します。
dotnet run --framework:netcoreapp3.1サンプルプロジェクトの dotnet-demo/netcoreapp3.1/GreeterClient ディレクトリに移動し、別のターミナルで次のコマンドを実行して gRPC クライアントを起動します。
dotnet run --framework:netcoreapp3.1Greeting: Hello youというメッセージが返された場合、サーバーとクライアントは接続されています。コンソールで、dotnetGrpcServer および dotnetGrpcClient によってレポートされたサンプルアプリケーションのトレースデータを表示できます。
.NET アプリケーションを手動でインストルメント化する
既存のプラグインを使用して .NET アプリケーションをインストルメント化できます。または、Jaeger を使用して .NET アプリケーションを手動でインストルメント化し、アプリケーションのトレースデータを Managed Service for OpenTelemetry コンソールにレポートできます。
NuGet パッケージをインストールします。
// Jaeger: OpenTracing の実装コンポーネント。
// Microsoft.Extensions.Logging.Console: ログコンポーネント。

dotnet add  package Microsoft.Extensions.Logging.Console
dotnet add  package Jaeger
ITracer オブジェクトを作成します。ITracer オブジェクトは、OpenTracing によって定義されたオブジェクトです。Jaeger を使用してこのオブジェクトを作成できます。このオブジェクトを作成するときに、オブジェクトを構成して Jaeger エンドポイントとサンプルレートを指定できます。
public static ITracer InitTracer(string serviceName, ILoggerFactory loggerFactory)
 {
    Configuration.SamplerConfiguration samplerConfiguration = new Configuration.SamplerConfiguration(loggerFactory)
          .WithType(ConstSampler.Type)
          .WithParam(1);
    Configuration.SenderConfiguration senderConfiguration = new Configuration.SenderConfiguration(loggerFactory)
           // Managed Service for OpenTelemetry コンソールで Jaeger エンドポイントを取得します。
          .WithEndpoint("http://tracing-analysis-dc-sz.aliyuncs.com/adapt_your_token/api/traces");

   Configuration.ReporterConfiguration reporterConfiguration = new Configuration.ReporterConfiguration(loggerFactory)
          .WithSender(senderConfiguration);

   return (Tracer)new Configuration(serviceName, loggerFactory)
          .WithSampler(samplerConfiguration)
          .WithReporter(reporterConfiguration)
        .GetTracer();
}
コード呼び出しを容易にするために、ITracer オブジェクトを GlobalTracer に登録します。
GlobalTracer.Register(InitTracer("dotnetManualDemo", loggerFactory ));リクエストデータを記録します。
ITracer tracer = GlobalTracer.Instance; ISpan span = tracer.BuildSpan("parentSpan").WithTag("mytag","parentSapn").Start(); tracer.ScopeManager.Activate(span, false); // ... 処理を実行 span.Finish();説明上記のコードを実行して、リクエストのルート操作を記録できます。リクエストの前後の操作を記録する場合は、AsChildOf メソッドを呼び出します。
次のサンプルコードは例を示しています。
ITracer tracer = GlobalTracer.Instance;
ISpan parentSpan = tracer.ActiveSpan;
ISpan childSpan =tracer.BuildSpan("childSpan").AsChildOf(parentSpan).WithTag("mytag", "spanSecond").Start();
tracer.ScopeManager.Activate(childSpan, false);
// ... 処理を実行
childSpan.Finish();
オプション: 問題を効率的にトラブルシューティングするために、レコードにカスタムタグを追加できます。たとえば、エラーが発生したかどうかを示すカスタムタグをリクエストに追加したり、リクエストの戻り値を記述したりできます。
tracer.activeSpan().setTag("http.status_code", "200");分散システムでは、リモートプロシージャコール (RPC) リクエストはトレースデータとともに送信されます。トレースデータには、TraceId、ParentSpanId、SpanId、および Sampled パラメーターの値が含まれています。Extract または Inject メソッドを呼び出して、HTTP リクエストヘッダーでトレースデータを渡すことができます。次の図は、プロセス全体を示しています。
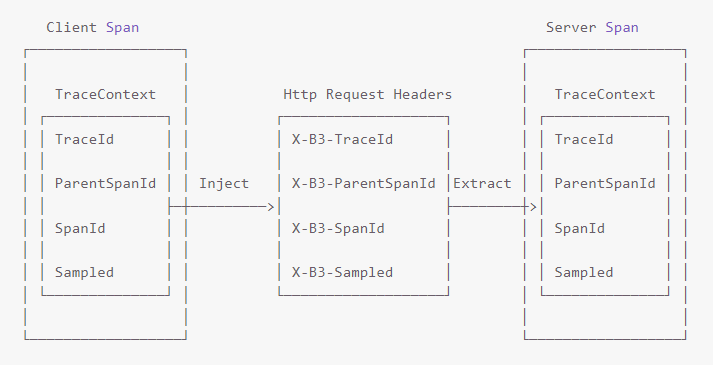
クライアントで Inject メソッドを呼び出して、コンテキスト情報を指定します。
Tracer.Inject(span.Context, BuiltinFormats.HttpHeaders, new HttpHeadersInjectAdapter(request.Headers));サーバーで Extract メソッドを呼び出して、コンテキスト情報を抽出します。
ISpanContext extractedSpanContext = _tracer.Extract(BuiltinFormats.HttpHeaders, new RequestHeadersExtractAdapter(request.Headers));
ISpan childSpan = _tracer.BuildSpan(operationName).AsChildOf(extractedSpanContext);
プロジェクトの dotnet-demo/netcoreapp3.1/ManualDemo ディレクトリに移動し、次のコマンドを実行します。サンプルプログラムはトレースデータのレポートを開始します。
dotnet run --framework:netcoreapp3.1Managed Service for OpenTelemetry コンソールで、手動でインストルメント化されたサンプルアプリケーション dotnetManualDemo のレポートされたトレースデータを表示できます。
FAQ
Q1: デモプログラムを実行した後、Managed Service for OpenTelemetry コンソールにトレースデータがレポートされない場合はどうすればよいですか?
A1: senderConfiguration のエンドポイントが有効かどうかを確認します。
Configuration.SenderConfiguration senderConfiguration = new Configuration.SenderConfiguration(loggerFactory)
           // Managed Service for OpenTelemetry コンソールで Jaeger エンドポイントを取得します。
          .WithEndpoint("http://tracing-analysis-dc-sz.aliyuncs.com/adapt_your_token/api/traces");
Q2: サンプルレートはどのように指定しますか?
A2: 詳細については、GitHub の jaeger-client-csharp ページをご覧ください。