Simple Log Service and Object Storage Service (OSS) jointly launch the CloudLens for OSS application. The application provides a bucket-level view for centralized management. You can use the application to analyze data such as resource usage, access, anomaly detection, and security data in a visualized manner. The application also provides scenario-based O&M management to achieve bucket asset observability. This topic describes the features, assets, billing, and limits of the CloudLens for OSS application.
Features
The CloudLens for OSS application provides the following features:
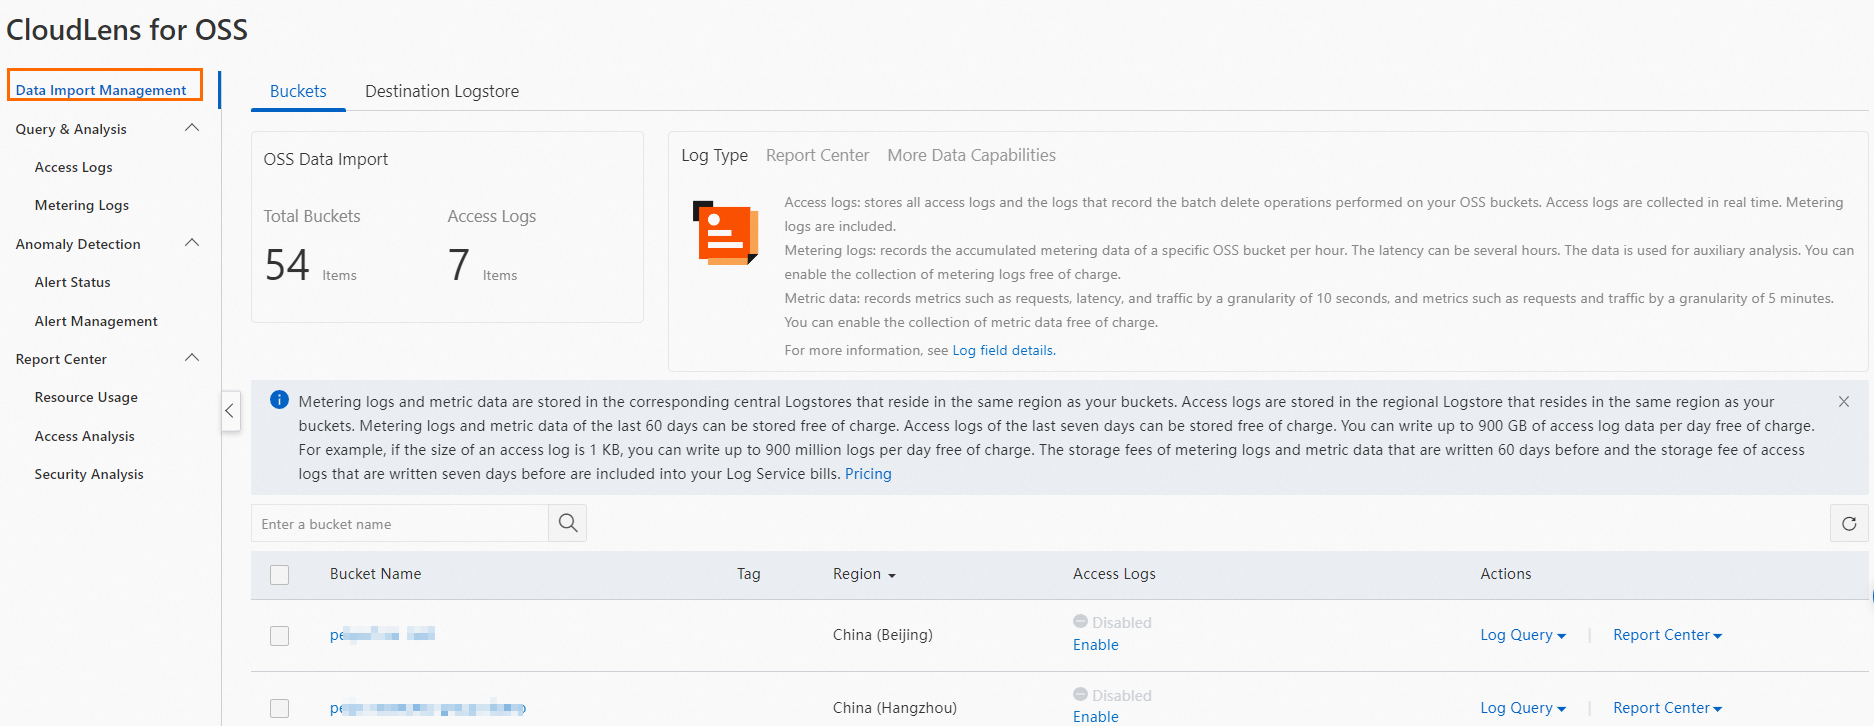
Access management
The application allows you to manage all OSS buckets that meet the specified conditions within the current Alibaba Cloud account and the collection status of related logs in a centralized manner. For more information, see Limits.
The application allows you to manage the projects, Logstores, and Metricstores that are used to store collected data in a centralized manner.

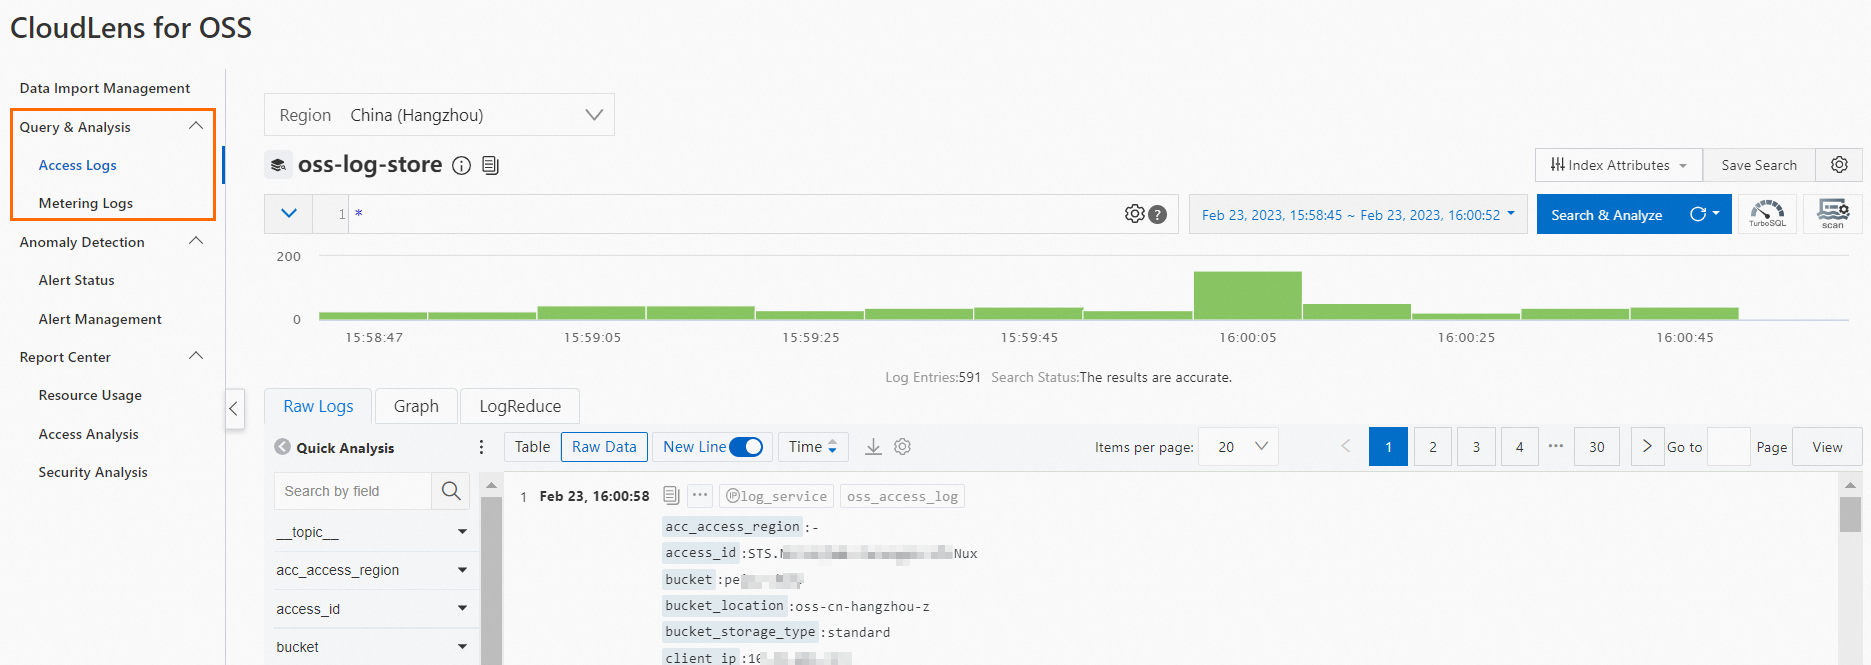
Query and analysis
The application allows you to query and analyze the detailed access logs and metering logs of OSS in real time.

Anomaly detection
The application provides an alert dashboard that allows you to analyze alerts in a visualized manner. For example, you can analyze alert distribution and alert trends.
The application supports alert management and allows you to configure alerts on buckets.

Report center
Report
Description
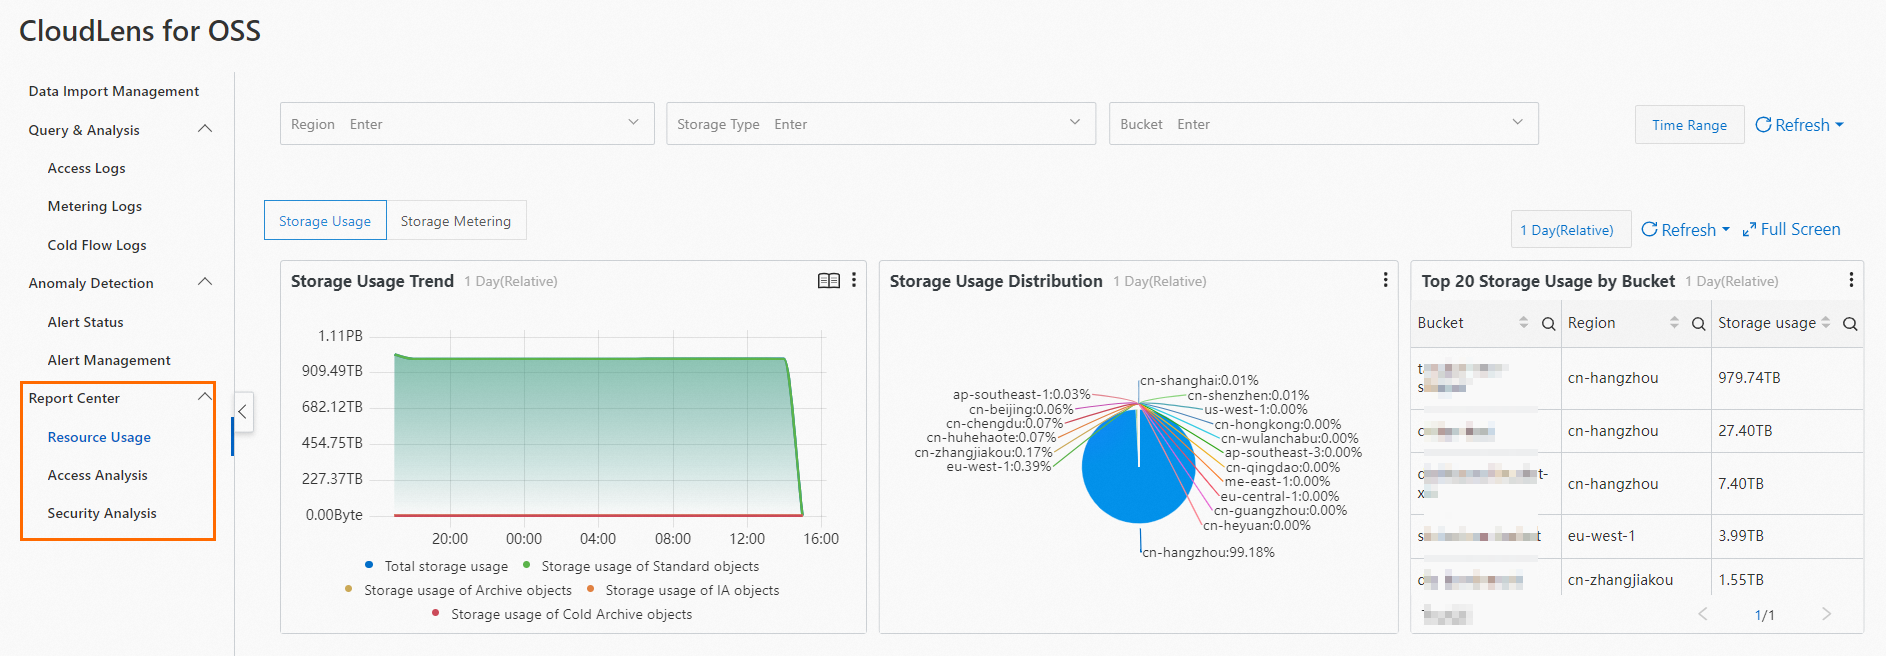
Resource usage
Provides an overview of OSS resource usage in basic dimensions, such as storage and traffic.
Access analysis
Provides analysis results of each OSS bucket, such as traffic distribution and top access distribution.
Security Analysis
Provides the risk points in OSS bucket configurations and the high-risk operations on OSS objects.

Assets
After you enable the CloudLens for OSS application, Simple Log Service automatically creates dedicated projects, Logstores, and Metricstores to store logs that are collected from OSS buckets.
Project | Logstore/Metricstore | Description |
oss-log-Alibaba Cloud account ID-Region ID | oss-log-store |
|
oss-metering-log |
| |
oss_metric |
| |
aliyun-product-data-Alibaba Cloud account ID-cn-heyuan | None | All CloudLens series applications depend on this dedicated project. For more information, see the Usage notes section. |
Billing
The CloudLens for OSS application allows you to query and analyze metering logs and monitoring data free of charge within 60 days after the logs are collected to Simple Log Service. The application also allows you to query and analyze detailed access logs free of charge within seven days after the logs are collected to Simple Log Service. Up to 900 GB of detailed access logs can be written to Simple Log Service per day. If a detailed access log is 1 KB in size, up to 900 million detailed access logs can be written per day. After the free quotas are exhausted, you are charged fees, and the charges are included into your Simple Log Service bill.
The CloudLens for OSS application provides a free quota for shards per month. The free quota is calculated by using the following formula: Free quota = 31. After the free quota is exhausted, you are charged fees, and the charges are included into your Simple Log Service bill.
You are charged for dedicated Logstores based on read traffic, Internet traffic, and operations such as data transformation and data shipping. The charges are included into your Simple Log Service bill.
The alerting feature is free of charge. When you use the alerting feature, you are charged only a small amount of fees for the text message and voice call notifications that are sent.
For more information about the billing of Simple Log Service, see Billable items of pay-by-feature.
Limits
You can write only the specified data to dedicated Logstores and Metricstores. You cannot modify or delete the indexes of dedicated Logstores or Metricstores. For other features such as query, analysis, and alerting, no limits are imposed on dedicated Logstores or Metricstores.
ImportantFeatures such as query, analysis, reports, and alerting depend on data indexes. The operations that are performed to configure custom indexes may cause some features of CloudLens series applications unavailable.
You cannot delete dedicated Logstores or Metricstores.
If your Alibaba Cloud account has an overdue payment, the feature that allows you to query OSS logs in real time is unavailable.
The CloudLens for OSS application is available in the following regions.
Cloud type
Region
Alibaba Cloud public cloud
China (Qingdao), China (Beijing), China (Zhangjiakou), China (Hohhot), China (Ulanqab), China (Hangzhou), China (Shanghai), China (Shenzhen), China (Heyuan), China (Guangzhou), China (Chengdu), China (Hong Kong), Singapore (Singapore), South Korea (Seoul), Thailand (Bangkok), Malaysia (Kuala Lumpur), Indonesia (Jakarta), Philippines (Manila), Japan (Tokyo), US (Silicon Valley), US (Virginia), Germany (Frankfurt), UK (London), and UAE (Dubai)
Precautions
To use a CloudLens application, make sure that at least one project exists within your Alibaba Cloud account.
When you enable a CloudLens application, Simple Log Service automatically checks whether a project exists within your Alibaba Cloud account.
Check logic
The first time you enable a CloudLens application, Simple Log Service automatically checks whether a project exists within your Alibaba Cloud account. If no projects exist, Simple Log Service creates a project whose name is in the
aliyun-product-data-<Alibaba Cloud account ID>-cn-heyuanformat in the China (Heyuan) region.After you enable a CloudLens application, Simple Log Service automatically checks whether a project exists within your Alibaba Cloud account. If no projects exist, Simple Log Service does not create a project in the China (Heyuan) region. You can manually create a project. For more information about how to create a project, see Manage a project.
Delete a project
If you want to delete the project whose name is in the
aliyun-product-data-<Alibaba Cloud account ID>-cn-heyuanformat, open Cloud Shell and run the following command. Replace the Alibaba Cloud account ID based on your business scenario.aliyunlog log delete_project --project_name=aliyun-product-data-<Alibaba Cloud account ID>-cn-heyuan --region-endpoint=cn-heyuan.log.aliyuncs.comIf you want to delete other projects and logstores, follow the instructions provided in Manage a logstore and Manage a project.