You can use a table to visualize the results of multiple query statements. You can also configure personalized display settings on the Field Configuration tab. This topic describes how to configure a table.
Overview
You can use tables to sort and display data for quick reference and analysis. By default, the results of query statements are displayed in tables.
For more information about the entry point to add a table, see Add a chart to a dashboard.
Configuration effect
Table type | Sample table | References |
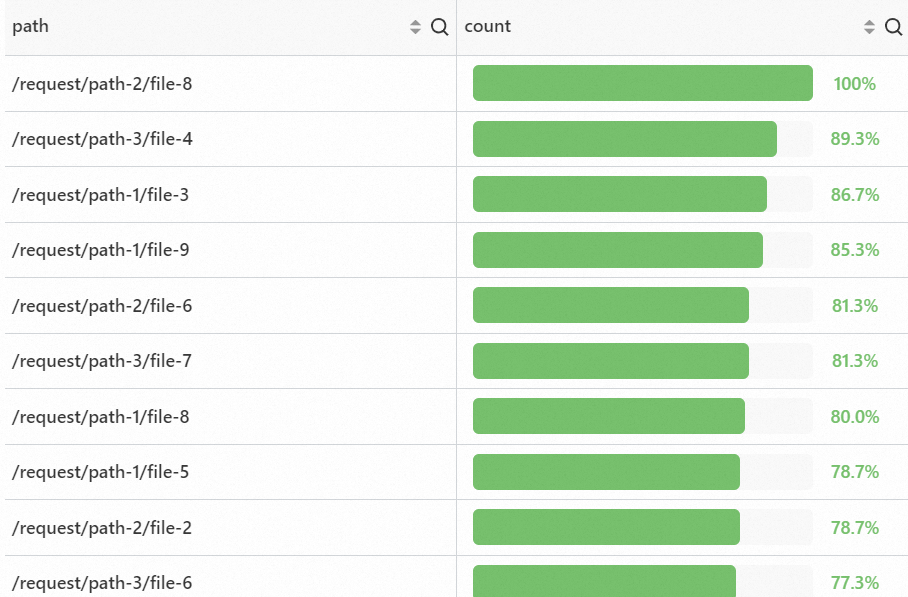
Basic table |
| |
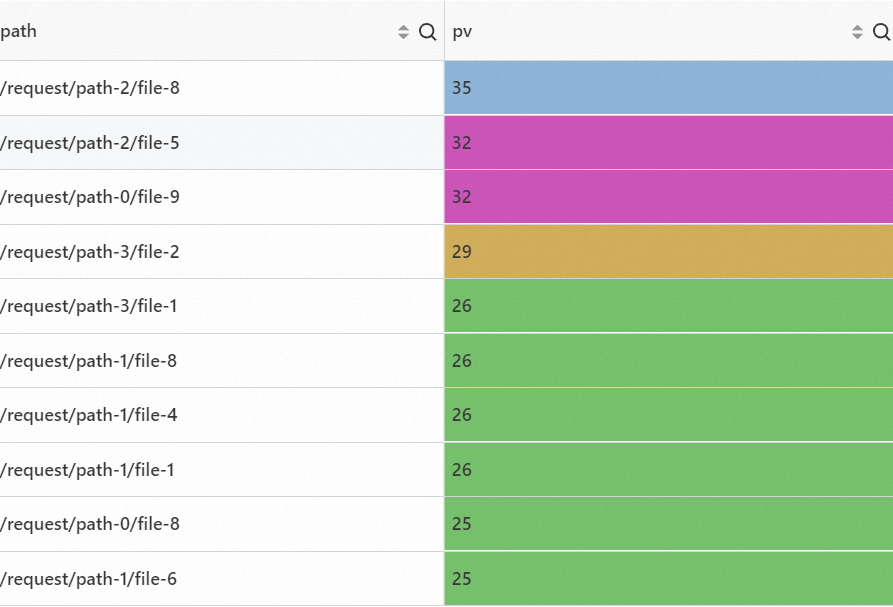
Table in colors |
| |
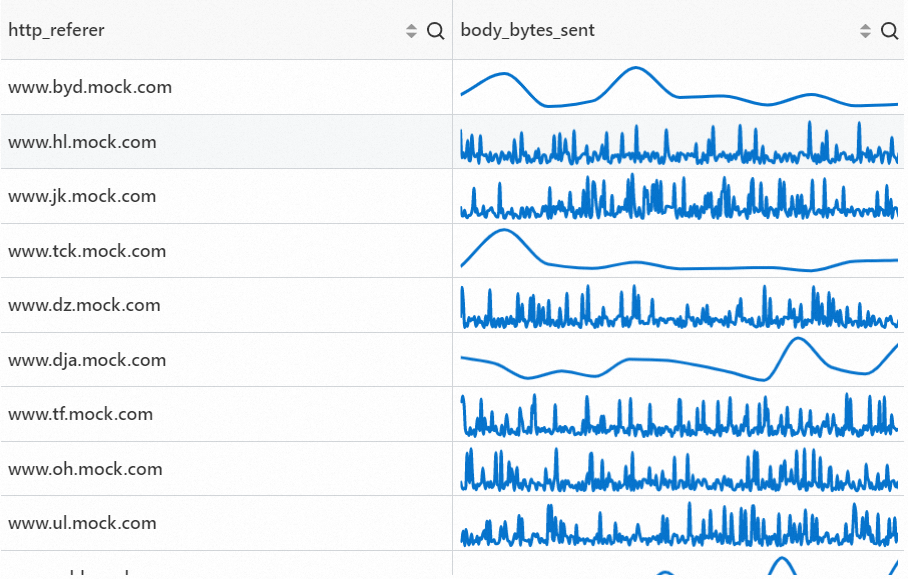
Sparkline |
| |
Progress bar |
|
Configuration example
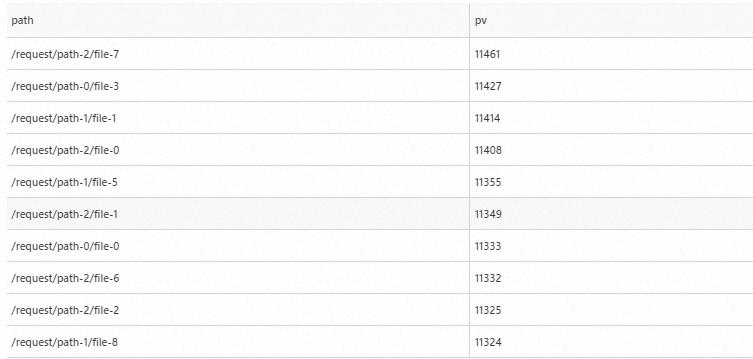
Basic table
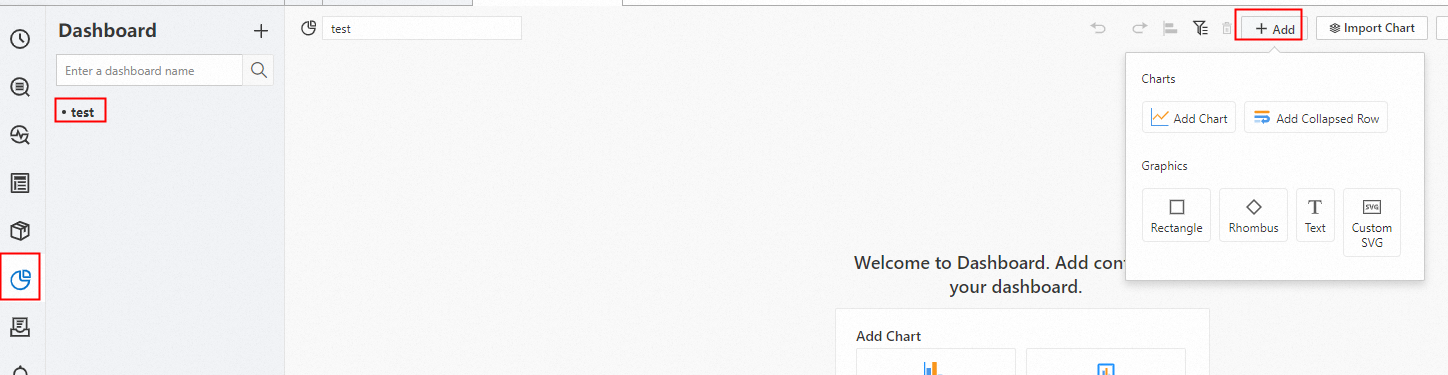
Log on to the Simple Log Service console. In the Projects section, click the project you want.
In the left-side navigation pane, choose Dashboard > Dashboards. In the dashboard list, click the dashboard you want. In the upper-right corner of the dashboard page, click Edit. In edit mode, click Add > Add Chart.
On the right side of the Edit Chart page, choose General Configurations > Chart Types >
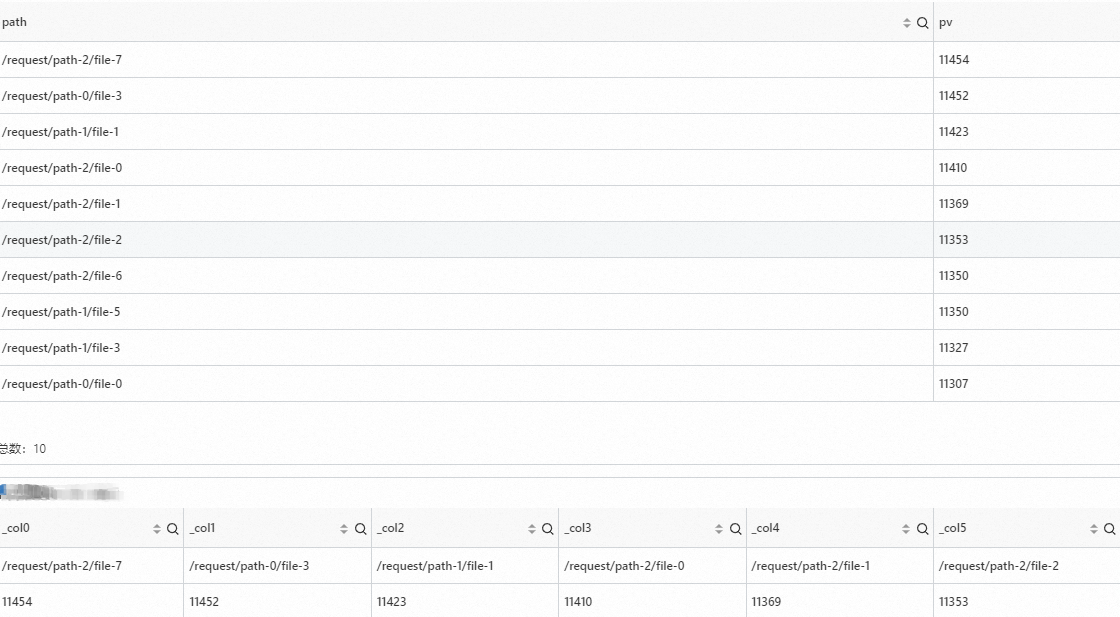
 . Enter a query statement and click Last 15 Minutes to specify a query time range.
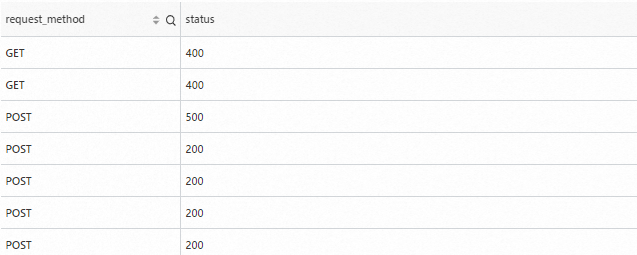
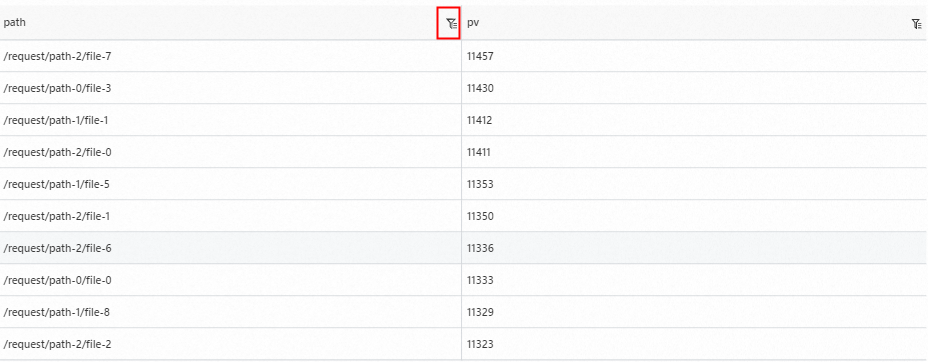
 For example, you can enter the following statement to query the methods and status of all requests:
* | SELECT request_method,status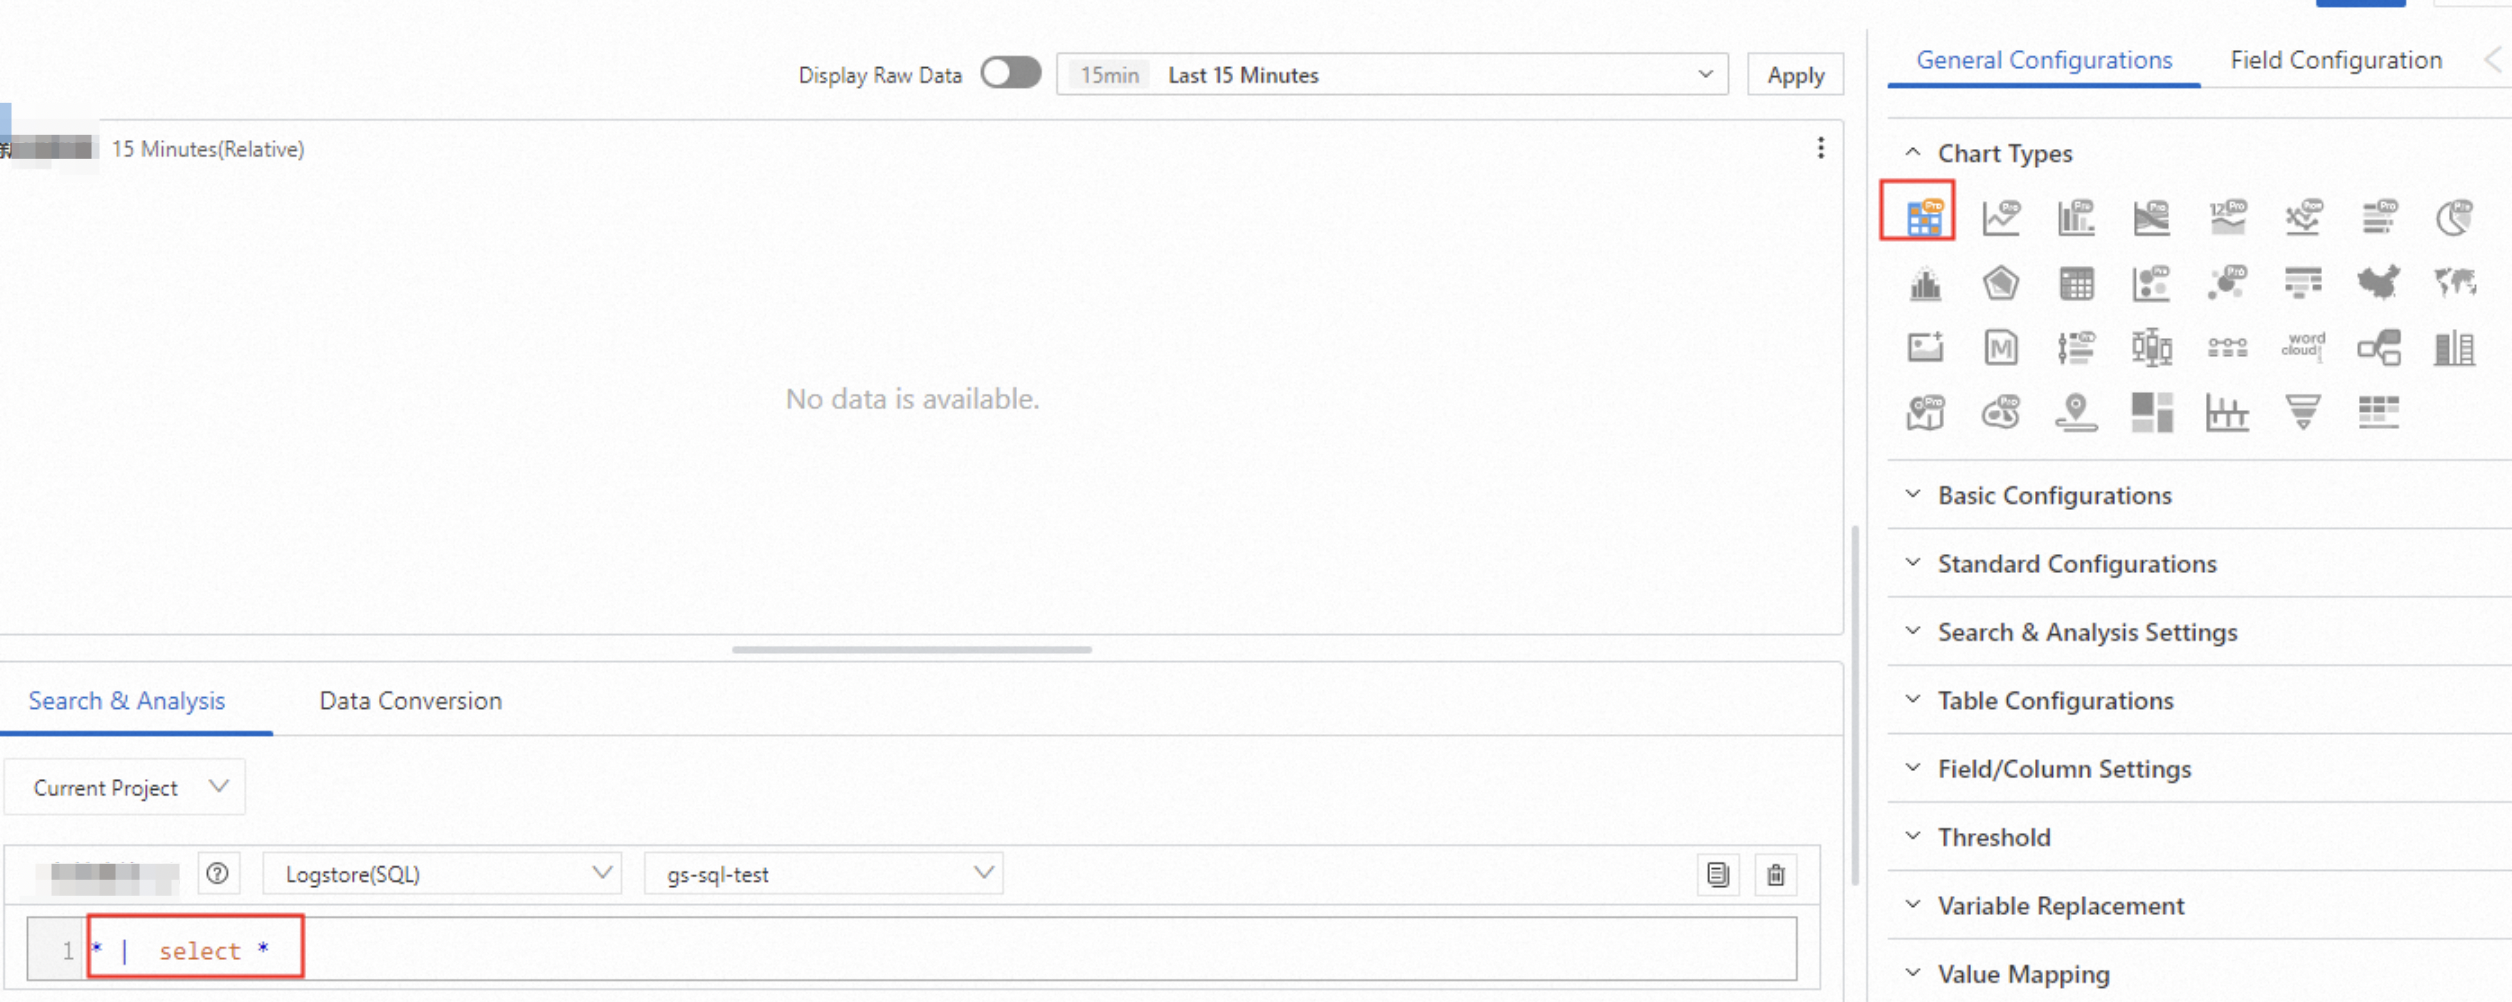
Other settings
Operation | Description | Sample table |
Configure the Value Mapping parameter | You can configure the Value Mapping parameter to convert and organize raw log data. This provides a clear view of the processed data that you can display on your dashboard. You can also monitor the system status and identify, troubleshoot, and analyze exceptions. For more information, see Add value mapping to a table. |
|
Configure a data conversion rule of the Transpose Rows and Columns type for a table | You can configure a data conversion rule of the Transpose Rows and Columns type for a table to display raw log data from different perspectives. This way, you can view the correlation and trends of log data for better data monitoring and management. For more information, see Configure a data conversion rule of the Transpose Rows and Columns type for a table. |
|
Adjust the row height and column width of a table | You can adjust the row height and column width of a table. This way, you can view data and find the required information in a more efficient manner. For more information, see Adjust the row height and column width of a table. |
|
Configure a data conversion rule of the Connect type for two tables | You can configure a data conversion rule of the Connect type for two tables. This way, you can view a large number of data entries in a small space and highlight key metrics or key data. For more information, see Configure a data conversion rule of the Connect type for two tables. |
|
Specify thresholds | You can specify thresholds and check whether data exceeds the specified thresholds to monitor system performance metrics, such as response time and throughput. For more information, see Specify thresholds for a table. |
|
Configure settings for search and filter, variable replacement, and multi-statement query | You can configure the search and filter feature for a table. This way, you can analyze a large amount of data for further statistics collection. You can also configure variable replacement for a table. This way, you can dynamically update the data displayed in the table on a Simple Log Service dashboard. In addition, you can specify multiple query statements to generate a report from multiple dimensions. For example, you can analyze and visualize data by time, type, and user. For more information, see Configure settings for search and filter, variable replacement, and multi-statement query. |
|
Configuration on the General Configurations tab
You can configure global settings for a table on the General Configurations tab.
Basic Configurations
Parameter
Description
Title
The title of the chart.
Display Title
If you turn on Display Title, the title of the chart is displayed.
Display Border
If you turn on Display Border, the borders of the chart are displayed.
Display Background
If you turn on Display Background, the background color of the chart is displayed.
Display Time
If you turn on Display Time, the query time range of the chart is displayed.
Fixed Time
If you turn on Fixed Time, the query time range of the chart is independent of the global time range of the dashboard.
Standard Configurations
Parameter
Description
Format
The display format of numeric values.
Unit
The unit of numeric values.
Number of Digits after Decimal Point
The decimal places of numeric values.
Display Name
The name of the display field.
If you specify a value for Display Name, the value is used as the names for all display fields in the chart. If you want to change the name of a display field, you must configure parameters on the Field Configuration tab.
Color Scheme
The color scheme of the chart.
Built-in: uses the built-in color scheme.
Solid: uses the color that you select.
Threshold: uses different colors for different values based on the specified thresholds for the values.
Parameters in the Search & Analysis Settings section
Parameter
Description
Hide Field
The name of the field that is included in the results of a query statement and you want to hide in the table. For example, if you select __time__ from the Hide Field drop-down list, the __time__ field is hidden in the table.
Parameters in the Table Configurations section
Parameter
Description
Display Mode
The display mode of the table. Valid values:
Paging: The table is displayed by page. You can configure the Items Per Page parameter to specify the number of rows that you want to display on each page.
Contour: The table is displayed on one page. You can configure the Row Height parameter to specify the height of rows that you want to display on one page.
Items Per Page
The number of rows that you want to display on each page.
Sort By
The field that you want to use to sort data in the table.
Sorting Method
The order that you want to use to sort data in the table. Valid values:
Default
Ascending
Descending
Display Header
If you turn on Display Header, the headers of the table are displayed.
Total
If you turn on Total, the total number of rows is displayed in the table.
Transparent Background
If you turn on Transparent Background, the background in the table is transparent.
Parameters in the Field/Column Settings section
Parameter
Description
Minimum Column Width
The minimum column width of the table. Unit: pixels.
If you retain auto for the Column Width parameter, the column width of the table is greater than or equal to the value of the Minimum Column Width parameter.
Column Width
The column width of the table. Unit: pixels.
By default, Simple Log Service automatically calculates the column width of the table based on the size of the table and the value of the Minimum Column Width parameter. If you configure the Column Width parameter, the value is used as the column width of the table.
Maximum Value
The maximum value of the progress bar. If you retain auto for the Maximum Value parameter, the maximum value of the column is used.
The value of the Maximum Value parameter takes effect only if you set the Cell Display Mode parameter to Progress, LCD Progress Bar, or Gradient Progress Bar.
Cell Display Mode
The display mode of cells.
Alignment Method
The alignment method of the content in cells.
Disable Sorting
If you turn on Disable Sorting, sorting is disabled.
Disable Searching
If you turn on Disable Search, searching is disabled.
Search Mode
The mode for searching data in the table. Valid values:
Search: In this mode, you must specify a value to search data.
Filter: In this mode, you can select a value to filter data.
Multiple Choices
Specifies whether to enable multiple selections when you search data in the table. Valid values:
Multiple-choice
Single
Exact Search
If you turn on Exact Search, only exact search is supported.
Font Size
The font size of the content in cells.
Show All
If you turn on Show All, field values are fully displayed in the table.
Parameters in the Threshold section
Parameter
Description
Threshold
The threshold of numeric values.
If you set the Color Scheme parameter to Threshold and specify thresholds in the Threshold section, the text in the table is displayed in different colors based on the specified thresholds.
Parameters in the Variable Replacement section
Parameter
Description
Variable Replacement
The settings for variable replacement. You can click AddVariable Replacement to add a filter of the Variable Replacement type to the table. After you configure the settings for variable replacement on the General Configurations tab, Simple Log Service adds a filter in the upper-left corner of the table. You can select a value from the filter drop-down list. Then, Simple Log Service automatically replaces the variable in the query statement of the table with the variable value indicated by the value that you select, and performs a query and analysis operation. For more information, see Example 2: Configure variable replacement.
Parameters in the Value Mapping section
Parameter
Description
Value Mapping
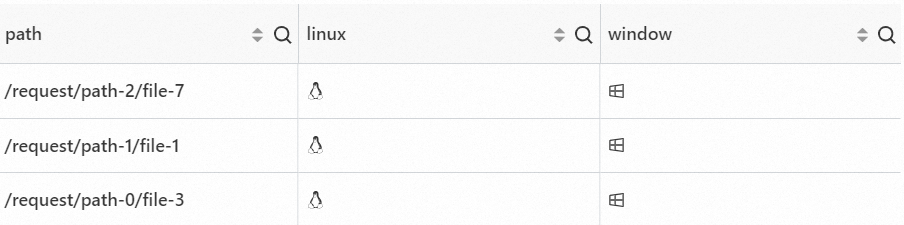
The text or icon that you want to use to replace a specified value in the table.
For example, if you set the Value parameter to 200, the Mapping Type parameter to Text, and the Mapping Value parameter to Success, all values of 200 in the table are replaced with Success.
Parameters in the Documentation section
Parameter
Description
Add Documentation Link
The button that allows you to specify custom document links and descriptions. After you configure the settings, the specified information is displayed in the upper right corner of the table.
Configuration on the Field Configuration tab
You can configure personalized display settings for the results of a single query statement or for a single column of data in the results. For more information, see Configuration on the General Configurations tab.
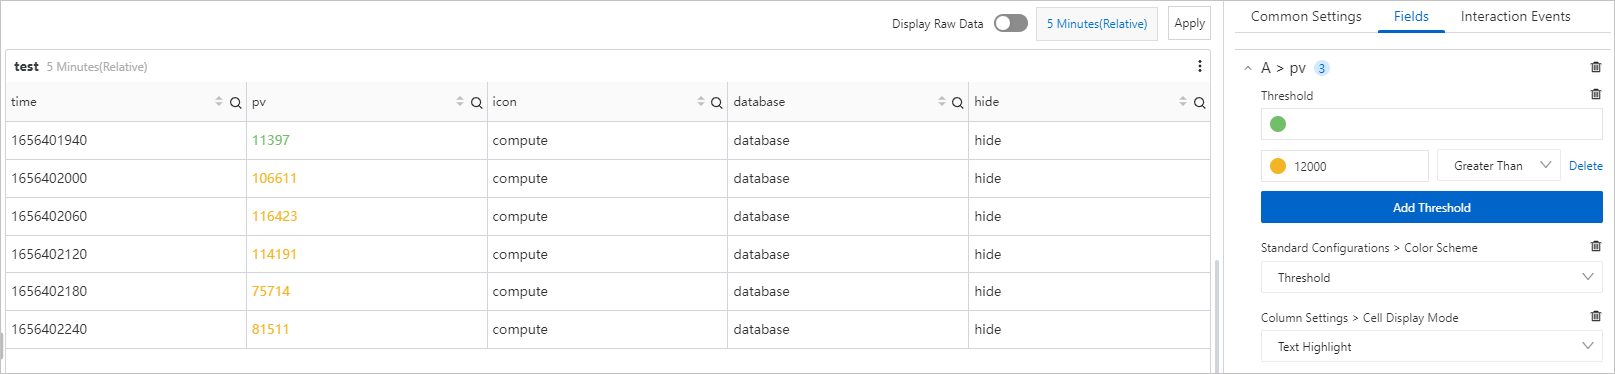
For example, you can select A > pv to configure settings for the pv field in the results of Query Statemnt A. If you select Text Highlight from the Field/Column Settings > Cell Display Mode drop-down list, the values of the pv field are highlighted and are displayed in different colors based on the specified thresholds.
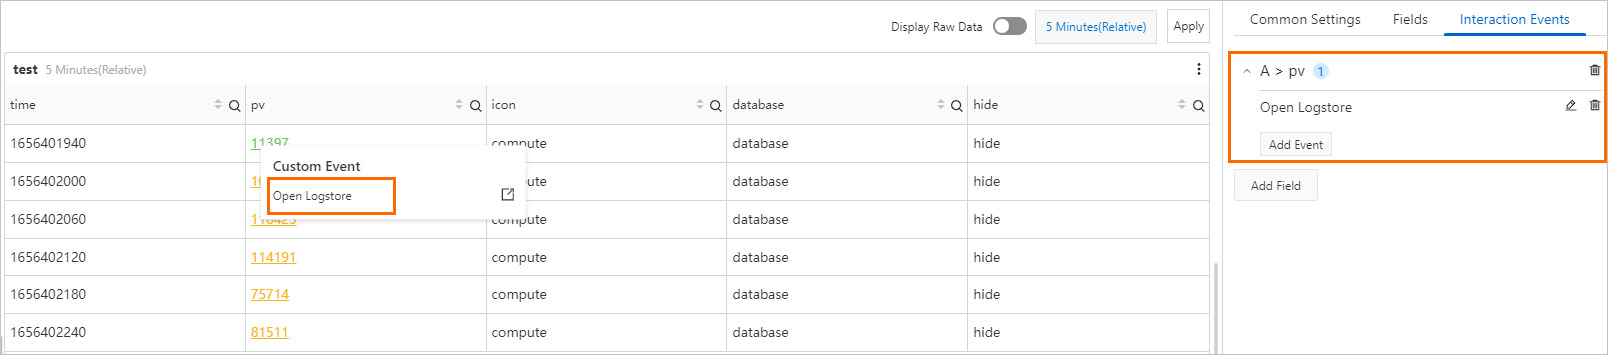
Configuration on the Interaction Occurrences tab
You can configure an interaction occurrence for the results of a single query statement or for a single column of data in the results to analyze data in a finer-grained manner. Supported types of interaction occurrences include Open Logstore, Open Saved Search, Open Dashboard, Open Trace Analysis, Open Trace Details, and Create Custom HTTP URL. For more information, see Interaction occurrences.
For example, you can select A > pv to configure an Open Logstore interaction occurrence for the pv field in the results of Query Statement A. After you configure the interaction occurrence, you can move the pointer over a value of the pv field in the table and click Open Logstore. Then, you are navigated to the Logstore that you specify.