Simple Log Service provides the scan feature that scans logs based on specified fields to return query and analysis results. The scan feature allows you to query and analyze logs without the need to configure indexes for the logs. The scan feature includes scan-based query and scan-based analysis. This topic describes how to use the scan feature and provides examples.
Prerequisites
Logs are collected. For more information, see Data collection overview.
Indexes are created. For more information, see Create indexes.
ImportantYou do not need to create indexes for the fields that are used for scanning. However, search statements still rely on indexes.
Procedure
Log on to the Simple Log Service console.
In the Projects section, click the project that you want to manage.

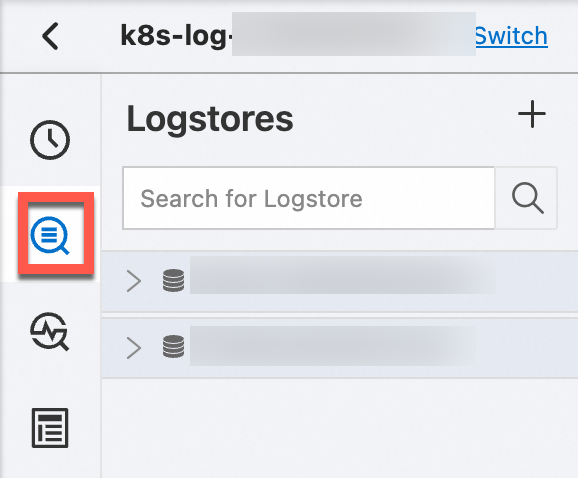
In the left-side navigation pane, click Log Storage. In the Logstores list, click the Logstore that you want to manage.

In the query statement field, enter a scan statement.
Enter a scan statement in one of the following formats:
Search statement | SPL statementorSearch statement | set session mode=scan; Analytic statement based on the standard SQL syntax.In the upper-right corner of the page, specify a query time range.
You can select a relative time, select a time frame, or specify a custom time range. The query time range that you can specify supports minute-precision at most.
Automatic scanning
Automatic scanning and page turning are supported only for scan-based query.
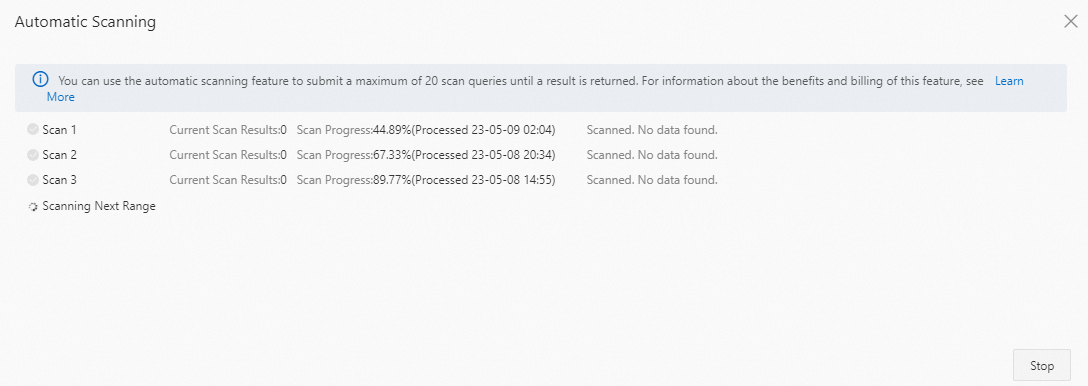
If you perform a scan-based query operation and the system returns a message that indicates no data for the scan, you can click the ![]() icon to trigger a new automatic scan until the system returns logs that meet the scan condition or the number of scans reaches 20.
icon to trigger a new automatic scan until the system returns logs that meet the scan condition or the number of scans reaches 20.

In the Automatic Scanning dialog box, you can view the progress of each automatic scan.

Page turning
When you perform a page turn, Simple Log Service performs a scan-based query operation to ensure the continuity of scan results.
By default, Simple Log Service can scan up to 100,000 logs at a time. When you perform a page turn, the number of logs that are displayed on a page may be less than the number that is specified by the Items per Page parameter. However, you can still move forward one page. In this case, the number of logs that meet the scan condition among the 100,000 logs that are scanned is less than the number that is specified by the Items per Page parameter.
For example, the total number of logs is 200,000, and the number that is specified by the Items per page parameter is 20. After a scan is complete, only 15 logs are returned, and you can move forward one page. In this case, only 15 logs among the first 100,000 logs that are scanned meet the scan condition. You can perform a page turn. Then, Simple Log Service scans the remaining 100,000 logs and returns the logs that meet the scan condition.

Examples
Use the scan feature to query the logs of successful requests.
Scan statement
* | where Status='Success'Scan results

Use the scan feature to query the logs of a file at a specific point in time.
Scan statement
* | where file = 'file:Android' | where time ='[2024-04-24T10:07:27.427014479]'Scan results

Use the scan feature to calculate the numbers of requests by request status.
Scan statement
NoteWhen you use the scan feature, you must add
set session mode=scan;before the SQL statement.* | set session mode=scan; SELECT Status, count(*) AS PV GROUP BY StatusScan results

API calls
You can call the GetLogs operation to use the scan feature. For more information, see GetLogs.
If you want to use the scan feature, you must add set session mode=scan; before the analytic statement in the query parameter. Example: * | set session mode=scan; select count(*) as pv.