Simple Log Service provides built-in alert rule templates for Scheduled SQL. If you want to monitor a Scheduled SQL job in real time, you need to only create an alert rule from a template. Then, you can receive alert notifications such as DingTalk messages. This topic describes how to create an alert rule for a Scheduled SQL job.
Prerequisites
A Scheduled SQL job is created.
If you want to process data in a source Logstore and store the processed data to a destination Logstore by using the Scheduled SQL feature, see Process and save data from a Logstore to another Logstore.
If you want to process data in a source Logstore and store the processed data to a destination Metricstore by using the Scheduled SQL feature, see Process and store data from a Logstore to a Metricstore.
If you want to process data in a source Metricstore and store the processed data to a destination Metricstore by using the Scheduled SQL feature, see Process and save data from a Metricstore to another Metricstore.
Step 1: Enable the service log feature for job operational logs
Log on to the Simple Log Service console.
In the Projects section, click the project that you want to manage.
Click the project to which the Scheduled SQL job belongs.
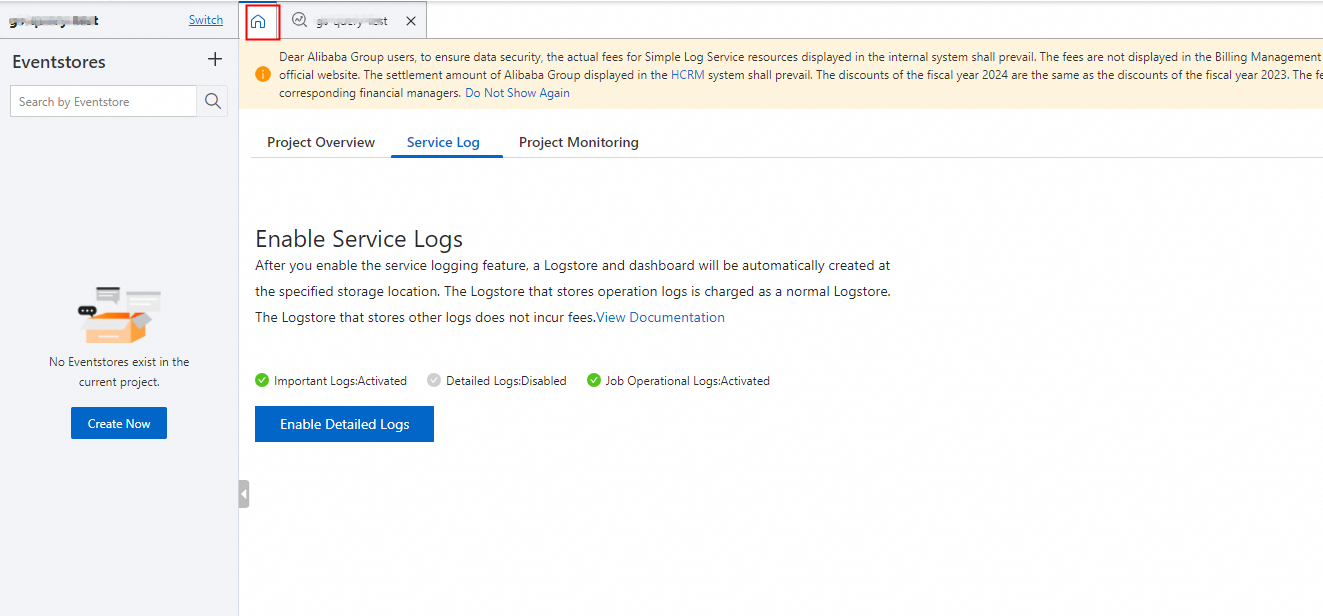
In the upper-left corner of the page that appears, click the
 icon.
icon. 
Go to the panel in which you can enable the service log feature for job operational logs.
If you did not enable the service log feature for detailed logs in the project, click Enable Detailed Logs on the Service Log tab.
If you enabled the service log feature for detailed logs in the project, click the
 icon on the Service Log tab.
Configure the parameters and click OK. The following table describes the parameters.
Parameter
Description
Job Operational Logs
If you turn on Job Operational Logs, Simple Log Service automatically creates a Logstore named internal-diagnostic_log in the project that you specify to store the operational logs and error logs of jobs such as Scheduled SQL jobs, MaxCompute data shipping jobs, Object Storage Service (OSS) data shipping jobs, and data import jobs. For more information about log fields, see Operational logs of Scheduled SQL jobs.
Log Storage Location
After you enable the service log feature for job operational logs, you must specify a project to store the logs. Valid values:
Automatic Creation (Recommended)
Current Project
Other projects in the same region as the current project
If a Scheduled SQL job fails after you enable the service log feature for job operational logs, you can view the error logs of the job in the internal-diagnostic_log Logstore of the specified project. The topic of the error logs is scheduled_sql_alert. You can check the log topic in the __topic__ field.
Step 2: Configure an action policy
Log on to the Simple Log Service console.
Go to the Action Policy page.
In the Projects section, click a project.
In the left-side navigation pane, click Alerts.
On the page that appears, choose .
Find the action policy whose ID is sls.app.scheduled_sql.builtin and click Edit in the Actions column.
You can also create an action policy to send alert notifications. For more information, see Create an action policy.
In the Edit Action Policy dialog box, change the value of the Request URL parameter to the webhook URL of your DingTalk chatbot. For other parameters, retain the default settings.
For more information about how to obtain the webhook URL of a DingTalk chatbot, see DingTalk-Custom. You can use other alert notification methods based on your business requirements. For more information, see Notification methods.
Click Confirm.
Step 3: Create an alert rule
Simple Log Service provides the following types of built-in alert rule templates. You need to only select a template based on your business requirements and create an alert rule from the template. You can configure similar parameters to create an alert rule regardless of which template is used. In this example, an alert rule is created from the ScheduledSQL Delay Monitor template.
ScheduledSQL Error Monitor: The system scans data at 5-minute intervals. If an error is detected in a Scheduled SQL job, an alert is triggered.
ScheduledSQL Delay Monitor: The system scans data at 5-minute intervals. If the latency of a Scheduled SQL job exceeds a threshold, an alert is triggered.
Log on to the Simple Log Service console.
In the Projects section, click the project that you want to manage.
Click the project to which the internal-diagnostic_log Logstore belongs.
In the left-side navigation pane, click Alerts.
On the Alert Rules tab, click the
 icon to the right of Create Alert.
 Click Create from Template.
In the Create from Template panel, click SLS Scheduled SQL.
Click ScheduledSQL Delay Monitor.
Configure the parameters of the alert rule.
If you have special requirements, such as monitoring a specific project or adjusting the trigger threshold, configure the parameters based on the instructions in Create an alert rule. Otherwise, retain the default settings for the parameters.
If you created an action policy in Step 2, specify the action policy for the Action Policy parameter. You can set the parameter to Simple Log Service Notification to find the parameter.
After the alert rule is created, view the alert rule in the list of alert rules. The alert rule is automatically enabled.
