Simple Log Service provides built-in alert rule templates for data shipping. If you want to monitor an Object Storage Service (OSS) data shipping job in real time, you need to only create an alert rule from a template. Then, you can receive alert notifications such as DingTalk messages. This topic describes how to create an alert rule.
Prerequisites
An OSS data shipping job is created. For more information, see Create an OSS data shipping job (new version).
Step 1: Enable the service log feature for job operational logs
Log on to the Simple Log Service console.
In the Projects section, click the project that you want to manage.
Click the project to which the OSS data shipping job belongs.
In the upper-left corner of the page, click the
 icon.
icon. Go to the panel in which you can enable the service log feature for job operational logs.
If you did not enable the service log feature for detailed logs in the project, click Enable Detailed Logs on the Service Log tab.
If you enabled the service log feature for detailed logs in the project, click the
 icon on the Service Log tab.
Configure the parameters and click OK. The following table describes the parameters.
Parameter
Description
Job Operational Logs
If you turn on Job Operational Logs, Simple Log Service automatically creates a Logstore named internal-diagnostic_log in the project that you specify to store the operational logs and error logs of jobs such as Scheduled SQL jobs, MaxCompute data shipping jobs, OSS data shipping jobs, and data import jobs. For more information about log fields, see Operational logs of data transformation (new version) jobs, data import jobs and data shipping (new version) jobs.
Log Storage Location
After you enable the service log feature for job operational logs, you must specify a project to store the logs. Valid values:
Automatic Creation (Recommended)
Current Project
Other projects in the same region as the current project
After you enable the service log feature for job operational logs, you can view the operational logs and error logs of OSS data shipping jobs in the internal-diagnostic_log Logstore of the specified project. The topic of the logs is etl_metrics. You can check the log topic in the __topic__ field. To query the operational logs and error logs of a specific data shipping job, you can execute a query statement in the
job_name:Job nameformat. Example:job_name:job-1646****946.
Step 2: Configure an action policy
Log on to the Simple Log Service console.
Go to the Action Policy page.
In the Projects section, click the target project.
In the left-side navigation pane, click Alerts.
On the page that appears, choose .
Find the action policy whose ID is sls.app.export.builtin and click Edit in the Actions column.
You can also create an action policy to send alert notifications. For more information, see Create an action policy.
On the Primary Action Policy tab of the Edit Action Policy dialog box, change the value of the Request URL parameter to the webhook URL of your DingTalk chatbot. For other parameters, retain the default settings.
For more information about how to obtain the webhook URL of a DingTalk chatbot, see DingTalk-Custom. You can use other alert notification methods based on your business requirements. For more information, see Notification methods.
Click Confirm.
Step 3: Create an alert rule
Simple Log Service provides five built-in alert rule templates for data shipping. You need to only select a template based on your business requirements and create an alert rule from the template. In this example, an alert rule is created from the Data Export Delay Monitor template.
Log on to the Simple Log Service console.
In the Projects section, click the project that you want to manage.
Click the project to which the internal-diagnostic_log Logstore belongs.
In the left-side navigation pane, click Alerts.
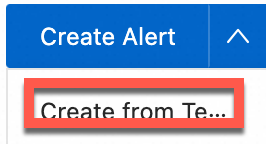
On the Alert Rules tab, click Create from Template.

In the panel that appears, click Data Export Delay Monitor to create an alert rule. For more information, see Configure an alert rule.
After the alert rule is created, view the alert rule in the list of alert rules. The alert rule is automatically enabled.

What to do next
After you create an alert rule for an OSS data shipping job, you can perform the following operations on the alert rule.
Operation | Description |
Disable an alert rule | If you disable an alert rule, the value in the Status column of the alert rule changes to Disabled, and alerts are no longer triggered based on the alert rule. The configurations of the alert rule are not deleted. If you want to enable the alert rule again, you do not need to reconfigure the parameters of the alert rule. |
Pause an alert rule | If you pause an alert rule, alerts are not triggered based on the alert rule within a specified period of time. |
Resume an alert rule | You can resume a paused alert rule based on your business requirements. |
Delete an alert rule | The configurations of the alert rule are deleted. The configurations include the Alibaba Cloud account that is used to create the alert rule. If you want to enable the alert rule again, you must reconfigure the parameters of the alert rule. |
Reconfigure an alert rule | You can reconfigure the parameters of an alert rule. |