pprof is a profiling tool of Go. It is used to analyze and improve the performance of Go programs and provides performance data on Go programs. Use the Kubernetes Golang Pull module of the Full-stack Observability application provided by Simple Log Service to collect performance data from all Go programs in a Kubernetes cluster in a convenient manner.
Full-stack Observability provides a commercial, self-developed agent for the Go language. This agent offers non-intrusive instrumentation with more features and greater stability. For more information, see Get started with Go application monitoring.
Prerequisites
A Full-stack Observability instance is created. For more information, see Create an instance.
A monitoring component is installed in a Kubernetes cluster. For more information, see Install a monitoring component.
NoteYou must use a Logtail image of v1.7.1.0-monitor-aliyun or later to install the monitoring component.
How it works
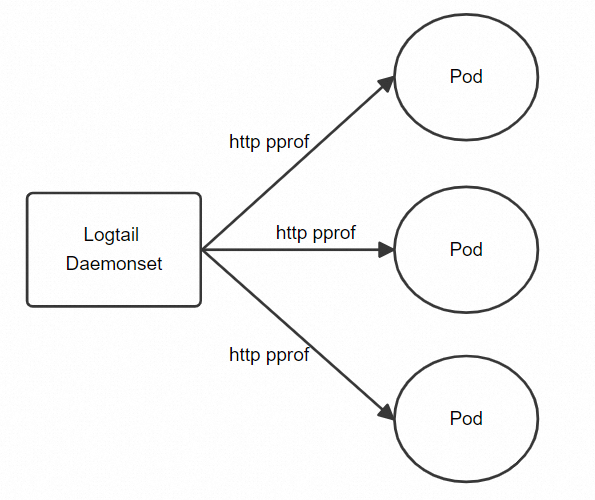
In Kubernetes clusters, the DaemonSet deployment model is used for both the component that collects performance data from Go programs and the component that collects logs. During log collection, Logtail supports Kubernetes resource selection from different dimensions. During performance data collection from Go programs, Logtail can also filter data using environment variables, Kubernetes labels, namespaces, pod names, and container names. The collection of performance data from Go programs involves the data of communication between Go processes, and Kubernetes resource selection may hit many unrelated processes. In this case, Logtail introduces a special environment variable named ILOGTAIL_PROFILE_PORT to further narrow down the data scope.
Go provides a built-in exposure mechanism for the performance data provided by pprof. After you enable the built-in exposure mechanism in a Go program, Logtail can obtain the performance data over HTTP.
Preparations
Enable an exposure mechanism for performance data.
Before you collect Go pprof performance data, you must enable the mechanism to expose the data from your Go program. Use the following code to enable the built-in exposure mechanism or create a custom one. Ensure that the pprof data is exposed at
{host}:{port}/debug/pprof/port. The following example exposes pprof performance data on port 8080.package main import ( "net/http" _ "net/http/pprof" ) func main() { // do something... _ = http.ListenAndServe(":8080", nil) }Configure the ILOGTAIL_PROFILE_PORT environment variable.
Set the ILOGTAIL_PROFILE_PORT environment variable to the port on which data is exposed. Example: ILOGTAIL_PROFILE_PORT=8080.
Create a Logtail configuration
Log on to the Simple Log Service console.
In the Log Application section, click the Intelligent O&M tab. Then, click Full-stack Observability.
On the Simple Log Service Full-stack Observability page, click the instance you want.
In the navigation pane on the left, click Performance Monitoring.
If this is your first time using Performance Monitoring for this instance, click Enable.
In the left-side navigation tree, click Data Collection. On the Data Import Configurations page, find Kubernetes Golang Pull.
The first time you create a Logtail configuration for host monitoring data, turn on the switch to go to the configuration page. If you created a Logtail configuration, click the
 icon to go to the configuration page.
 Click Use Existing Machine Groups.
After you install the monitoring component, Simple Log Service automatically creates a machine group named
{instanceID}-{clusterID}-k8s-nodes. Use this machine group directly.Select the target machine group (
{instanceID}-{clusterID}-k8s-nodes) from the source machine group list and move it to the applied machine group list. Then, click Next.ImportantIf the heartbeat status of the machine group is FAIL, click Automatic Retry. If the issue persists, see How do I troubleshoot an error that is related to a Logtail machine group in a host environment?
In the Configure Data Source step, configure the following parameters and click Complete.
Parameter
Description
General configurations
Configuration Name
The name of the Logtail configuration.
Cluster
Specify a name for the Kubernetes cluster.
After you configure this parameter, Simple Log Service adds a cluster=Cluster name tag to the performance data that is collected using the Logtail configuration.
ImportantMake sure that the cluster name is unique. Otherwise, data conflicts may occur.
Profile Whitelist
The type of data that you want to collect.
Collection Interval
The interval at which data is collected. Unit: seconds.
Timeout Period
The timeout period for data collection. Unit: seconds.
Maximum Body Size
The maximum size of data that can be collected. Unit: KB.
Kubernetes Selector configurations
Namespace
The regular expression that is used to match the names of namespaces. This parameter specifies the namespaces from which data is collected.
Pod Name
The regular expression that is used to match the names of pods. This parameter specifies the pods from which data is collected.
Container Name
The regular expression that is used to match the names of containers. This parameter specifies the containers from which data is collected.
Environment Variable Whitelist
The environment variable whitelist specifies the containers from which to collect data. By default, this parameter is empty, which means performance data is collected from all Kubernetes Go programs in all containers. If you configure the whitelist, the key is required and the value is optional.
If you leave the value empty, all containers that have an environment variable with the specified key are matched.
If you specify a value, only containers with an environment variable that is an exact key-value pair are matched.
By default, the value is matched as a string. A match is found only if the value is identical to the environment variable's value. If the value starts with
^and ends with$, it is treated as a regular expression. For example, set key to NGINX_SERVICE_PORT and value to ^(80|6379)$. This matches containers whose service port is 80 or 6379.
Key-value pairs are connected by using the OR operator. If a container has an environment variable that consists of one of the specified key-value pairs, the container is matched.
Environment Variable Blacklist
The environment variable blacklist specifies the containers from which data is not collected. By default, this parameter is empty, which means no containers are excluded. If you configure the blacklist, the key is required and the value is optional.
If you leave the value empty, all containers that have an environment variable with the specified key are excluded.
If you specify a value, only containers with an environment variable that is an exact key-value pair are excluded.
By default,
valueuses string matching, which requires the specifiedvalueto be identical to the value of the environment variable. If the value starts with^and ends with$, regular expression matching is used. For example, if you set the key to NGINX_SERVICE_PORT and set the value to ^(80|6379)$, the rule matches containers with a service port of 80 or 6379.
Key-value pairs are connected by using the OR operator. If a container has an environment variable that consists of one of the specified key-value pairs, the container is filtered out.
K8s Label Whitelist
The Kubernetes label whitelist specifies the containers from which to collect data. If you configure the whitelist, the key is required and the value is optional.
If you leave the value empty, all containers that have a Kubernetes label with the specified key are matched.
If you specify a value, only containers with a Kubernetes label that is an exact key-value pair are matched.
By default, the value is matched as a string. A match is found only if the value is identical to the Kubernetes label's value. If the value starts with
^and ends with$, it is treated as a regular expression. For example, set key to app and value to ^(test1|test2)$. This matches containers that have the Kubernetes label app:test1 or app:test2.
Key-value pairs are connected by using the OR operator. If a container has a Kubernetes label that consists of one of the specified key-value pairs, the container is matched.
K8s Label Blacklist
The Kubernetes label blacklist specifies the containers from which data is not collected. If you configure the blacklist, the key is required and the value is optional.
If you leave the value empty, all containers that have a Kubernetes label with the specified key are excluded.
If you specify a value, only containers with a Kubernetes label that is an exact key-value pair are excluded.
By default, `value` is matched as a string. This means a match occurs only if the `value` is identical to the value of the Kubernetes label. If the value starts with
^and ends with$, it is treated as a regular expression. For example, setting key to app and value to ^(test1|test2)$ matches containers with the Kubernetes labels `app:test1` or `app:test2`.
Key-value pairs are connected by using the OR operator. If a container has a Kubernetes label that consists of one of the specified key-value pairs, the container is filtered out.
Container Label Whitelist
The container label whitelist specifies the containers from which to collect data. By default, this parameter is empty, which means performance data is collected from all Kubernetes Go programs in all containers. If you configure the whitelist, the key is required and the value is optional.
If you leave the value empty, all containers that have a container label with the specified key are matched.
If you specify a value, only containers with a container label that is an exact key-value pair are matched.
By default, the value is matched as a string. A match is found only if the value is identical to the container label's value. If the value starts with
^and ends with$, it is treated as a regular expression. For example, set key to io.kubernetes.container.name and value to ^(nginx|cube)$. This matches containers named nginx or cube.
Key-value pairs are connected by using the OR operator. If a container has a container label that consists of one of the specified key-value pairs, the container is matched.
Container Label Blacklist
The container label blacklist specifies the containers from which data is not collected. By default, this parameter is empty, which means no containers are excluded. If you configure the blacklist, the key is required and the value is optional.
If you leave the value empty, all containers that have a container label with the specified key are excluded.
If you specify a value, only containers with a container label that is an exact key-value pair are excluded.
By default, the `value` is used for an exact string match against the container's label value. If the value starts with
^and ends with$, it is treated as a regular expression. For example, if you set key to io.kubernetes.container.name and value to ^(nginx|cube)$, this configuration matches containers named `nginx` or `cube`.
Key-value pairs are connected by using the OR operator. If a container has a container label that consists of one of the specified key-value pairs, the container is filtered out.
After you complete the configuration, Simple Log Service automatically creates assets such as Metricstores. For more information, see Assets.
Next steps
After you collect the pprof performance data from Go programs to Full-stack Observability, use the performance monitoring feature to troubleshoot performance issues. For more information, see Data query and Data comparison.