Serverless App Engine (SAE) is an easy-to-use, fully-managed, and highly-elastic platform that provides application hosting with zero code modification. You do not need to manage or maintain the underlying infrastructure, such as IaaS and Kubernetes. You can deploy an online application in any programming language to SAE within seconds by using source code, a code package, or a Docker image. SAE can automatically scale applications by adjusting the number of instances. You are charged based on the resources that you use. SAE also provides multiple supporting capabilities such as logging, monitoring, and load balancing.
Service architecture
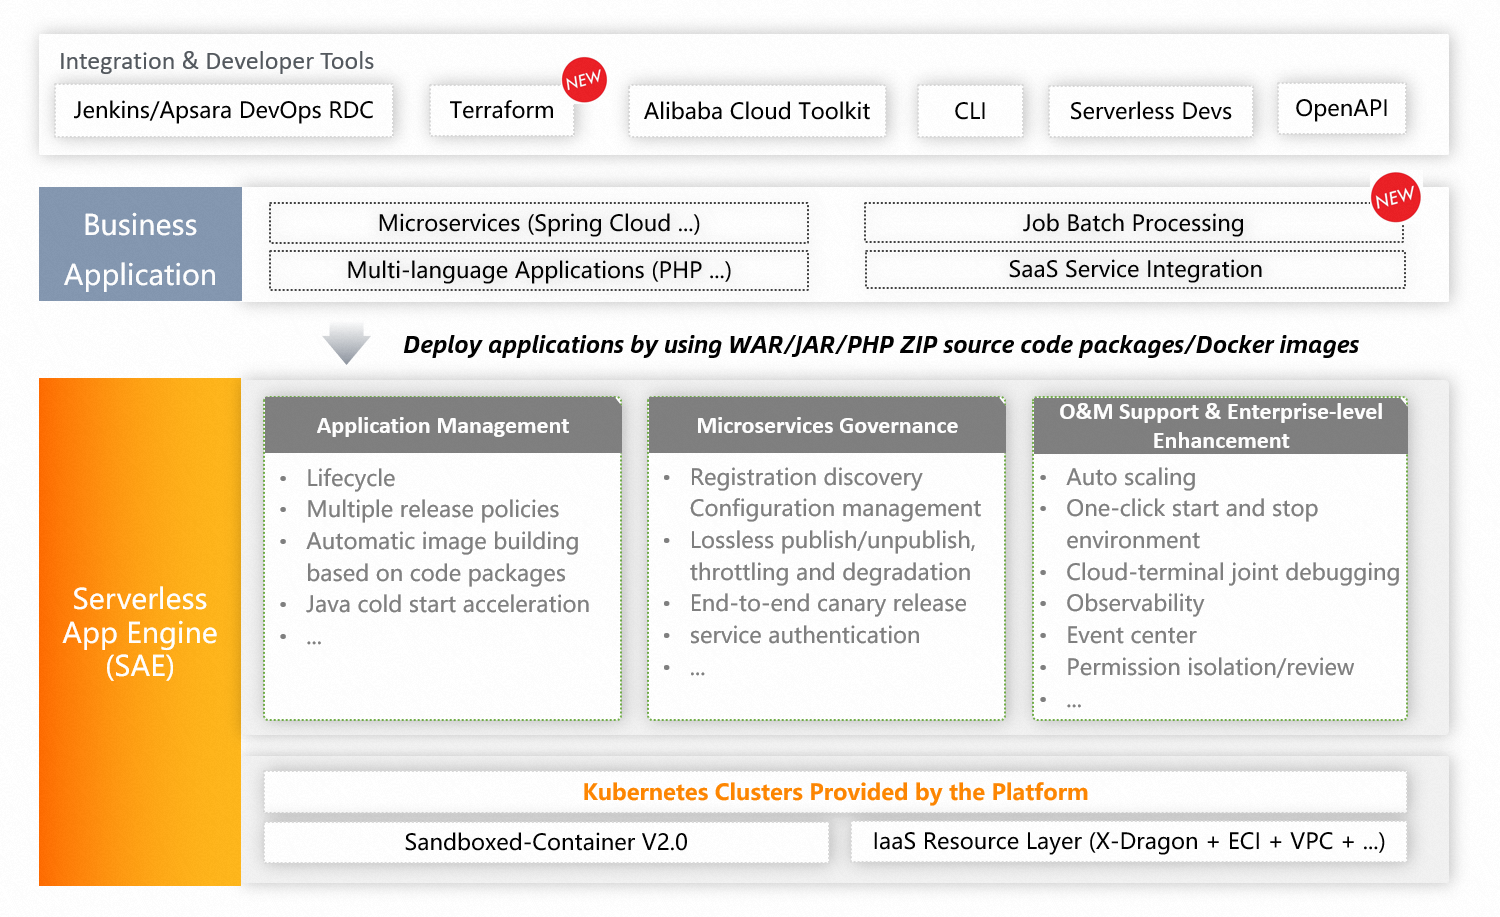
The following figure shows the architecture of SAE. For more information, see Terms.

SAE is developed based on Kubernetes to combine the serverless architecture and microservices frameworks.
SAE supports various microservices frameworks, such as Spring Cloud, Apache Dubbo, and HSF. SAE supports various deployment channels, such as UI, Alibaba Cloud DevOps, and extensions, and various deployment methods, such as WAR packages, JAR packages, ZIP packages, and images. SAE also supports various programming languages, such as Java, PHP, and Python.
Features
Feature | Description |
Application lifecycle management | SAE provides application lifecycle management. You can implement different release policies such as phased release and canary release. The traffic-ratio-based canary release model is also supported. The release process is fully observable and can be rolled back. |
Engineering platform | You can deploy applications within seconds to SAE by using source code, WAR packages, or JAR packages. SAE supports automatic continuous delivery (CD). SAE provides multiple modules to help developers efficiently deliver applications, such as application templates, CLI, component library, and cost manager. |
Non-intrusive microservices governance | You can migrate Spring Cloud and Dubbo microservices applications to SAE without the need to modify code. SAE provides multiple microservices governance capabilities, such as service registration and discovery, environment isolation, configuration management, throttling and degradation, graceful start and shutdown, service authentication, and end-to-end canary release. |
Ultrahigh elasticity | SAE can perform auto scaling within seconds. SAE allows you to configure multiple types of auto scaling policies and auto scaling metrics, such as CPU, Mem, queries per second (QPS), response time, TCP connections, and SLB QPS. |
Application cold start acceleration | SAE supports cold start acceleration that allows you to start Java applications within seconds. This reduces system resource consumption and improves the efficiency of application deployment, scaling, and runtime. |
One-click startup and stop of environments | If application instances are retained in the idle test environments of large and medium-sized enterprises, a large number of resources are wasted. SAE provides namespaces to help you logically isolate runtime environments. You can start and stop development and test environments with a few clicks. This helps reduce hardware costs. |
Non-intrusive application monitoring | SAE provides non-intrusive application monitoring and alerting capabilities based on the Extended Berkeley Packet Filter (eBPF) technology for multiple programming languages and frameworks. SAE supports monitoring on Layer 7 inbound traffic, Java applications, and traces to help you quickly identify and diagnose issues. |
Remote debugging and interconnection between on-premises and cloud services | SAE supports remote debugging for diagnosing Java applications deployed in SAE. You can also subscribe to on-premises services and register the services in the SAE built-in registry. Operations can be called between on-premises and cloud microservices. |
Billing
For more information about the billing of SAE, see Billing overview.
References
Topic | Description |
Describes the scenarios for which SAE is suitable, including application hosting, microservices model transformation, auto scaling, and continuous integration and delivery. | |
Describes the features of SAE and how to use SAE to help you quickly get started with SAE. This topic also provides multiple best practices. | |
If you have any questions or suggestions when you use SAE, search for and join the DingTalk group to contact us. |