During daily O&M, you can learn about the performance issues and related O&M operations of your ApsaraDB RDS for MySQL instance in a comprehensive manner by viewing the events such as exceptions, optimization events, and auto scaling events. This topic describes how to use the autonomy center feature that is provided by Database Autonomy Service (DAS) to view the details and statistics of the events in real time.
Prerequisites
Your RDS instance runs one of the following MySQL versions and RDS editions:
MySQL 8.0 on RDS High-availability Edition, RDS Enterprise Edition, or RDS Cluster Edition
MySQL 5.7 on RDS High-availability Edition, RDS Enterprise Edition, or RDS Cluster Edition
MySQL 5.6 on RDS High-availability Edition
MySQL 5.5 on RDS High-availability Edition
Background information
DAS monitors the core metrics of your RDS instance to detect anomalies. If an anomaly is detected, DAS checks sessions, SQL statements, and the capacity of the RDS instance to identify the cause. DAS also provides suggestions on how to optimize performance or mitigate the loss. You can authorize DAS to automatically optimize performance or mitigate the loss.
Procedure
- Go to the Instances page. In the top navigation bar, select the region in which the RDS instance resides. Then, find the RDS instance and click the ID of the instance.
In the left-side navigation pane, choose Autonomy Services > Diagnostics.
Click the Autonomy Center tab.
In the upper-right corner of the Autonomy Center tab, click Autonomy Service Settings.
On the , enable the autonomy service and click OK.
View events that occurred within a specified time range.
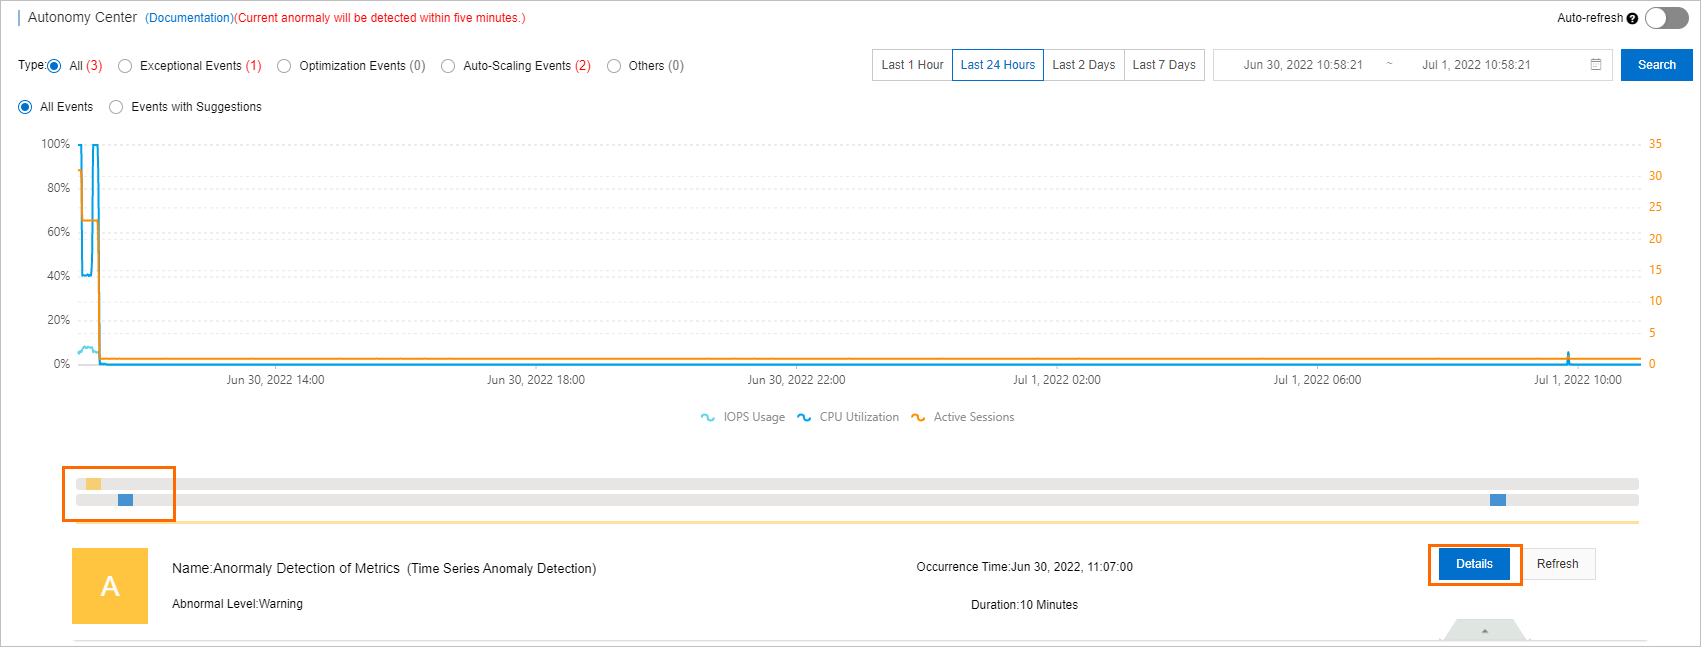
In the trend chart, view the duration of a specific event and the trends of the CPU Utilization, Active Sessions, and IOPS Usage parameters of the RDS instance when the event occurred.
Find the event that you want to view and click Details.

References
You can view the following events that are triggered by the autonomy center feature: