The latest version of Quick BI (>=V4.6.1) supports the online editing mode of custom components. In this mode, the development and debugging of custom components will be performed in the page. In this mode, the "Insert Echarts Code" feature allows you to quickly add the sample component code from the Echarts official website to custom components for secondary development or demonstration. This topic describes how to use this feature.
I. Enter the online editor
Create a custom component and enter the edit mode. For more information, see Debug components.
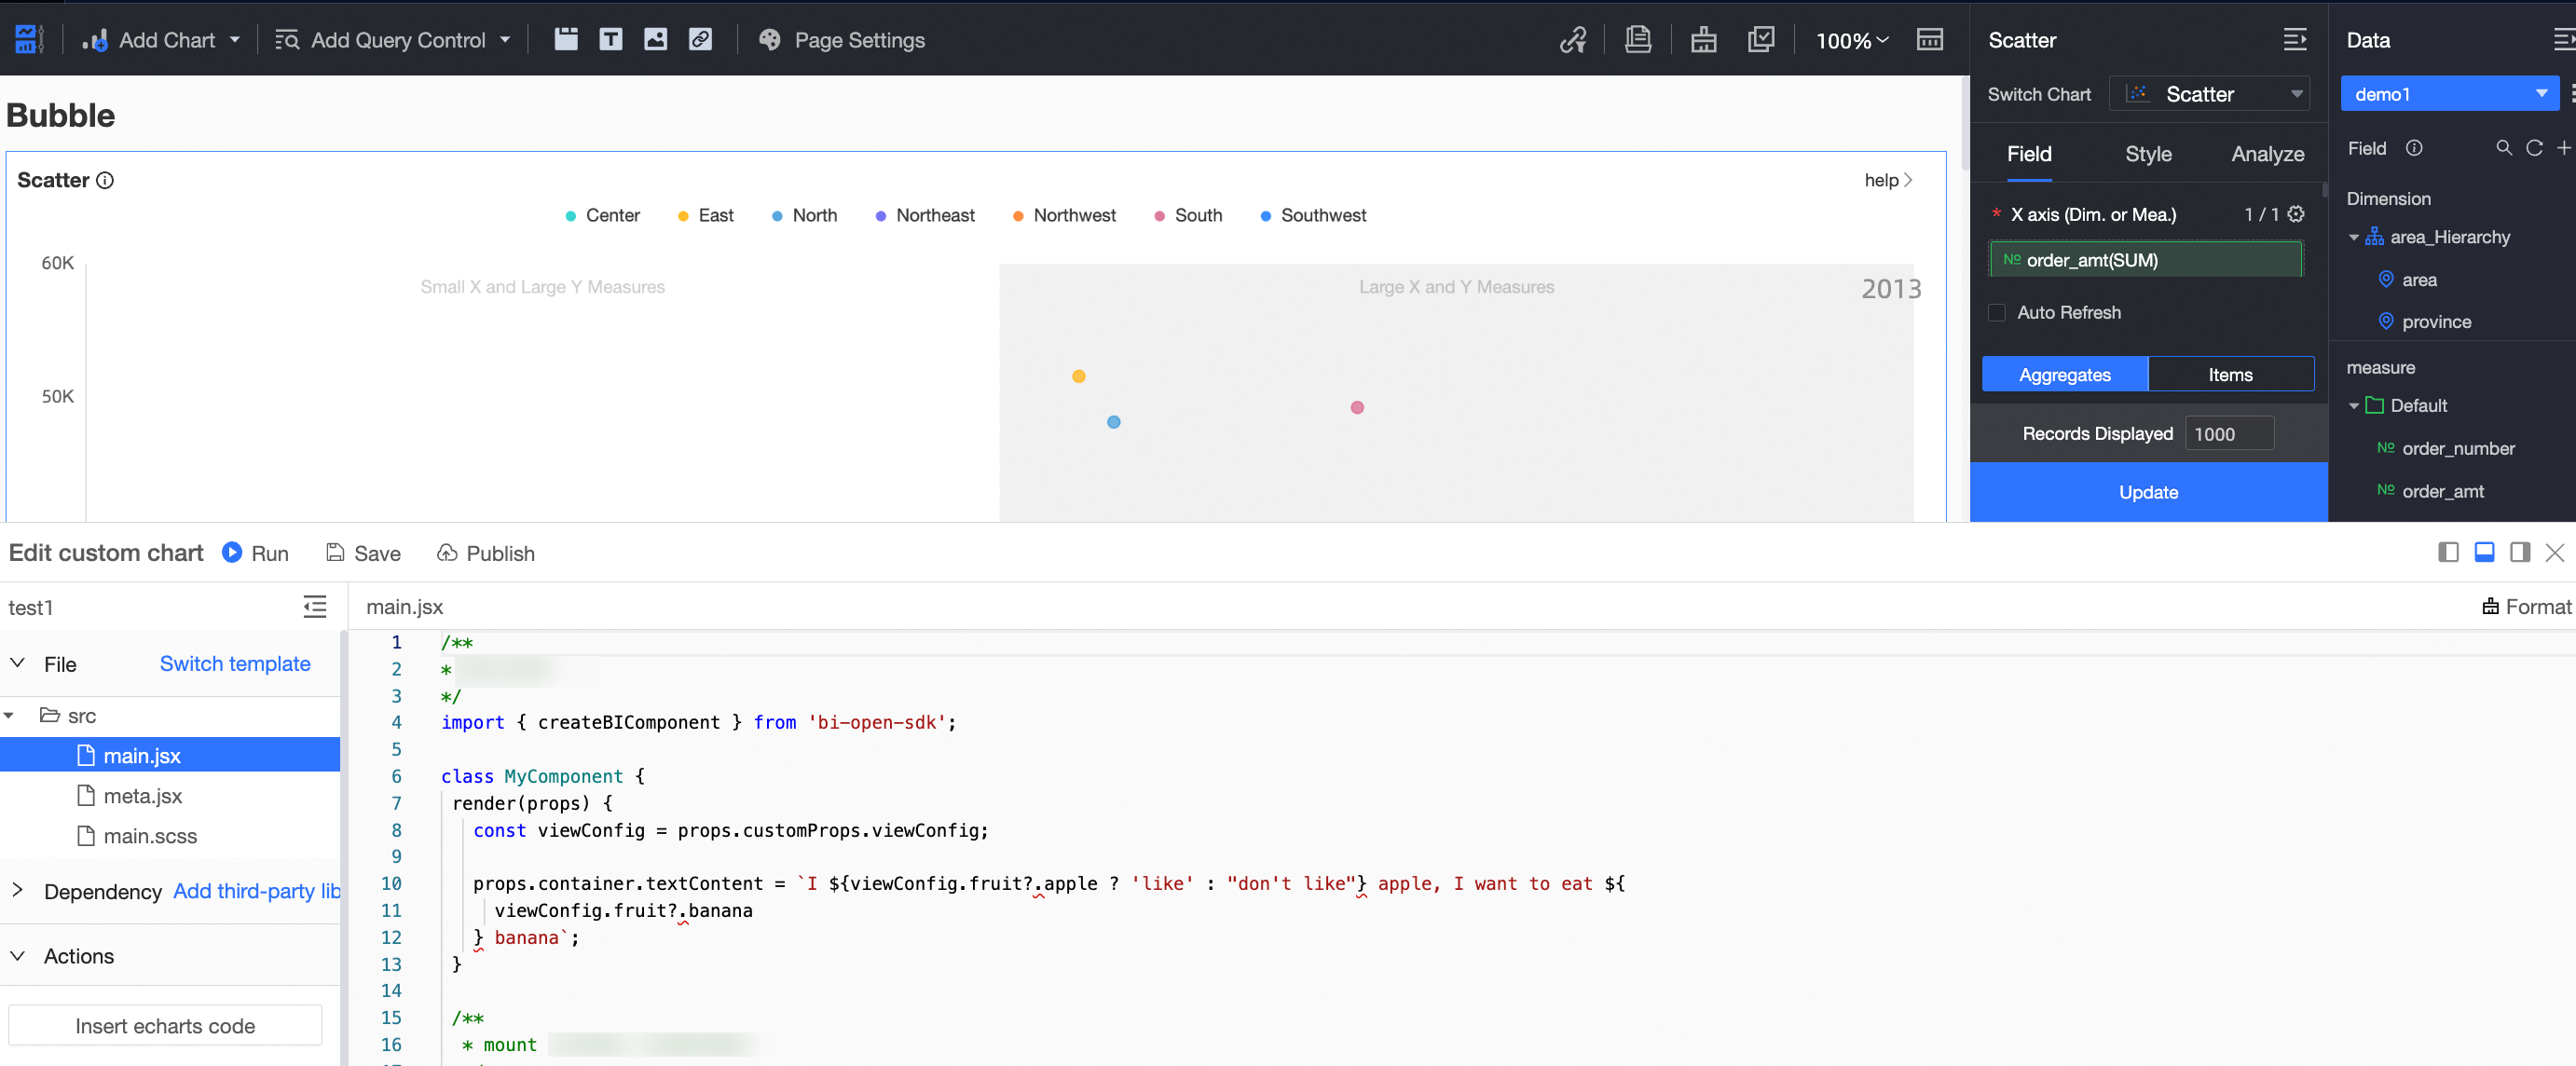
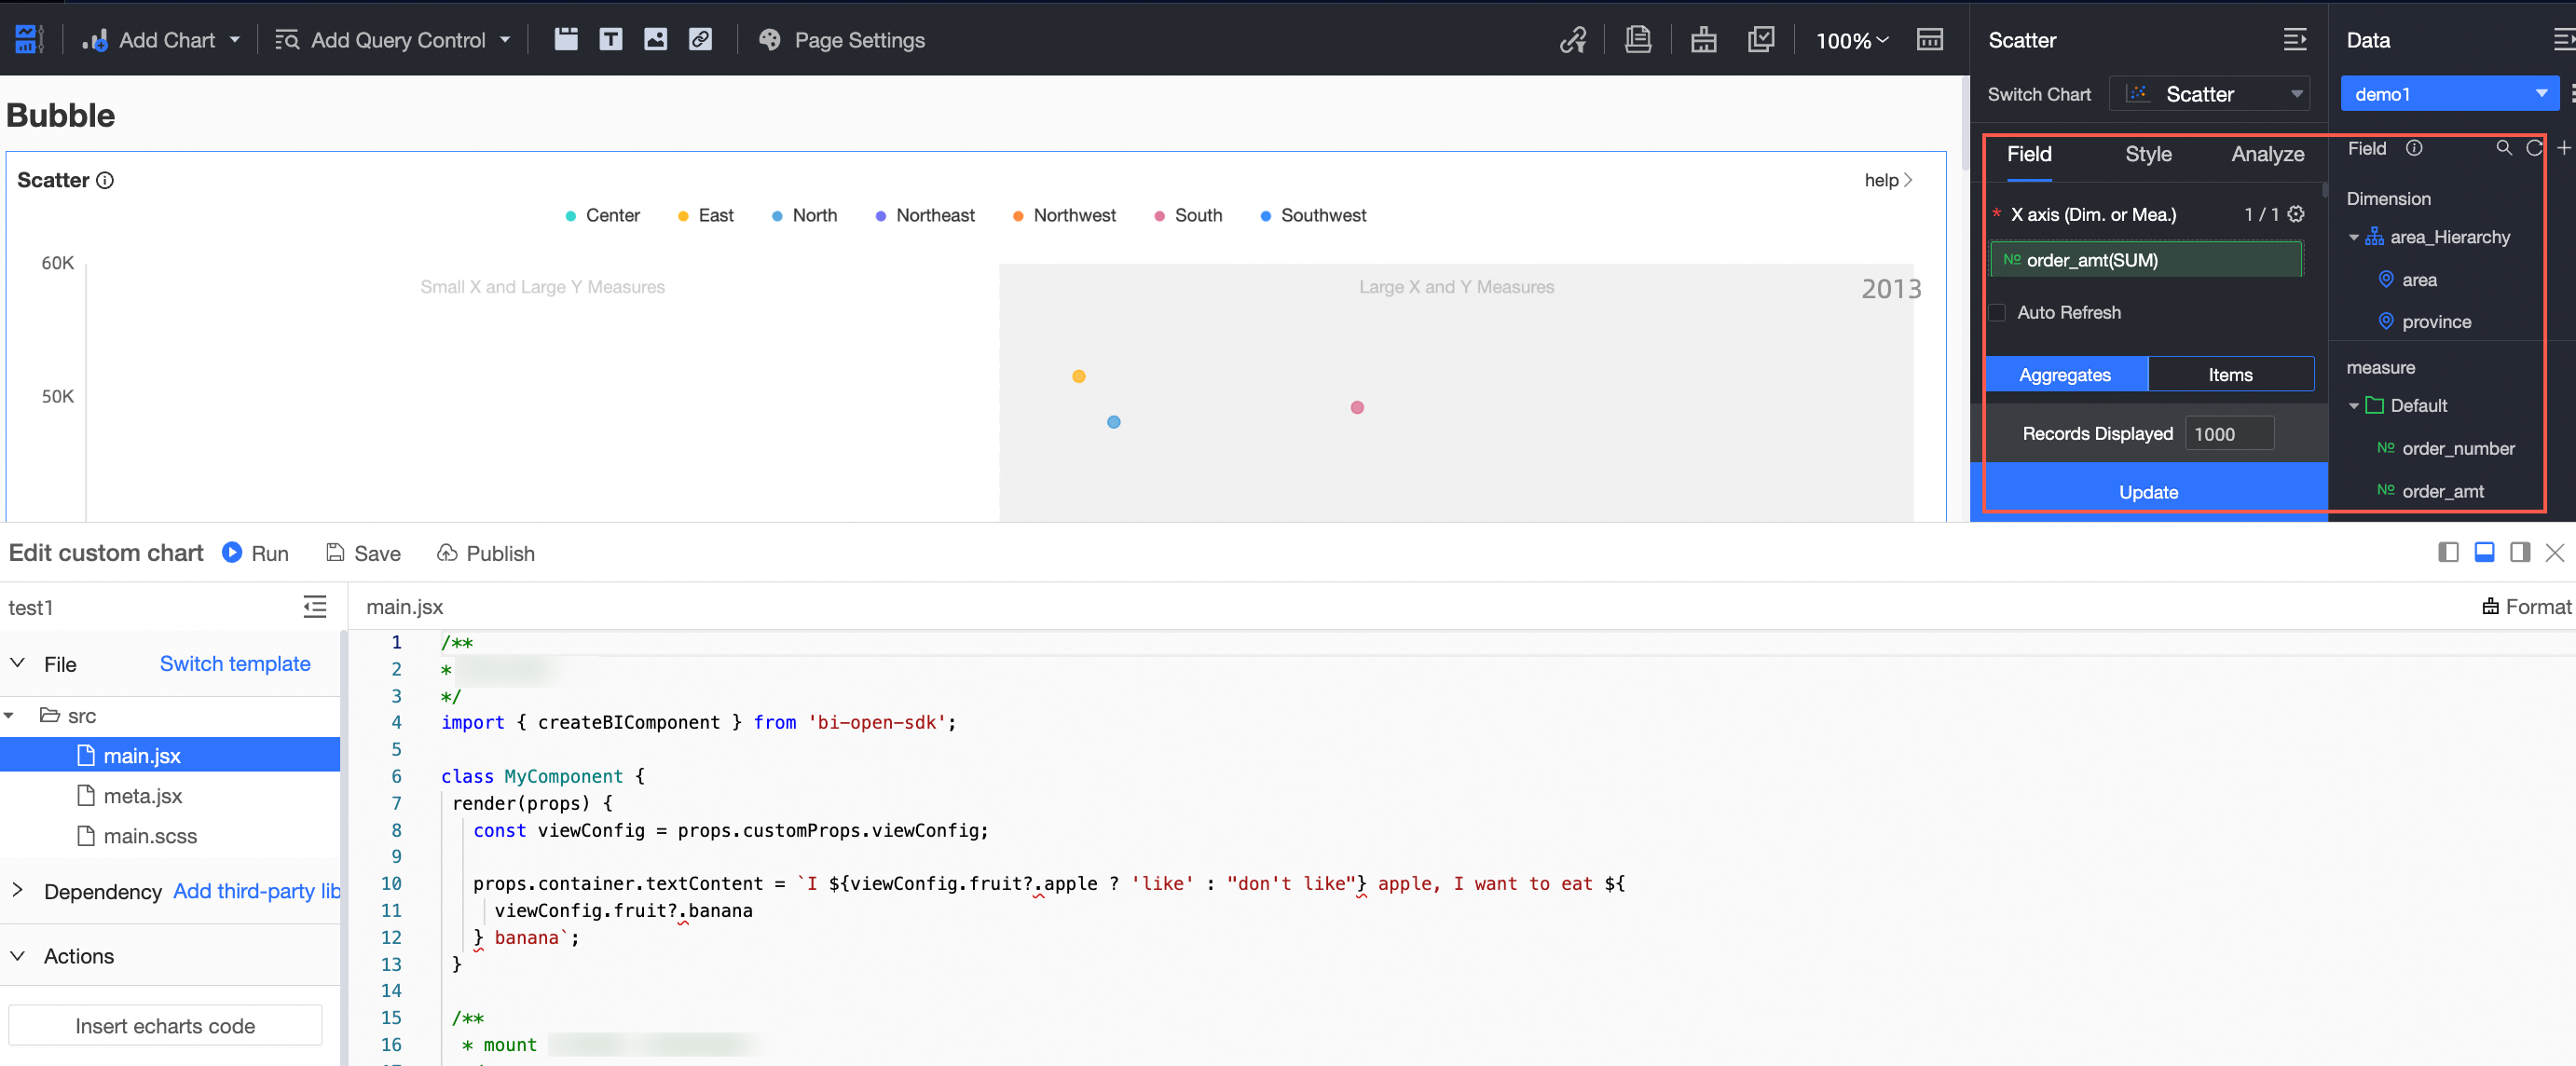
Configure the field information and complete the retrieval.
2. Obtain the sample code of charts
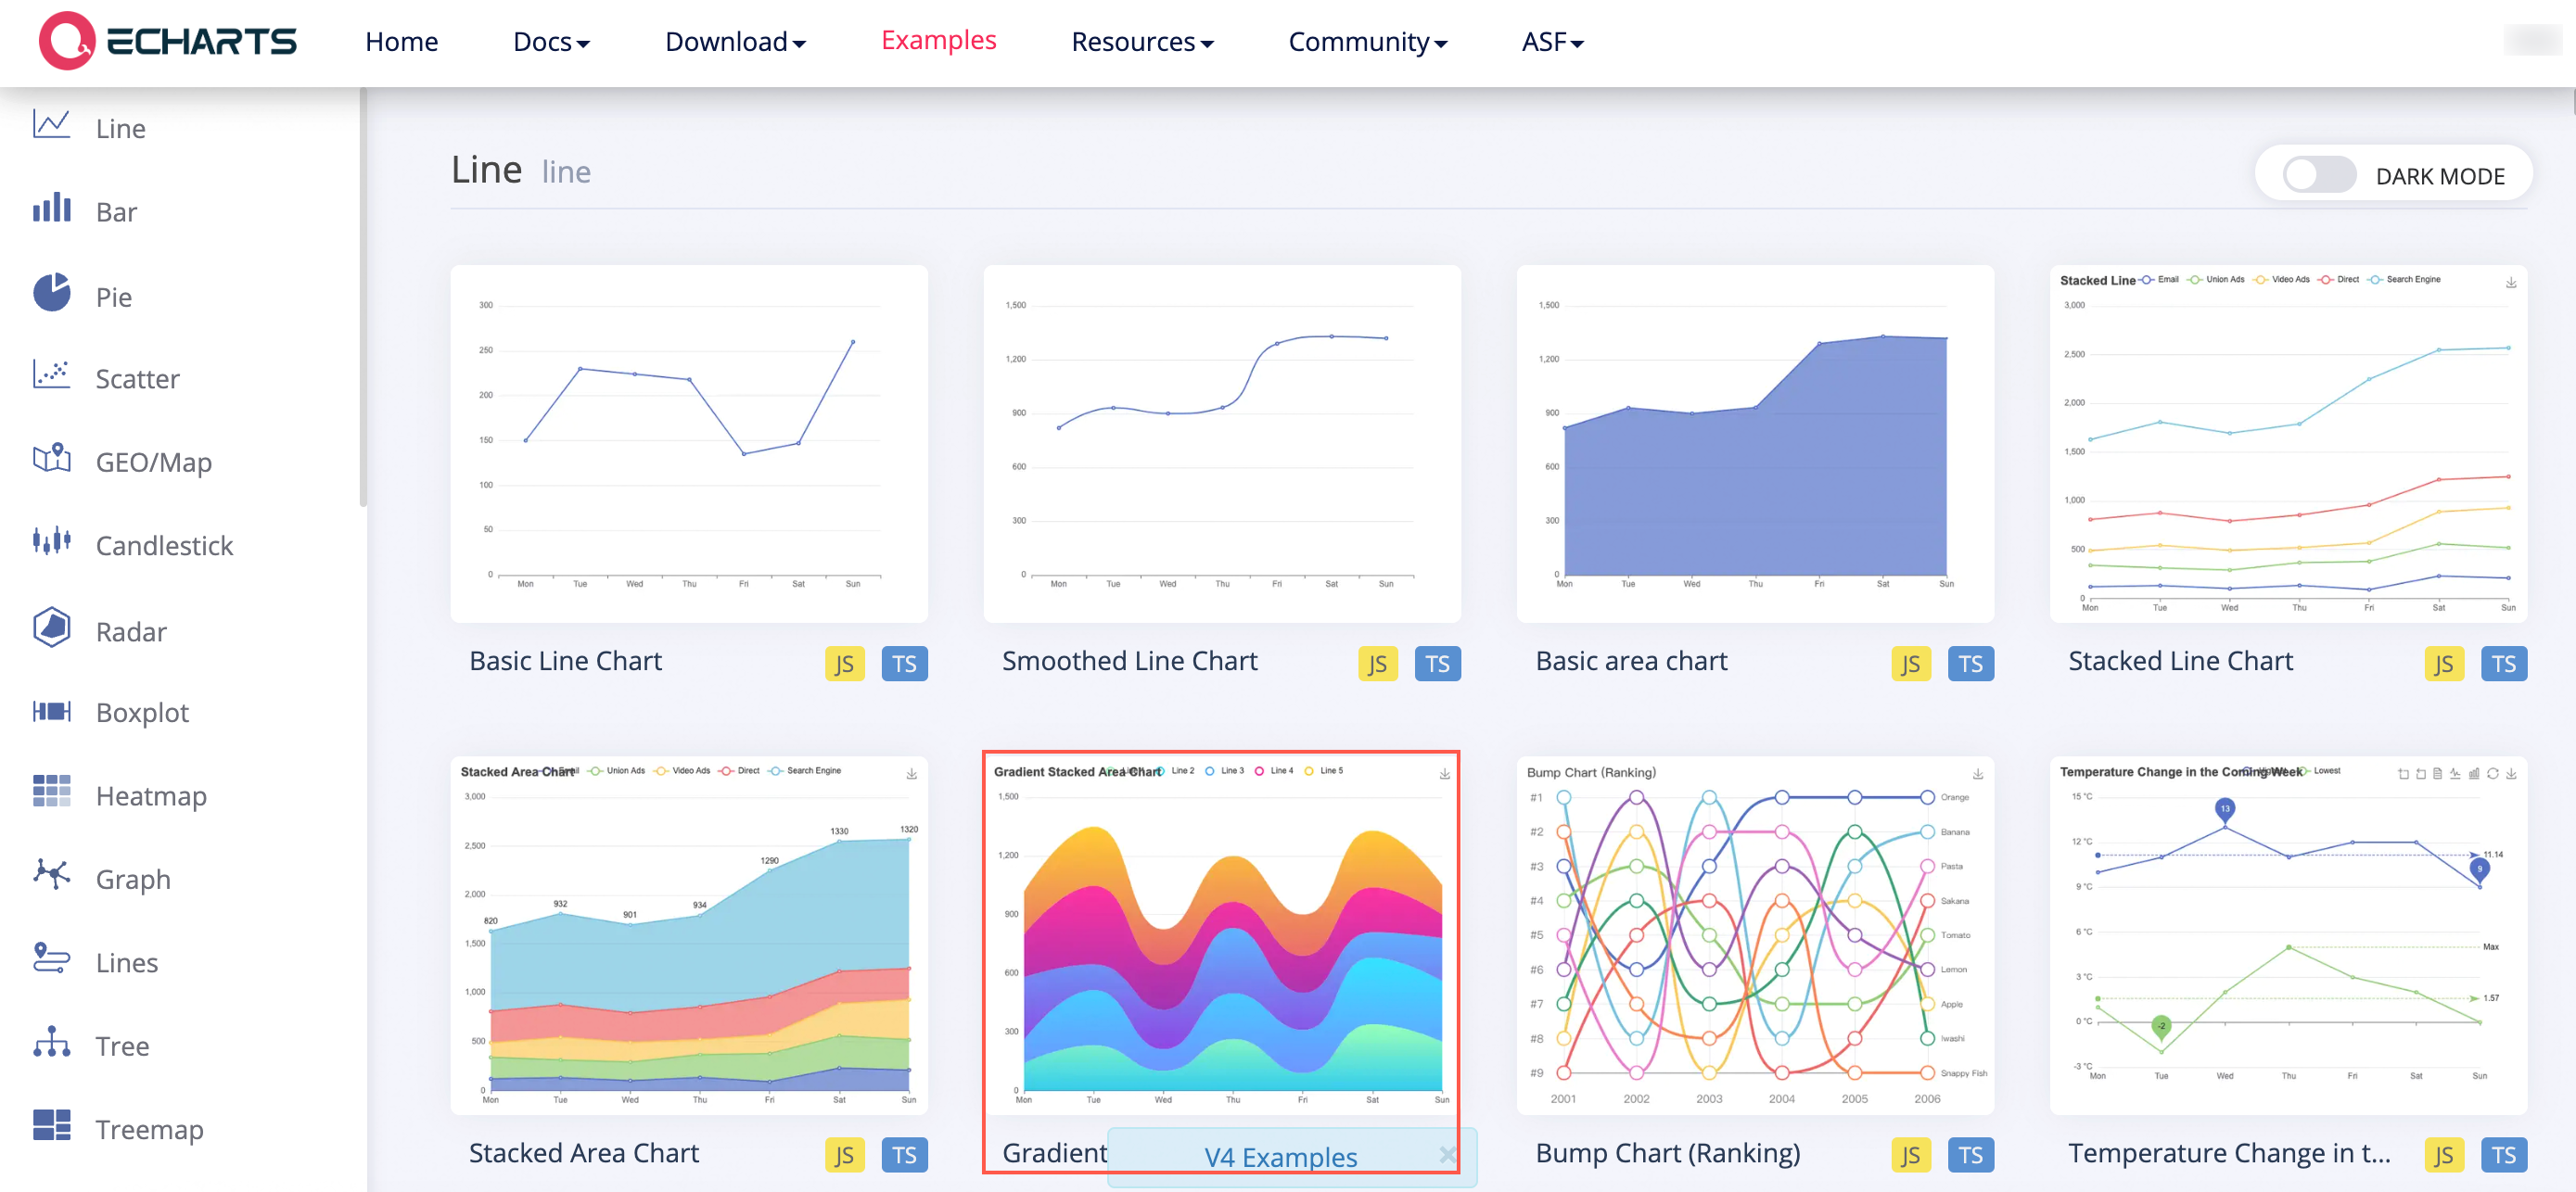
Go to the echarts example and pick the example graph.
Click to enter the code details page, select the "code edit" card and "JS" option, select all the codes on the left and copy them to obtain the option configuration.
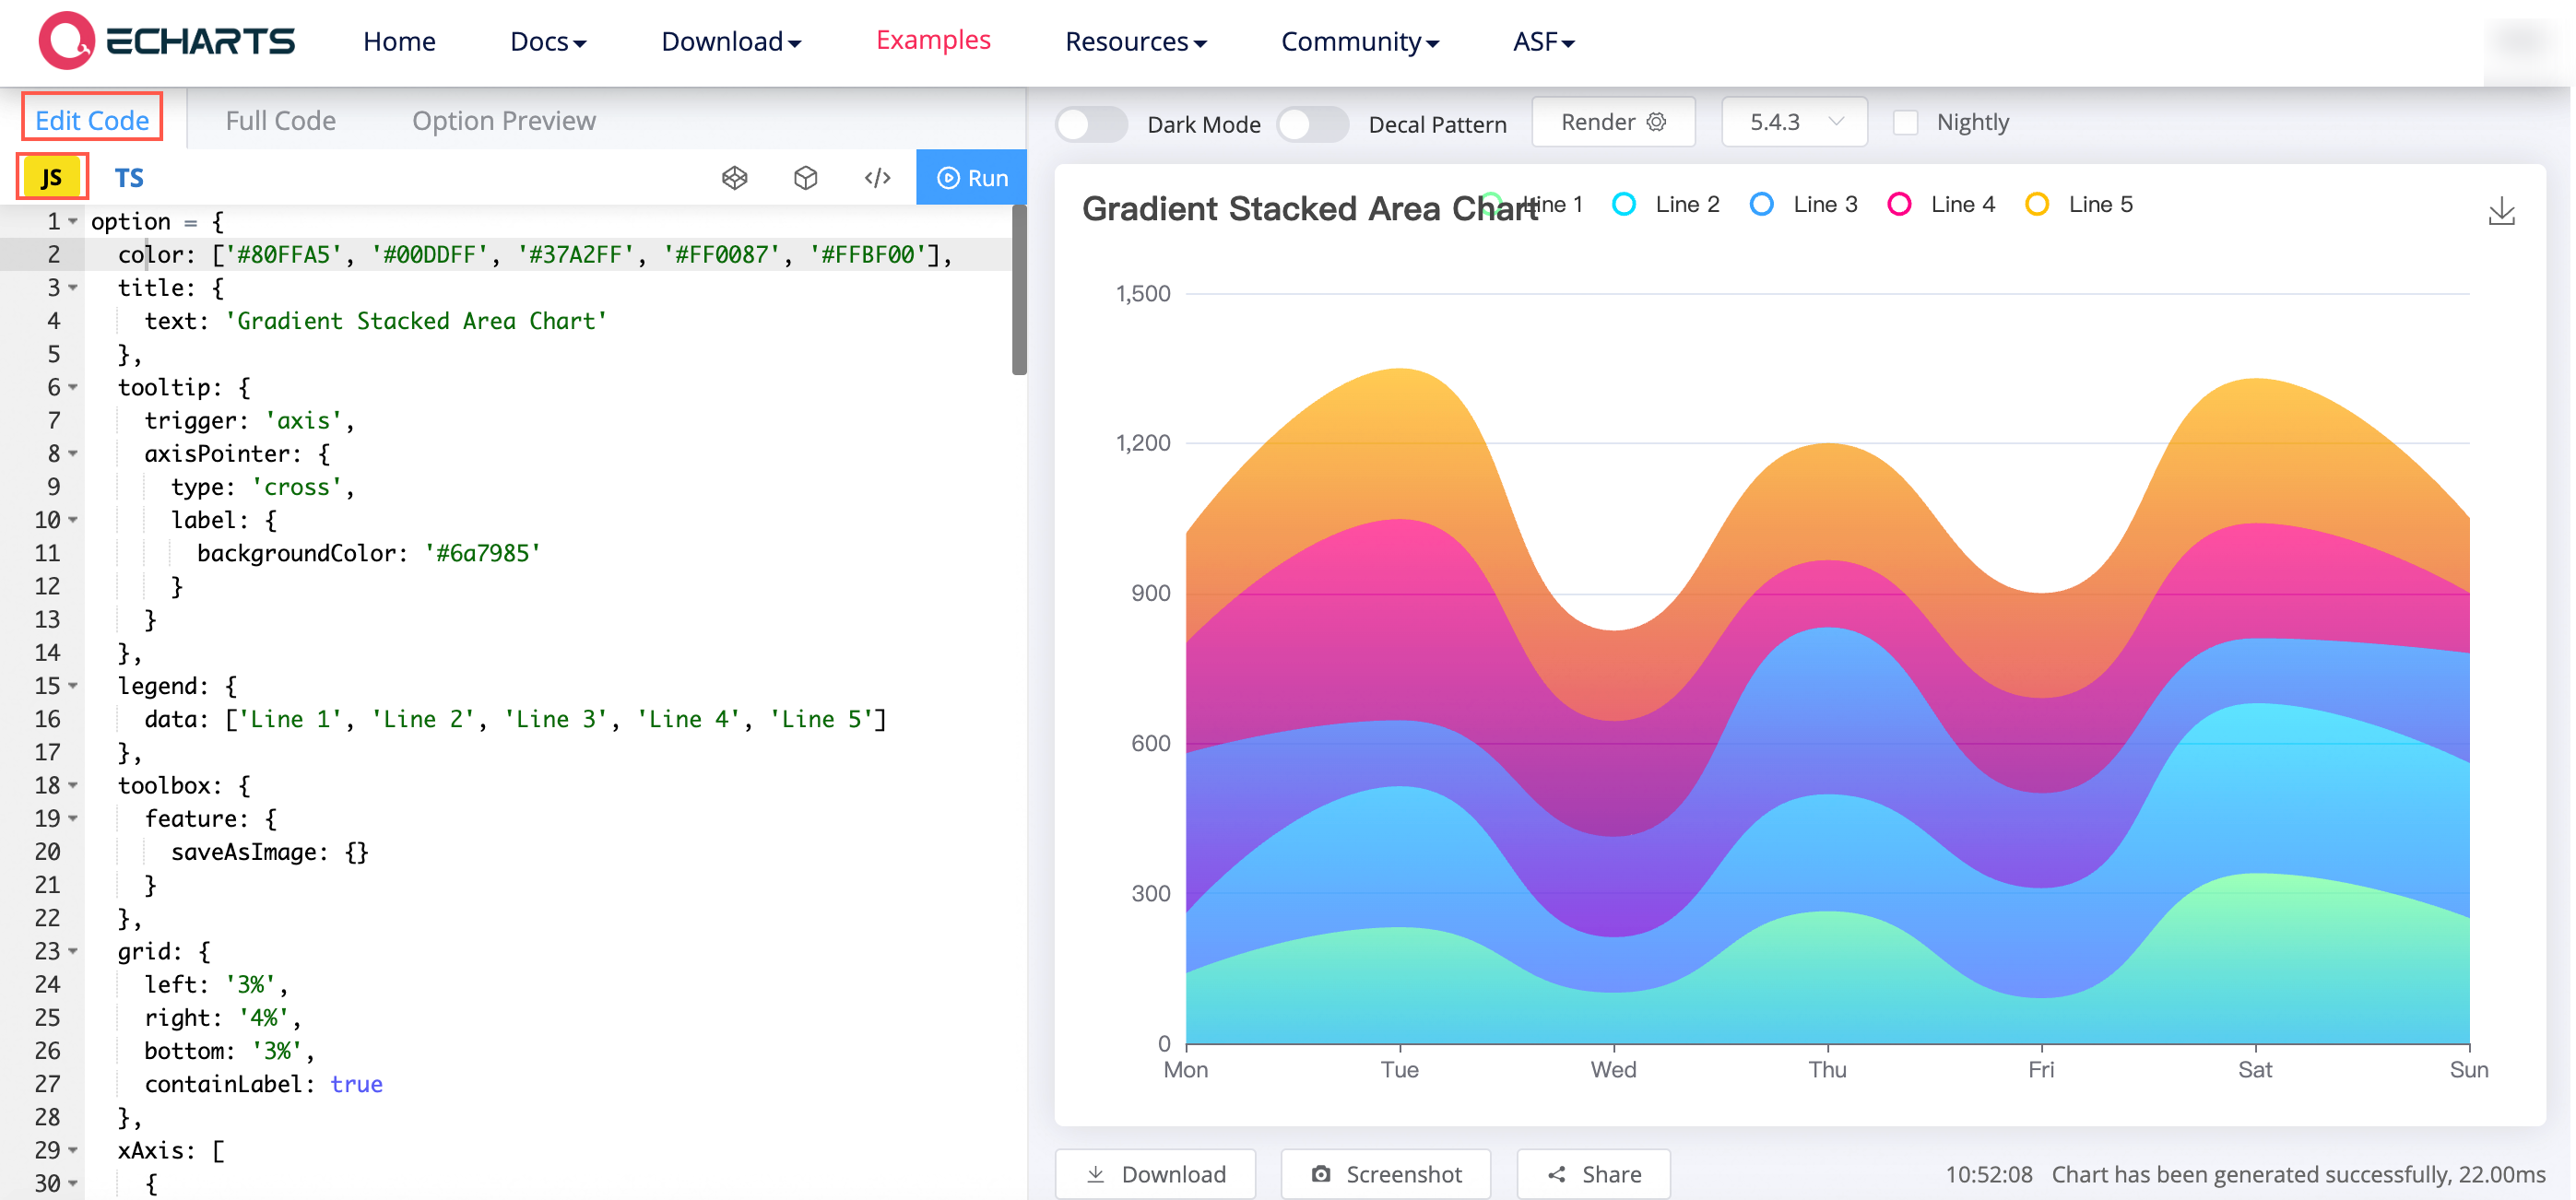
It should be noted that the "Insert echarts Code" function receives the option configuration variable of echarts, and the generated code can be viewed in detail. Therefore, when copying the code, it is necessary to see whether this variable is option = {...} (most sample codes on echarts official website can be copied directly). If you encounter non-standard situations, you need to check the code specifically and copy the option = {...} variables in it.
III. Generate Code
1. Add dependencies
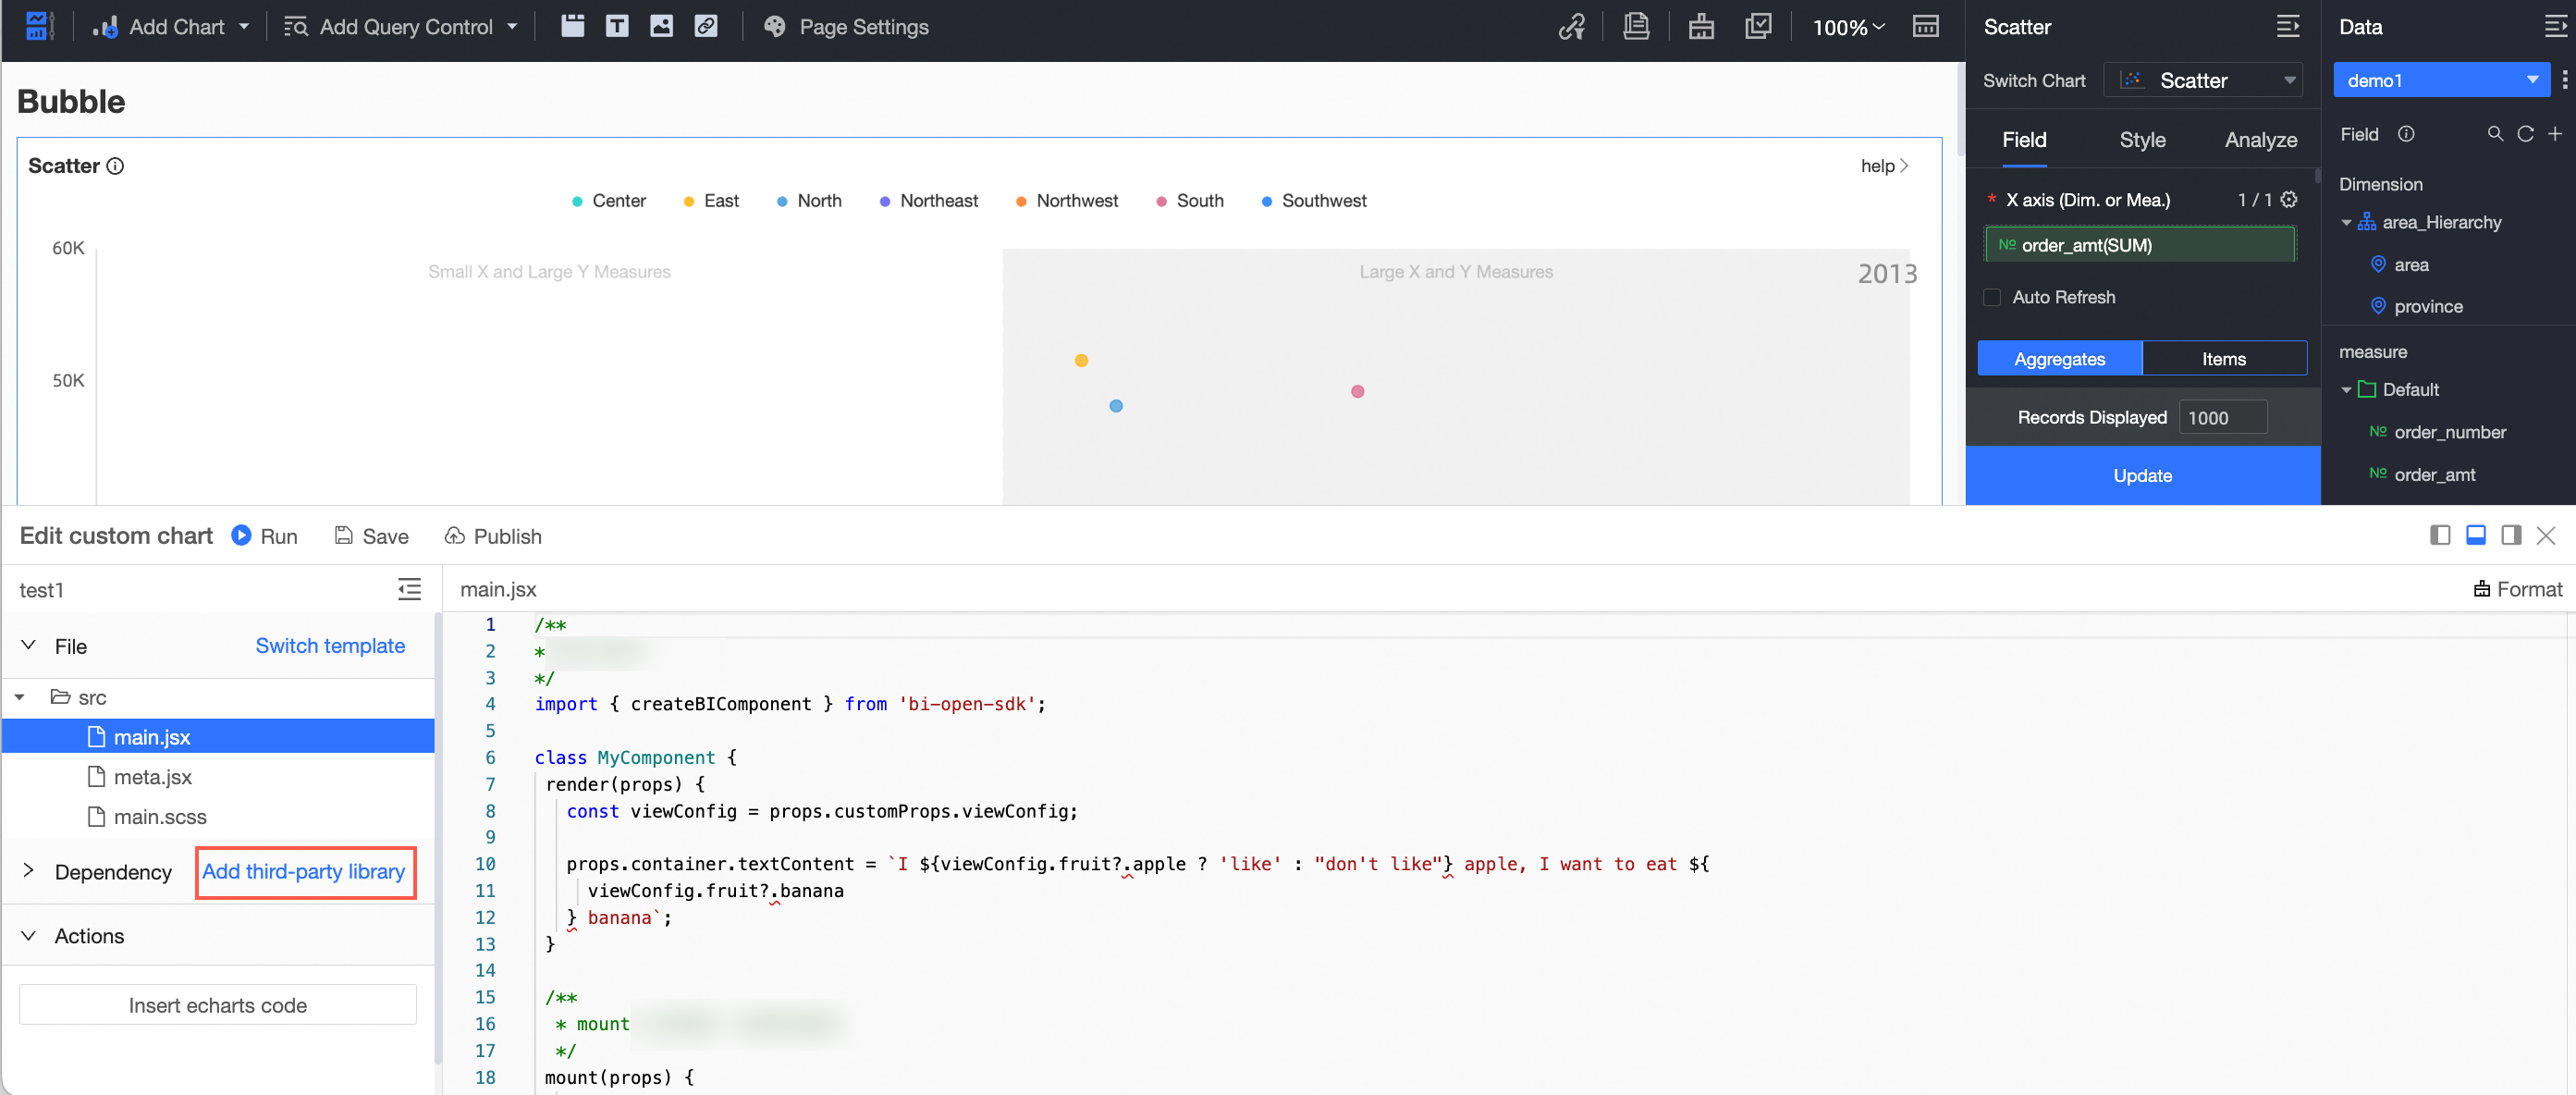
Click "Add Third Party Library".
Select echarts.
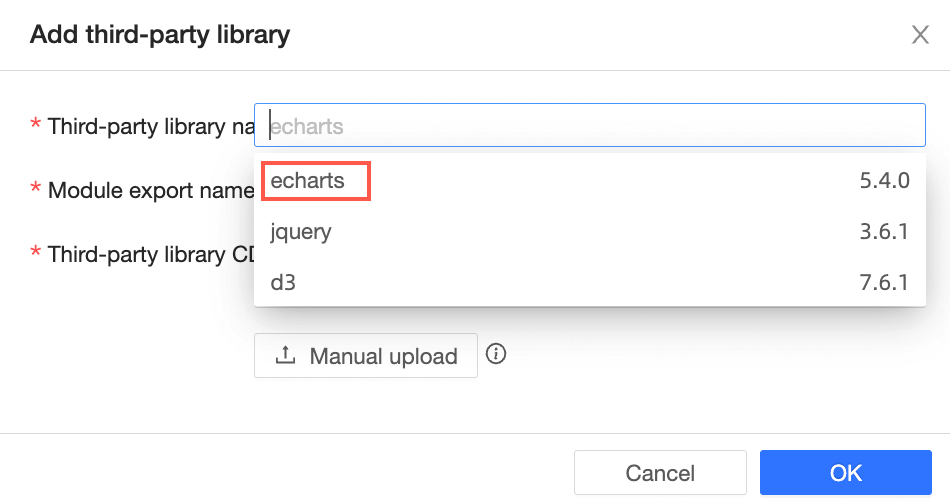
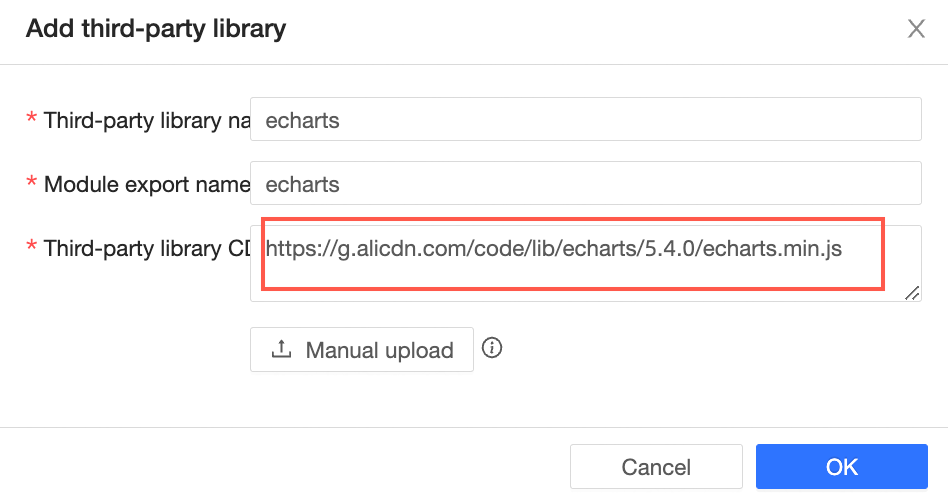
echarts V5.4.0 is preset in the Quick BI. if you need other versions of echarts, you can enter the Alibaba Cloud Content Delivery Network path or manually upload the js library.
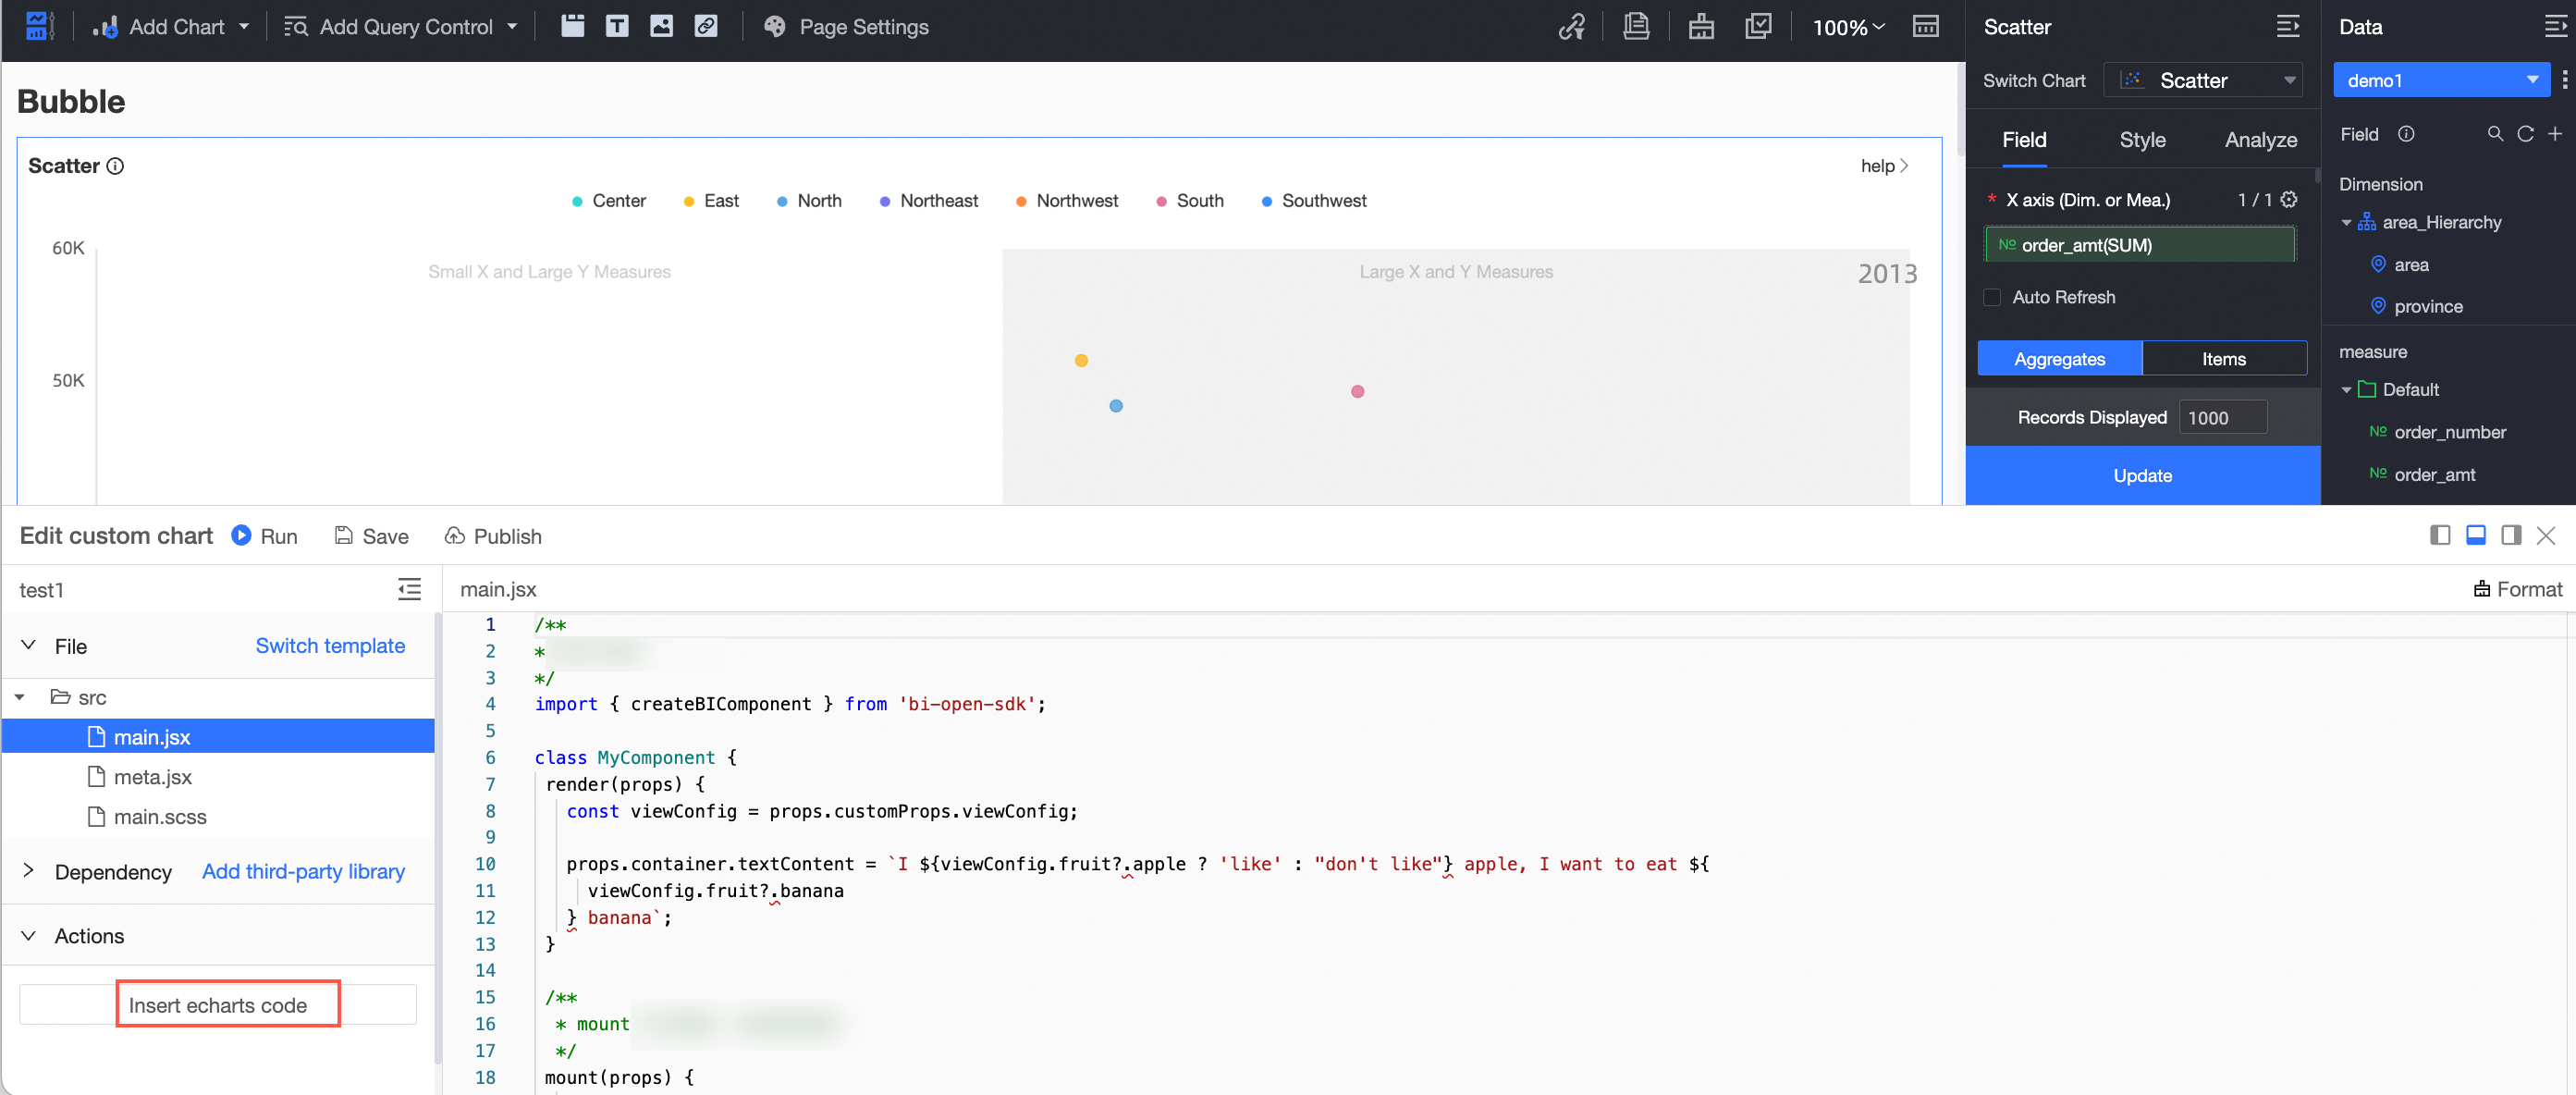
2. Insert the echarts code
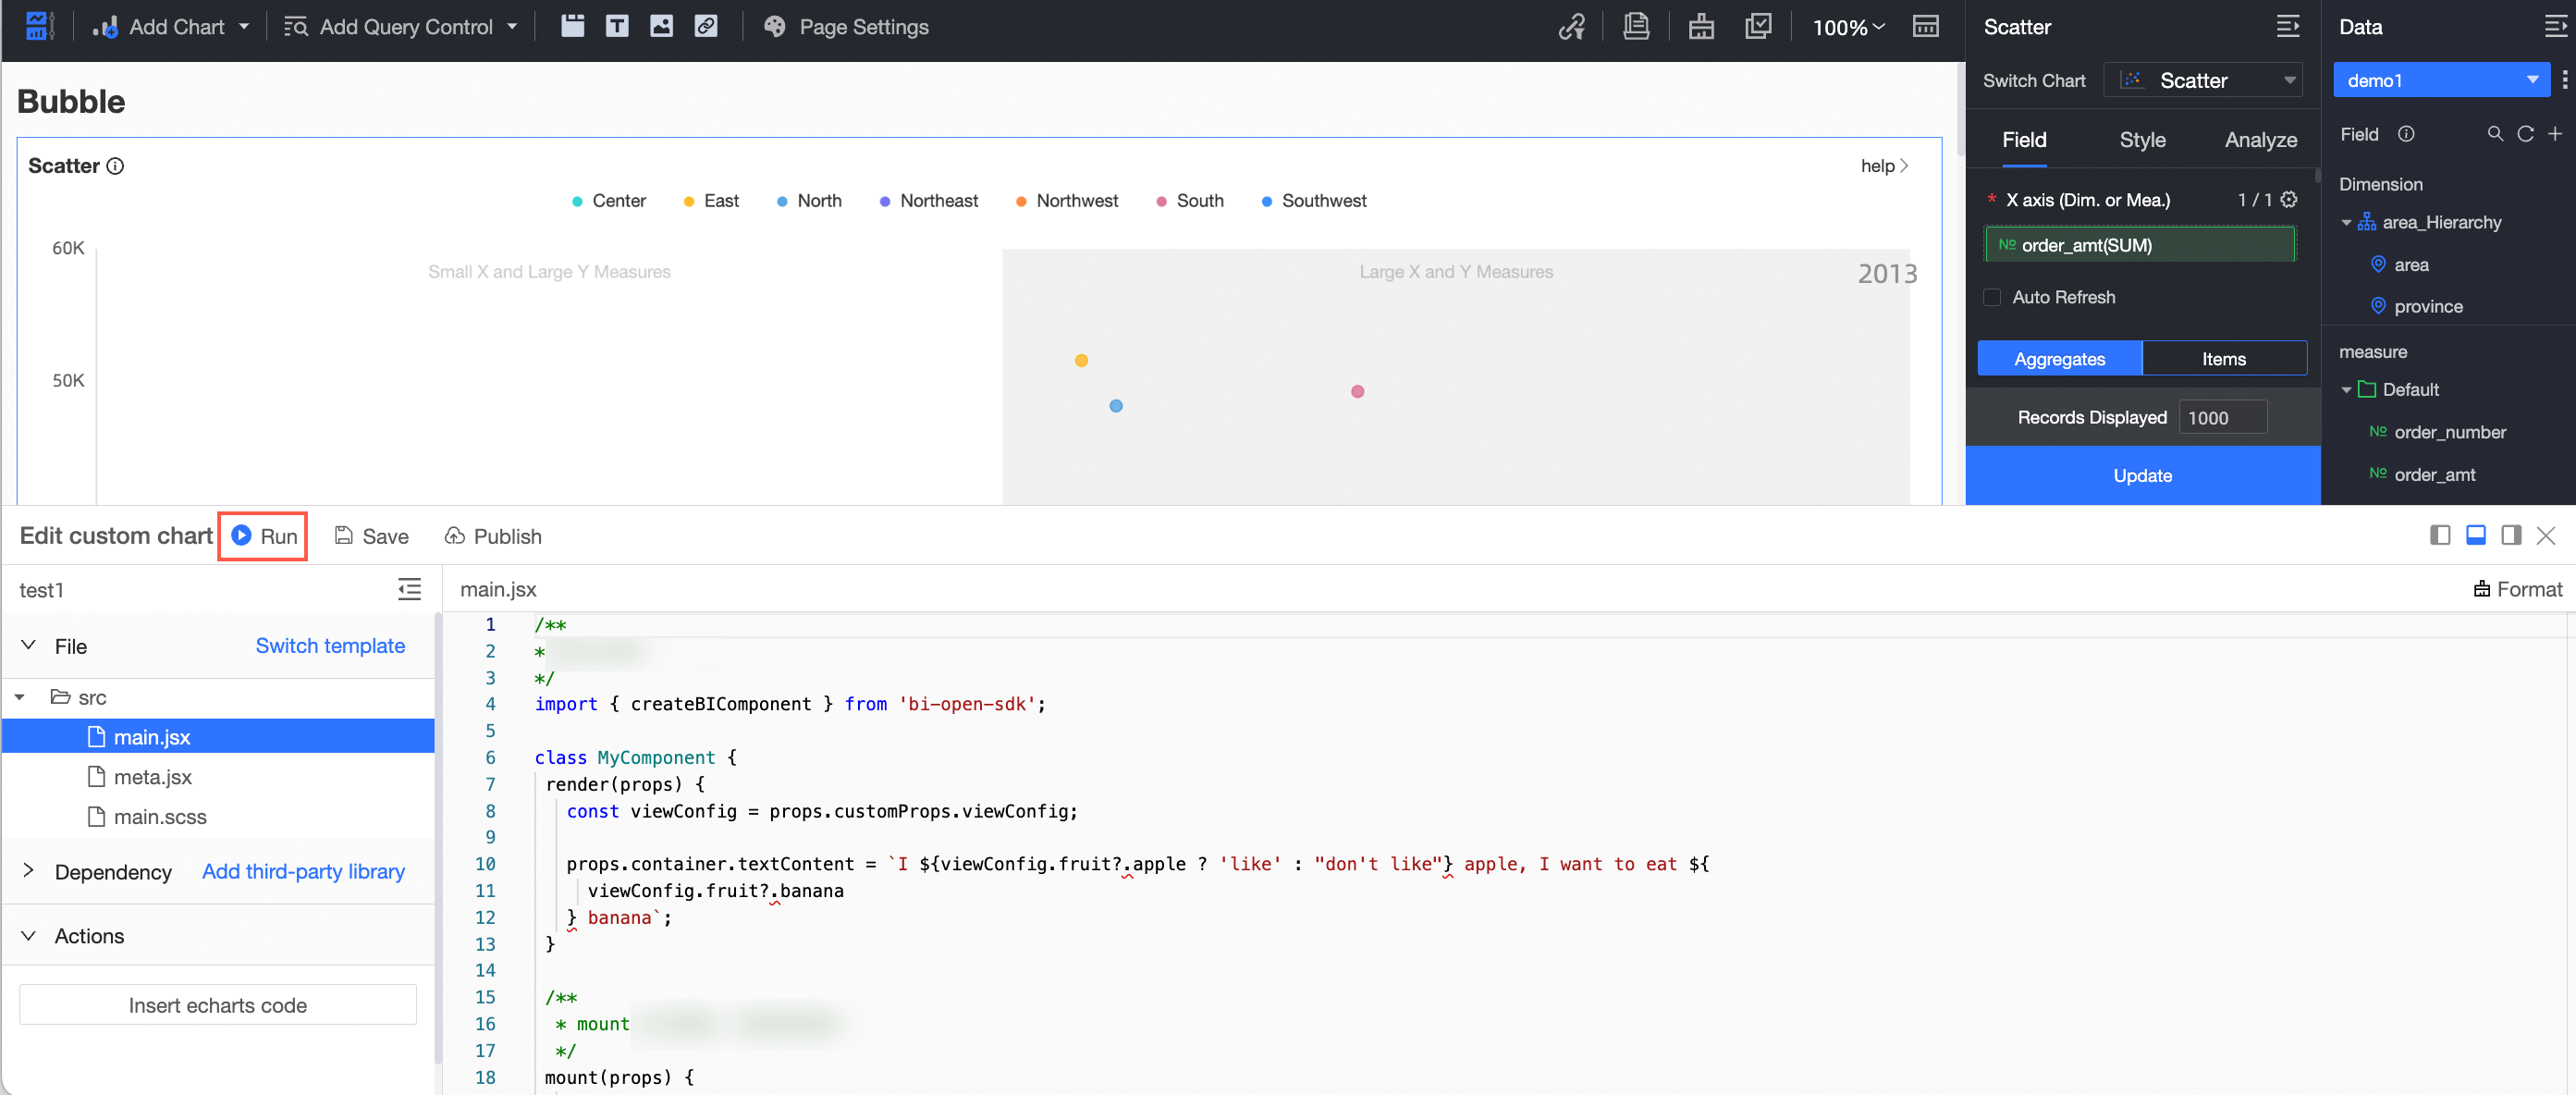
Click "Insert echarts code".
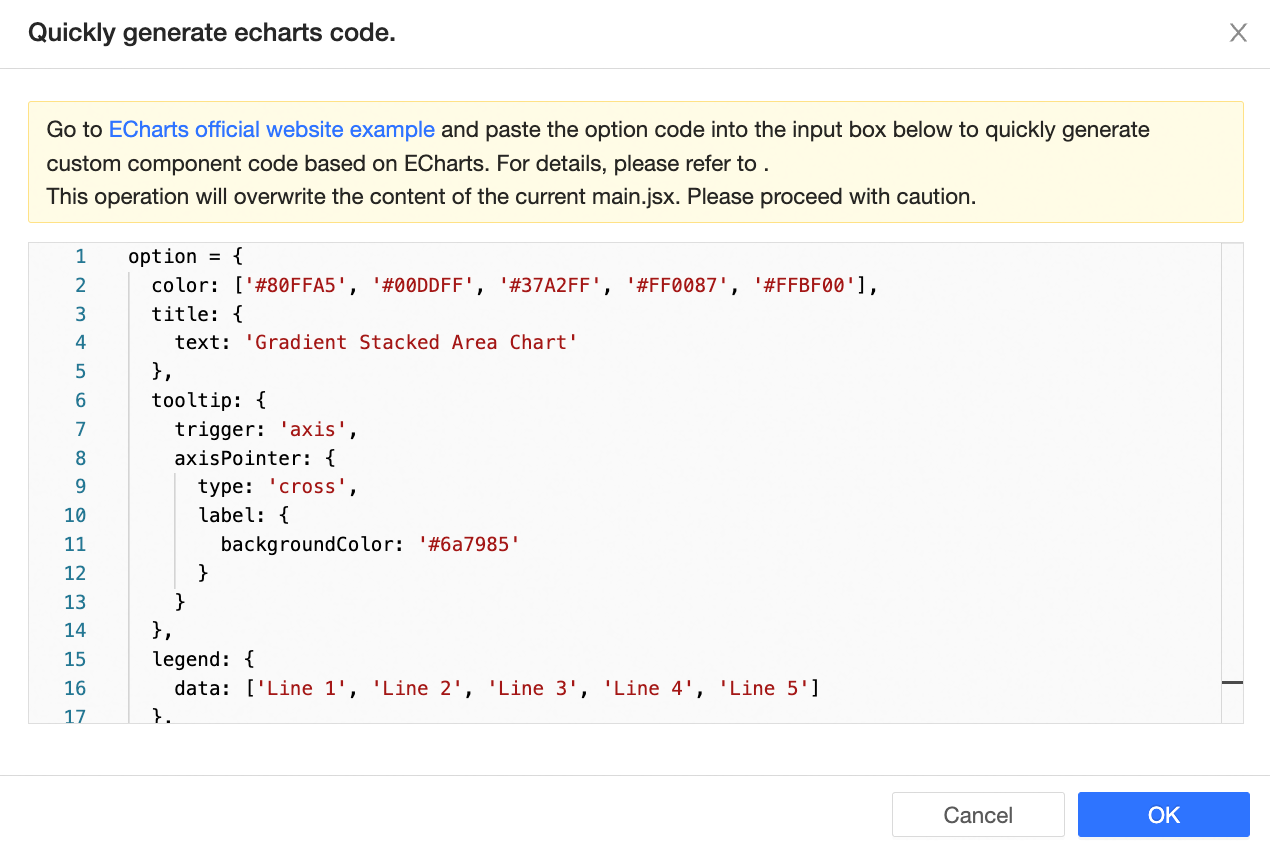
Paste the option code obtained in the second step into the input box and click OK.
Click the "Run" button to preview the echarts chart.
What to do next
In this case, you have integrated the echarts sample code into the custom component. However, the data in the chart is static data, and the data in the dataset is not actually poured into the custom component. In the next step, you need to refer to the custom component API to convert the Quick BI data format into the echarts data format. For more information, see example: create an echarts chart.