Data dashboards serve as carriers that combine visualization and scenario storytelling. To facilitate interactive analysis of multi-dimensional data, drilling, filter interaction, and hyperlink features are provided. This topic describes the scenarios and operations of these three features in data dashboards.
Prerequisites
You create a data visualization screen. For more information, see Create a Data Visualization Screen.
You create a dataset. For more information, see Create and Manage Datasets.
Limits
Only charts support interactive analysis. Layers do not support interactive analysis.
The following charts are not supported: ticker board, threshold ticker board, progress bar chart, and circular progress bar chart.
Function Overview
Filter interaction: When you click a field in a chart on a data dashboard, the content of other charts on the same page that are related to this chart changes accordingly. For example, when you click East China in a pie chart, the map displays the data of East China synchronously.
Drilling: When you click an area or field in a chart, the hierarchy of dimensions changes, which changes the granularity of analysis. For example, after you click East China in a pie chart, the province data corresponding to this dimension is displayed. After you click Zhejiang province, the city data corresponding to this dimension is displayed.
Hyperlink: When you click a field in a chart, the system redirects you to a report that is associated with the clicked part. Hyperlinks include internal hyperlinks and external hyperlinks. Internal hyperlinks must be used with global parameters.
Configure Filter Interaction
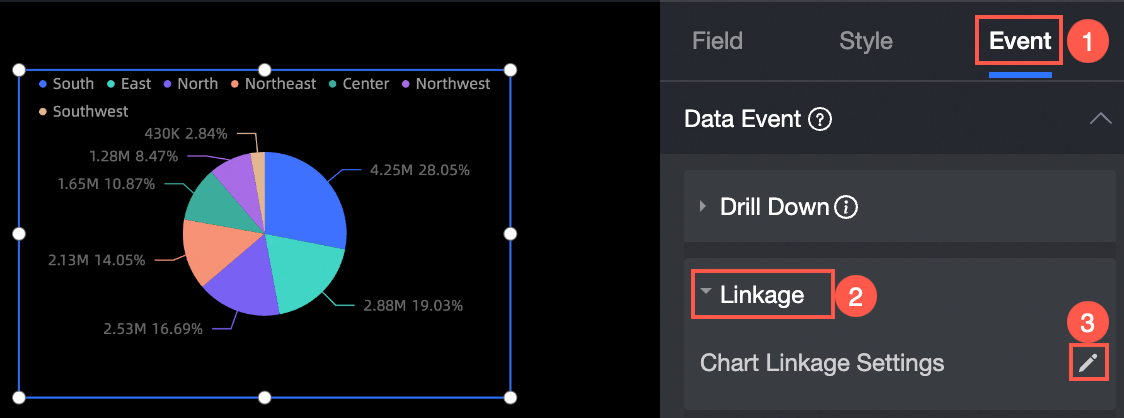
On the Event tab of the pie chart, select Filter Interaction under Data Event, and click the pencil icon next to Chart Filter Interaction Configuration.
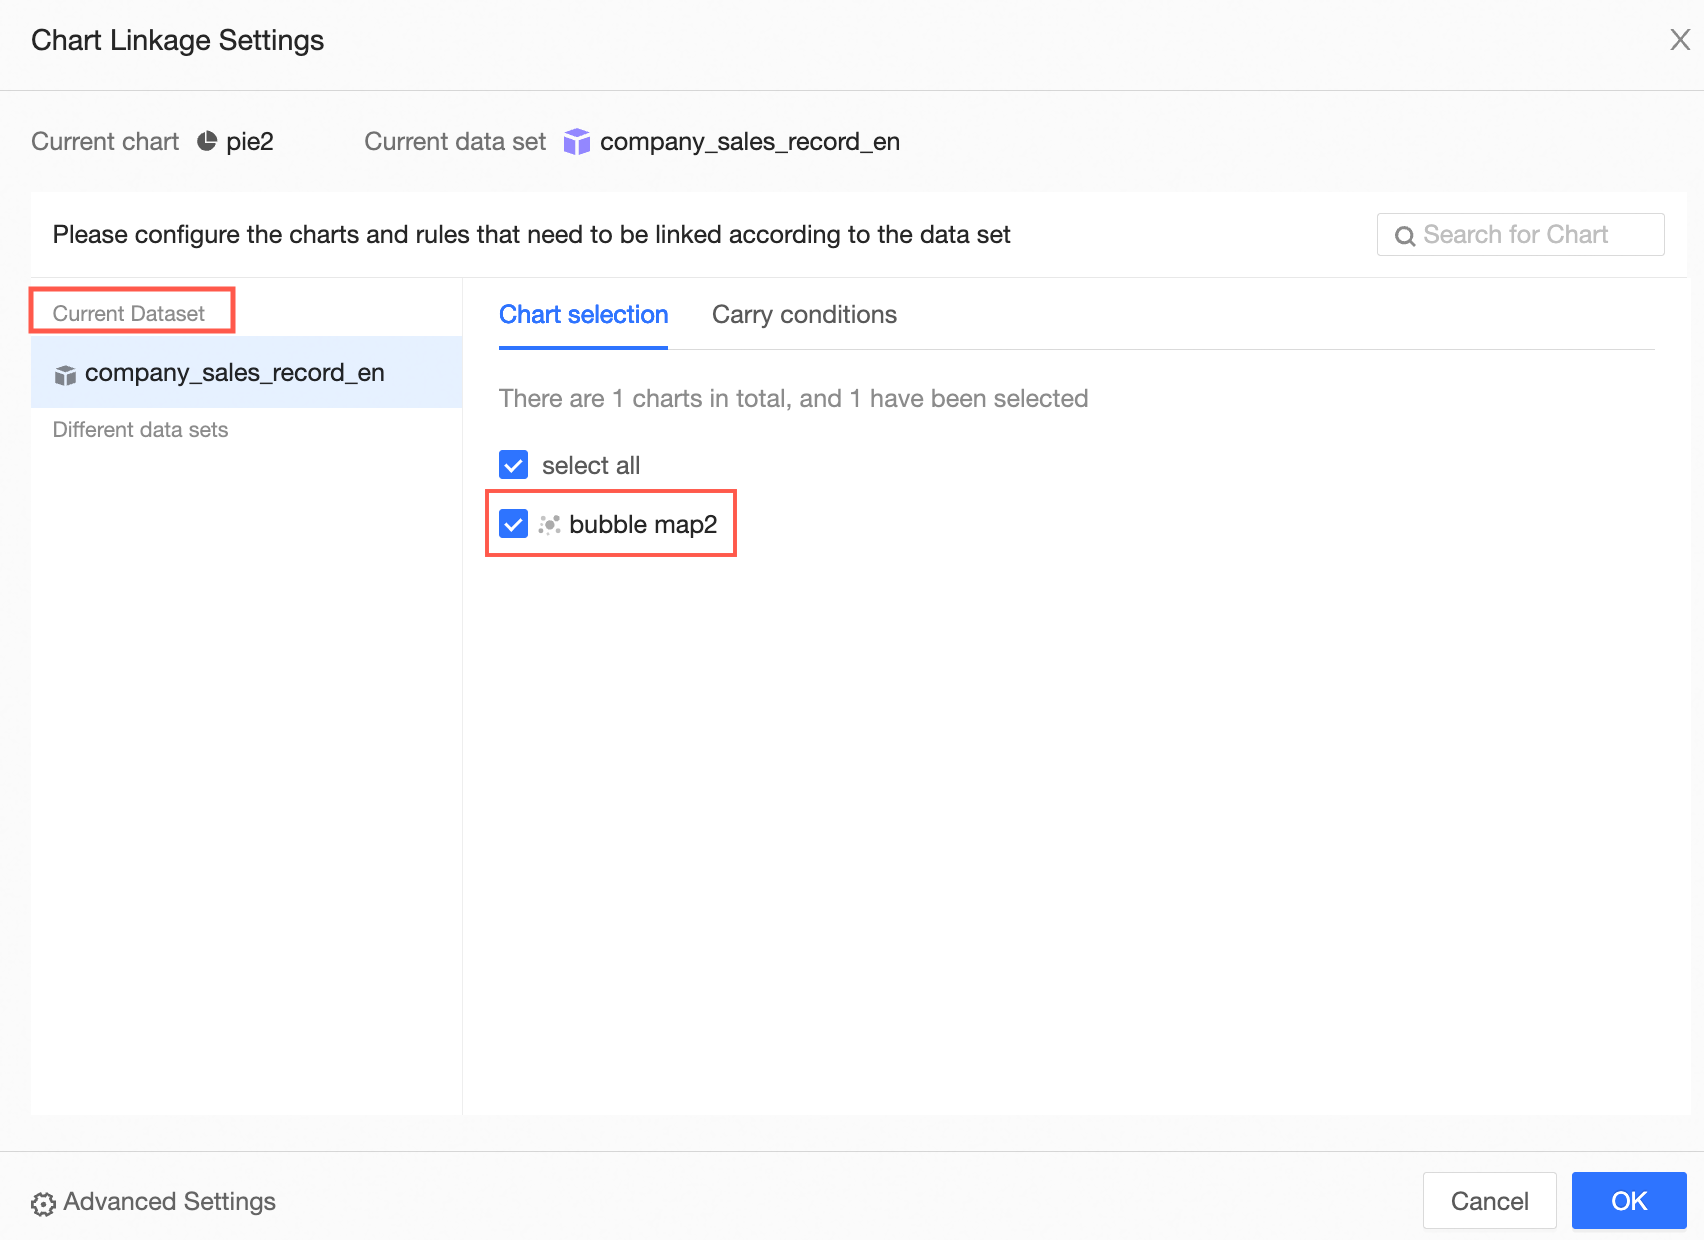
On the Chart Filter Interaction Settings page, select the associated dimension field area, and associate charts.
You can associate charts that are created based on the same dataset or a different dataset.
If the associated chart and the pie chart are created based on the same dataset, select bubble map 2 on the Same Dataset tab, and click OK.
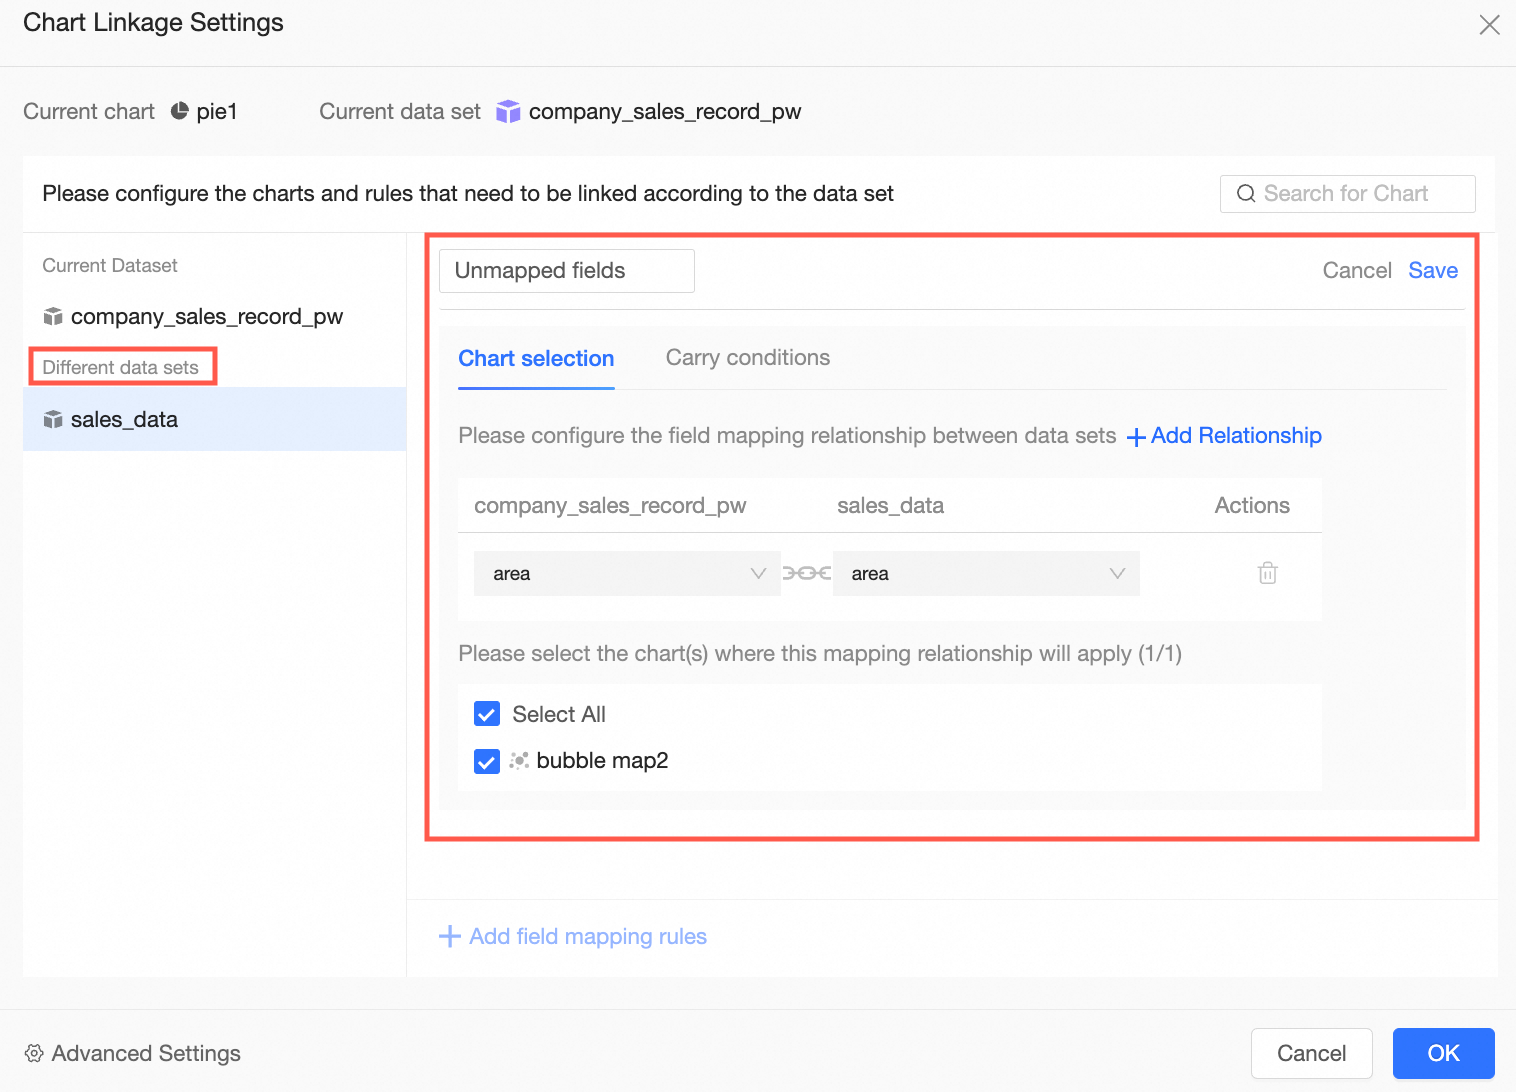
If the associated chart and the pie chart are created based on different datasets, select bubble map 2 on the Different Dataset tab, select the foreign key field Area, and click OK.
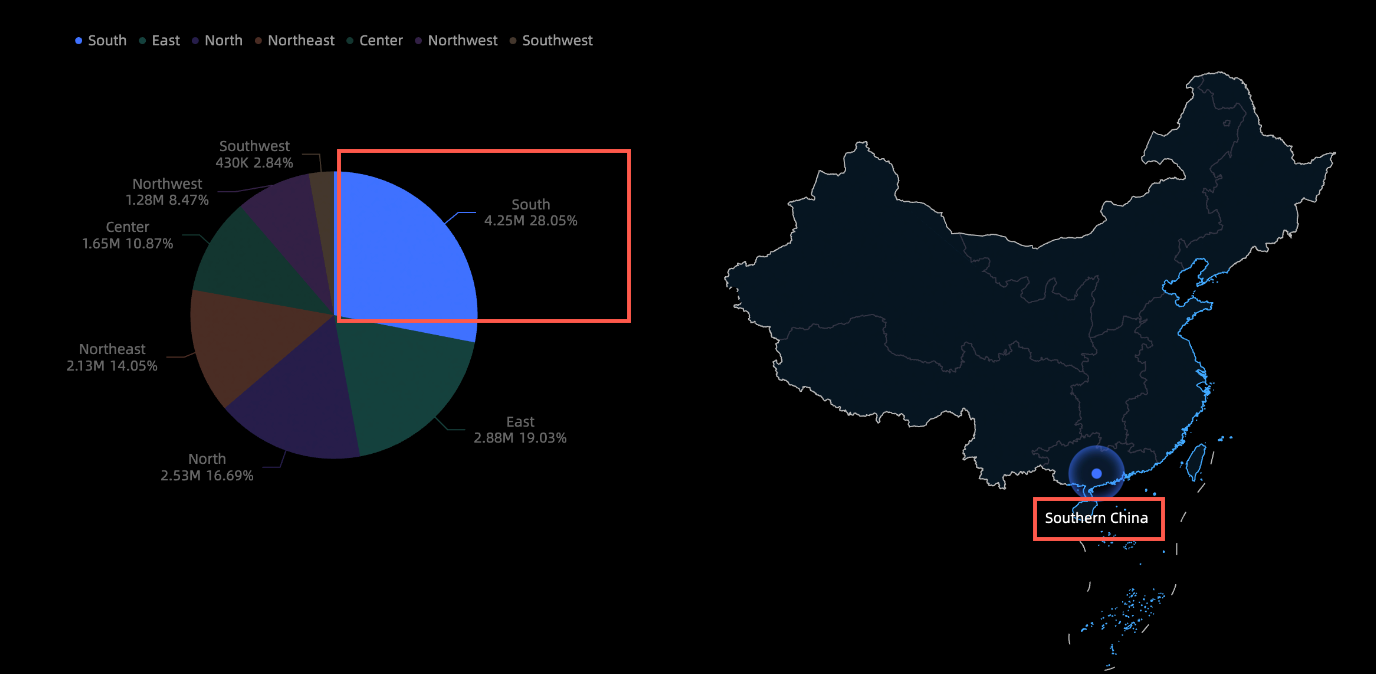
In the pie chart, click the East China sector.
The bubble map displays the data of the East China region.
 Note
NoteYou can click the
 icon in the upper-right corner of the pie chart to cancel the filter interaction.
If drilling is configured for the filter interaction dimension, you can select Take Effect Simultaneously or Select Filter Interaction or Drilling in the Floating Layer in the configuration.
Configure Drilling
You must manually configure the drilling feature. The following section describes how to configure the drilling feature. In this example, a pie chart is used.
On the Field tab of the pie chart, click the
 icon on the right side of the target dimension area.
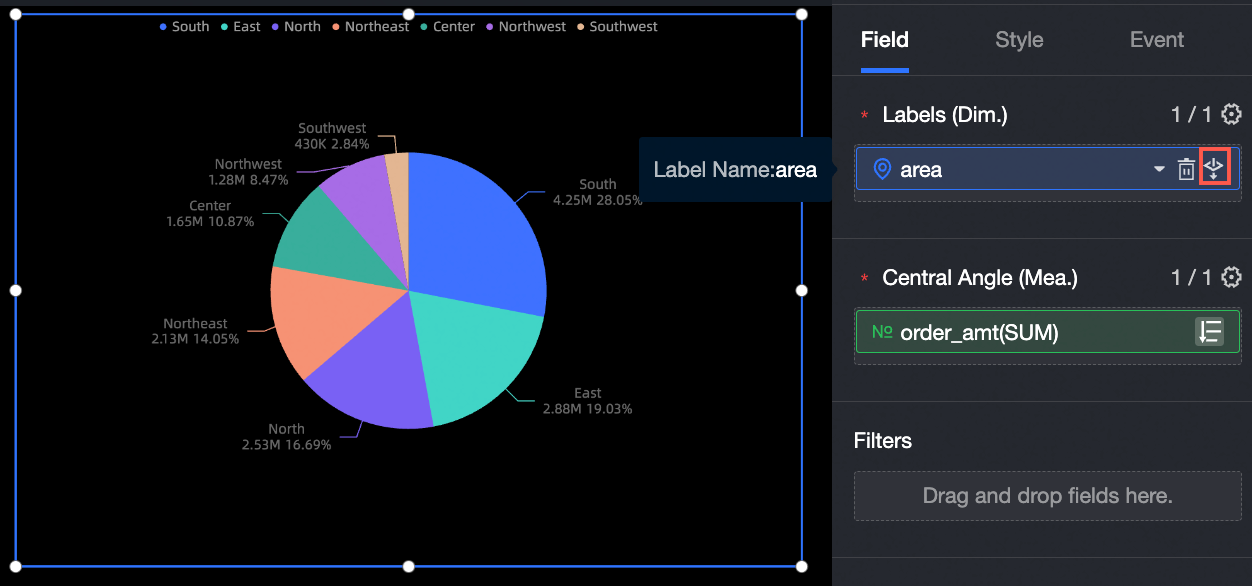
Configure the drilling hierarchy.
In this example, the drilling order is area > province > city.
You can also perform the following operations:
Add a drilling dimension: Drag the required drilling dimension to the Drilling/Dimension area, and adjust the order.
Modify the drilling order: Select the target field in the Drilling/Dimension area and drag it to adjust the order.
Delete a drilling dimension: Select the target field in the Drilling/Dimension area and click the
 icon.
icon.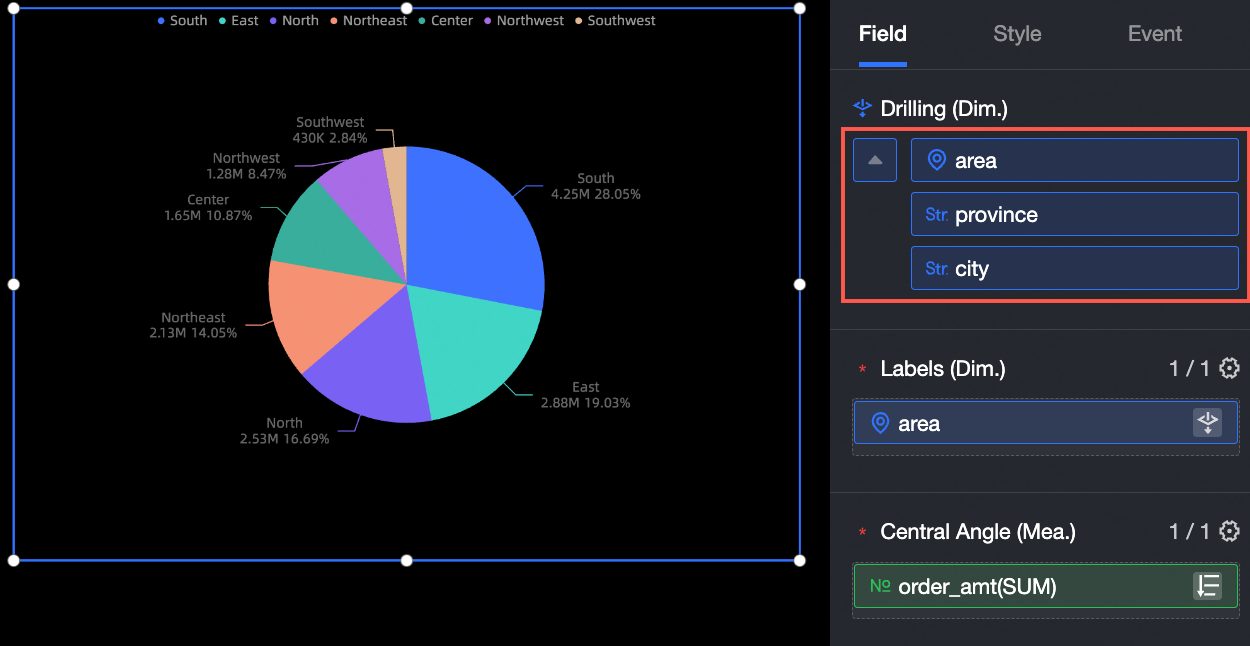
Click Update.
After you click the area in the chart title, the system drills down, as shown in the following figure.

You can also select Drilling under Data Event on the Event tab of the pie chart. The configuration area allows you to set the position, text, and current level of the drilling level row display.

Configure Hyperlinks
When you view data in a data dashboard, you can use the hyperlink feature to go to another resource (report, workbook, or data dashboard) to view detailed information about a specified field.
Procedure
The following example describes how to view data for December 2023 in the Sales Analysis data dashboard and use hyperlinks to view profit details for a specific region.
Configure global parameters for the target data dashboard in advance.
NoteThis example uses the parameter hyperlink feature, so you need to configure global parameters first.
Before you configure global parameters, make sure that you have saved the data dashboard.
On the edit page of the Profit Analysis data dashboard, click the global parameter icon.

In the Global Parameter Configuration dialog box, configure the interactive controls and charts that need to be associated with global parameters.
Interactive control: refers to date selection, drop-down list, and tile button controls. After being selected, the interactive control can receive parameter values and synchronously affect the data displayed in the chart.
Chart: refers to visualization charts and interactive controls. After being selected, the chart and interactive control can only receive parameter values themselves and will not affect the data displayed in other charts. For example, if a drop-down list control is selected in Chart, the drop-down list control only receives parameter values itself and does not affect the data displayed in other charts.
In this example, the Sales Analysis data dashboard needs to carry time parameters and region parameters to jump to the Profit Analysis data dashboard. Therefore, you need to create a global parameter date in the Profit Analysis data dashboard to receive time parameter values and pass them to the date selection control, and a global parameter area to receive region parameters and pass them to the chart control. The specific configuration is shown in the following figure:

Save the Profit Analysis data dashboard, open the edit page of the Sales Analysis data dashboard, and configure the fields that need to be filtered in the Filter section of the Field panel of the chart for hyperlink.
In this example, you need to filter and view data for December 2023 in the Sales Analysis data dashboard. Therefore, drag the Order Date (day) field to the Filter section and set the filter condition to December 2023.

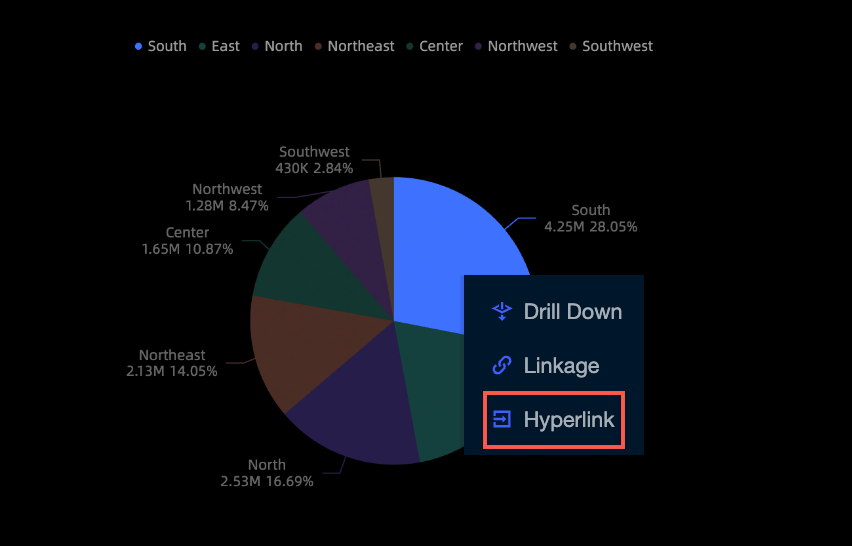
In the Event panel of the pie chart in the Sales Analysis data dashboard, click the Data events > Jump
 icon to configure hyperlinks.
In the Chart Hyperlink Settings dialog box, configure the hyperlink rules for the current chart. You can set Internal Hyperlink or External Hyperlink.
Internal Hyperlink (the method selected in this example): redirects to another dashboard, data dashboard, or workbook in Quick BI. The specific configuration items are as follows.

Configuration item
Configuration content
Description
Field
Set the field to which the current hyperlink rule is bound.
In this example, you need to click the Northeast region to jump, so select the Region field.
Hyperlink display text
When you need to display custom text content during chart interaction, you can enter the content to be displayed in the Hyperlink display text configuration box. If not set, the default text is Jump.
This example uses the default text.

Jump to
The hyperlink method, which is currently an internal hyperlink.
Hyperlink content
Select the resource to which you want to jump.
In this example, select the Profit Analysis data dashboard to jump to.
Open method
Set the method to open the hyperlink resource. Three methods are supported: Open in current window, Open in new window, and Open in dialog box.
Open in current window: Loads the hyperlink resource directly in the current page.
Open in new window: Opens a new tab in the browser to load the hyperlink resource. This option is selected in this example.
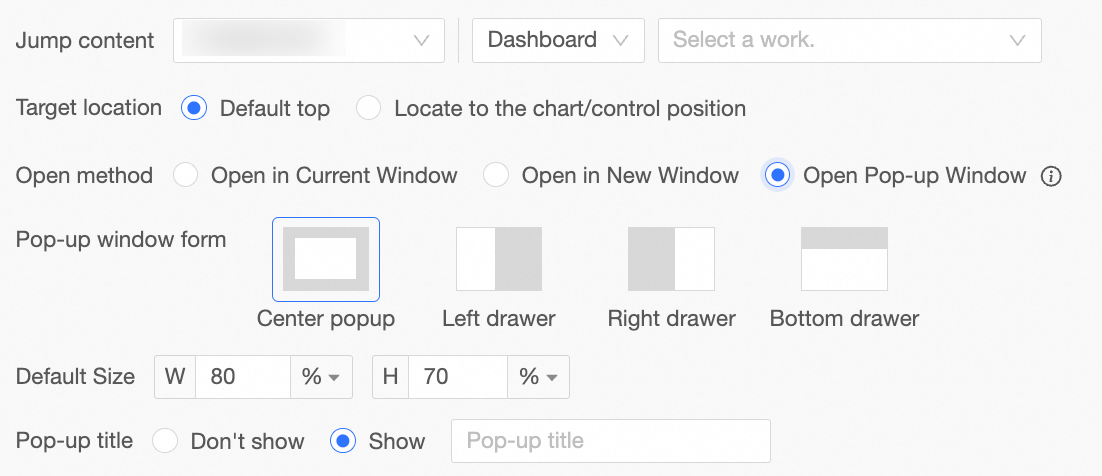
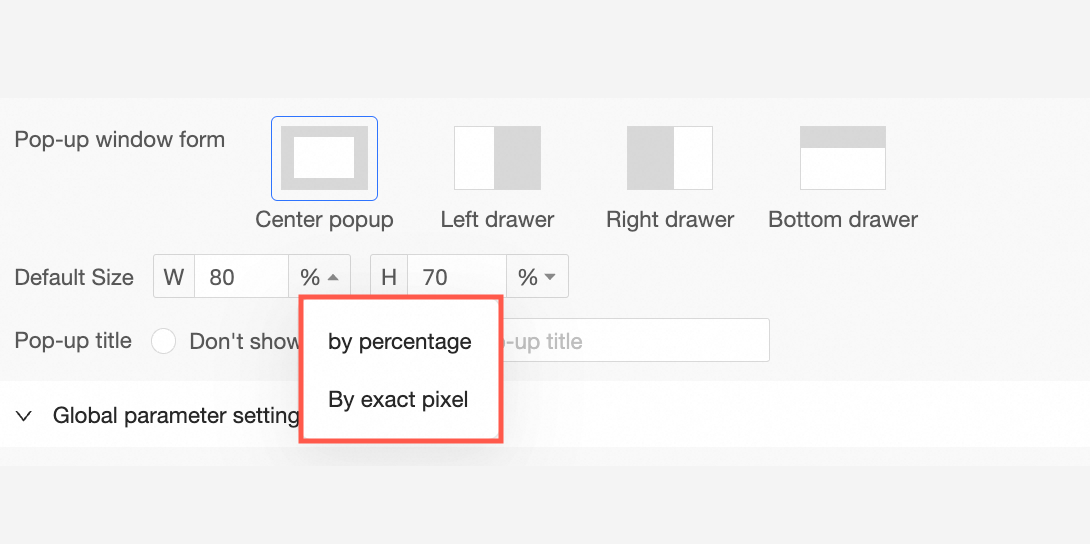
Open in dialog box: Loads the hyperlink resource in the form of a dialog box on the current page. When you select the Open in dialog box method, you can further set the Dialog box form, Default size, Dialog box title, and Page mask.
 Note
NoteWhen the dialog box form is centered, the dialog box title can be set to display or not display. Other dialog box forms display the dialog box title by default and do not support setting it to not display.
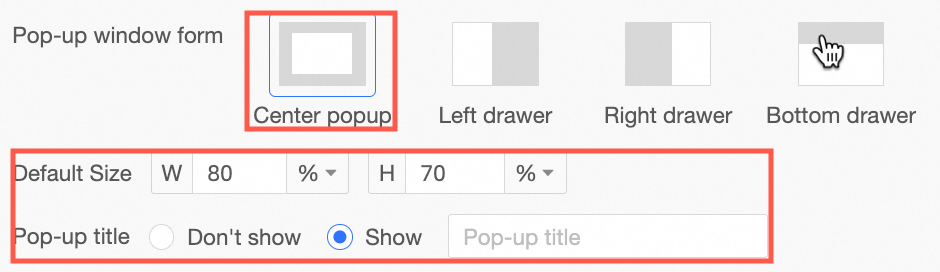
Only left drawer, right drawer, and bottom drawer support setting whether to display the page mask. When the mask is not displayed, you can click to switch dimension values.
The default size can be set as a percentage or as an exact pixel value.
Global parameter settings
Parameter mapping rule
To complete the hyperlink between reports, you need to configure the mapping relationship between the current chart field and the global parameters of the target chart.
In this example, you need to click the Northeast region to jump to view profit information for the Northeast region. Therefore, you need to match the Region field in the Sales Analysis data dashboard with the global parameter area in the Profit Analysis data dashboard that controls chart region information.

Filter condition
Set the filter conditions that need to be carried when jumping. For example, if a date range for displaying information is set in the current data dashboard, and you want the other data dashboard to directly display the corresponding information within the set date range when jumping, you need to carry the date information as a filter condition.
In this example, you need to carry the time range set in the filter of the Sales Analysis data dashboard to the Profit Analysis data dashboard when jumping. Therefore, select to carry the value of the chart's internal filter Order Date (day), and match this field with the global parameter date in the Profit Analysis data dashboard that controls the time range parameter value.

Other conditions
Set the drilling and filter interaction conditions that need to be carried when jumping.
Carry drilling conditions: When selected, in the drilling state, the conditions generated by drilling will be carried when jumping, and the corresponding field mapping rules will reuse the drilling field mapping relationships configured in the parameter mapping rules.
Carry filter interaction conditions: When selected, in the filter interaction state, the conditions generated by filter interaction will be carried when jumping, and the corresponding field mapping rules will reuse the filter interaction field mapping relationships configured in the parameter mapping rules.
This example does not involve these conditions.
External Hyperlink: Jumps to external websites, third-party services, or applications that are typically not within the control of Quick BI.
You need to select the field to which the hyperlink rule is bound in the Chart Hyperlink Settings dialog box and enter the URL of the external hyperlink page.
NoteYou can enter the URL in the text box. You can also double-click field names in the Add Dimensions section to add the fields to the URL.

After the configuration is complete, click OK and Save the current chart.
Effect Display
The Sales Analysis data dashboard only displays sales information for December 2023. Click Northeast to jump to the Profit Analysis data dashboard. After jumping, in the Profit Analysis data dashboard, the date range in the date selection control is set to December 2023, and the chart synchronously displays profit information for the Northeast region during December 2023. The following figures show the result: