This topic describes how to create a dataset combination and use it to create a chart.
Background
This section describes the difference between a dataset combination and a dataset join.
Dataset join: Joins data first, then aggregates the data.
If your data tables are closely related and need to be joined for analysis in many scenarios, you can use the join feature in the dataset module. The resulting joined dataset can be used in different scenarios.
Example of a left outer join:
Left table

Right table

Join result
 Note
NoteIn this example, the left and right tables are joined based on User ID and Customer ID. A left outer join uses all rows from the left table. It returns data from the right table if a match is found. If no match is found, it returns a hyphen (-). For example, the user with the User ID VIP004 has no corresponding Customer ID in the right table. As a result, the Outlet ID, Order Number, and Quantity fields all show a hyphen (-).
Dataset combination: Aggregates data first, then joins the data. If your data tables have flexible join requirements, such as needing different tables for analysis in different scenarios, you can create separate datasets for each table. Then, you can use the dataset combination feature in a dashboard. This lets you flexibly adjust the number of joined datasets and configure the join relationships as needed.
Example:
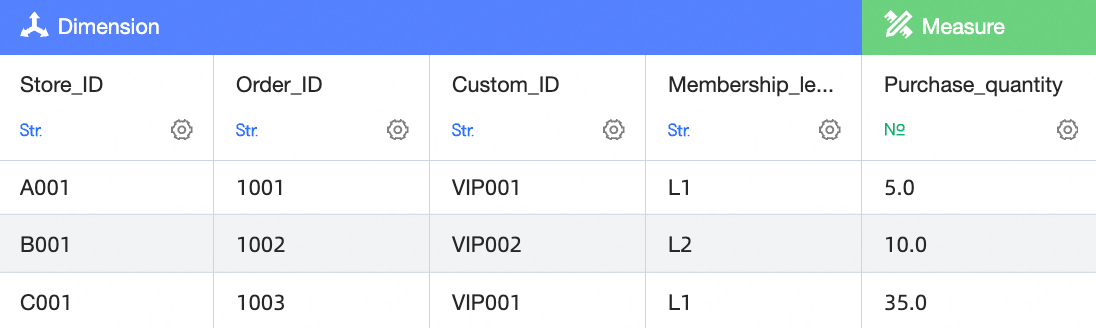
Left table
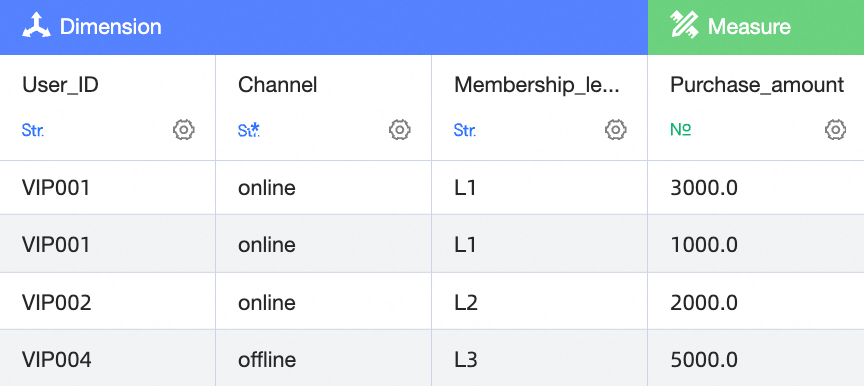
Right table
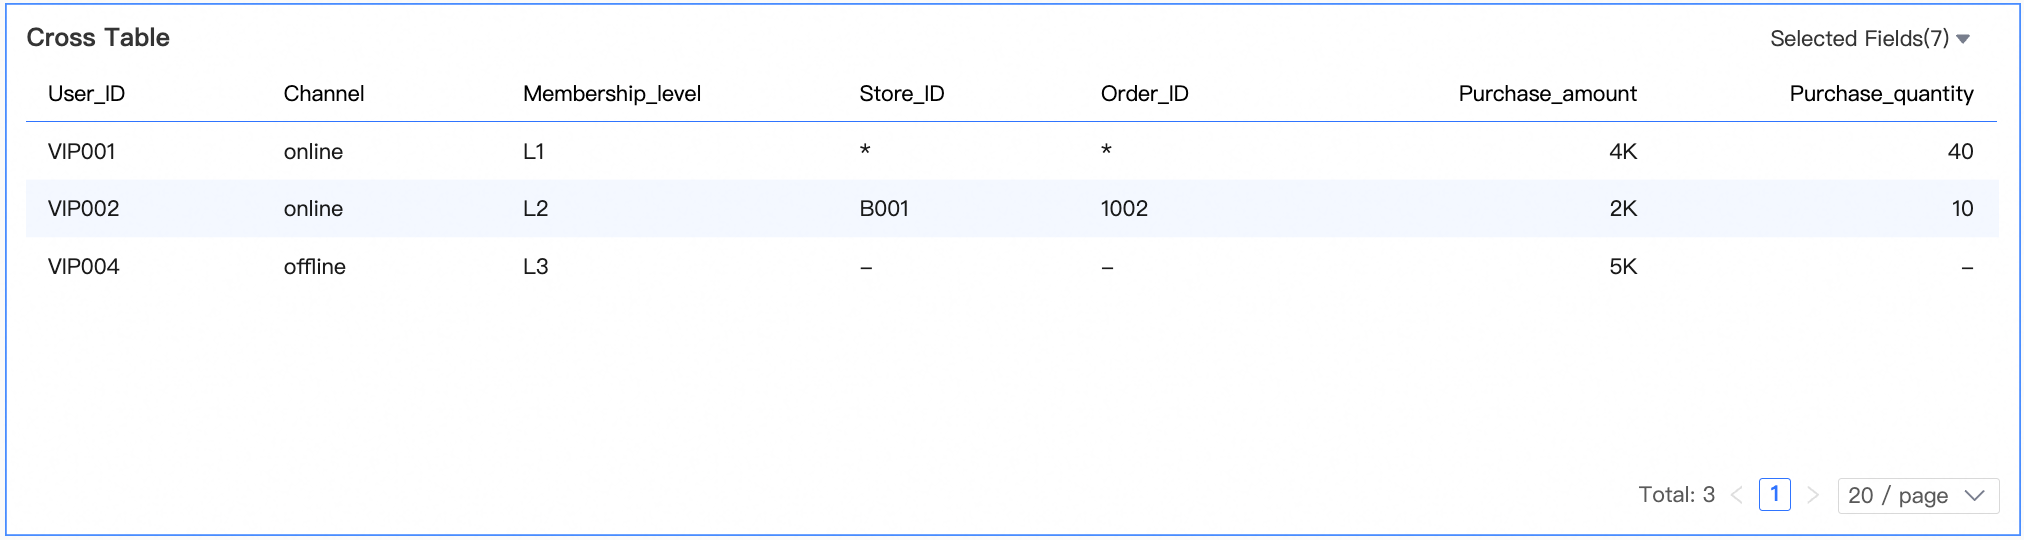
Dataset combination result
 Note
NoteExplanation:
In this example, the left and right tables are first aggregated and then joined based on User ID and Customer ID. For the user with the User ID VIP001, the order amounts are 3000 and 1000, for a total of 4000. The quantities are 5 and 35, for a total of 40.
If a row in the left table corresponds to multiple dimension values in the right table, an asterisk (*) is displayed. For example, the user with the User ID VIP001 corresponds to multiple outlet IDs and order numbers in the right table. As a result, an asterisk (*) is displayed.
If a row in the left table has no matching data in the right table, a hyphen (-) is displayed. For example, the user with the User ID VIP004 has no corresponding data in the right table. As a result, the Outlet ID and Order Number fields show a hyphen (-).
Prerequisites
To use dataset combinations in a dashboard, you must have an existing dashboard and charts. For more information, see Create a dashboard and Overview of visualization charts.
To use dataset combinations in a data dashboard, you must have an existing data dashboard. For more information, see Create a data visualization screen.
To use dataset combinations in a workbook, you must have an existing workbook. For more information, see Create a workbook.
Entry points
Dashboard or data dashboard
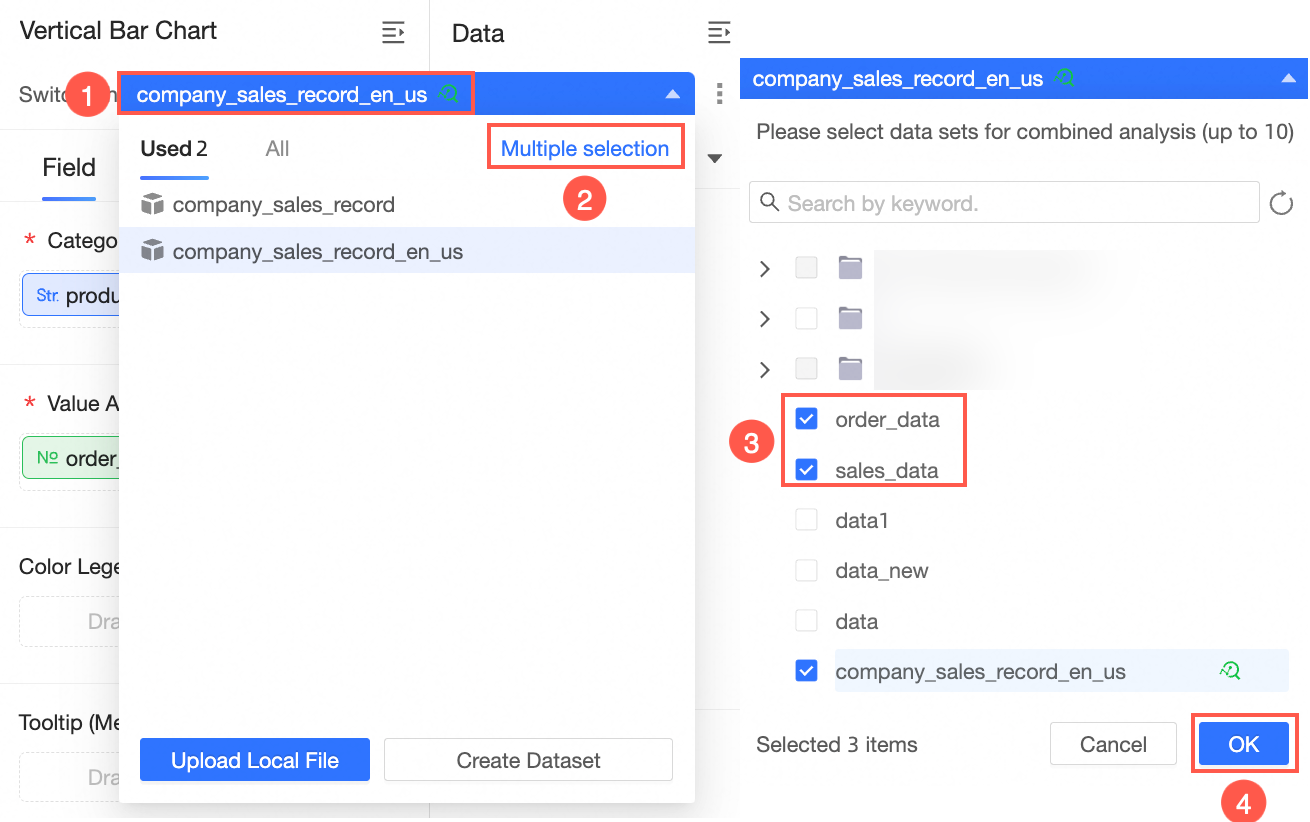
On the dashboard or data dashboard edit page, select a chart. In the Data panel, click the dataset (①), select Switch dataset and clear field configuration (②), click Multi-select (③), select multiple datasets (④), and then click OK (⑤).
 Note
NoteYou can select a maximum of 10 datasets.
If no dataset is selected for the chart, click Select a dataset in Step ①.
Workbook
On the workbook edit page, insert a dataset table or a free-form cell. In the Data panel, click the dataset (①), click Multi-select (②), select multiple datasets (③), and then click OK (④).

After you click OK, the Edit dataset combination page appears.
Create a dataset combination
This example shows how to use a dataset combination in a dashboard.
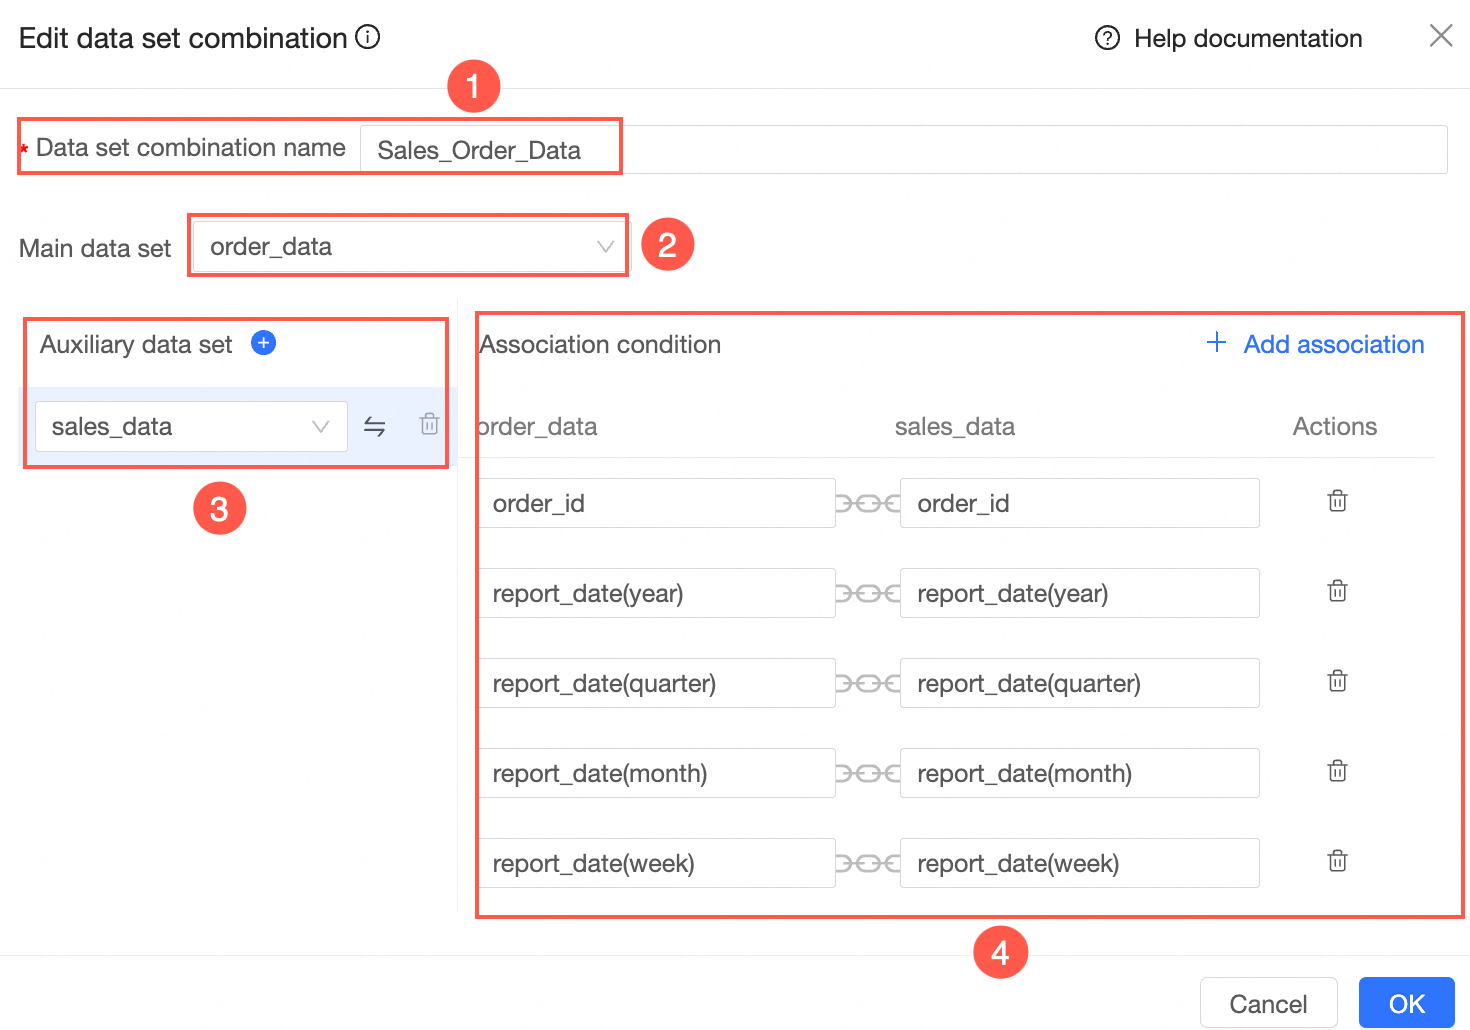
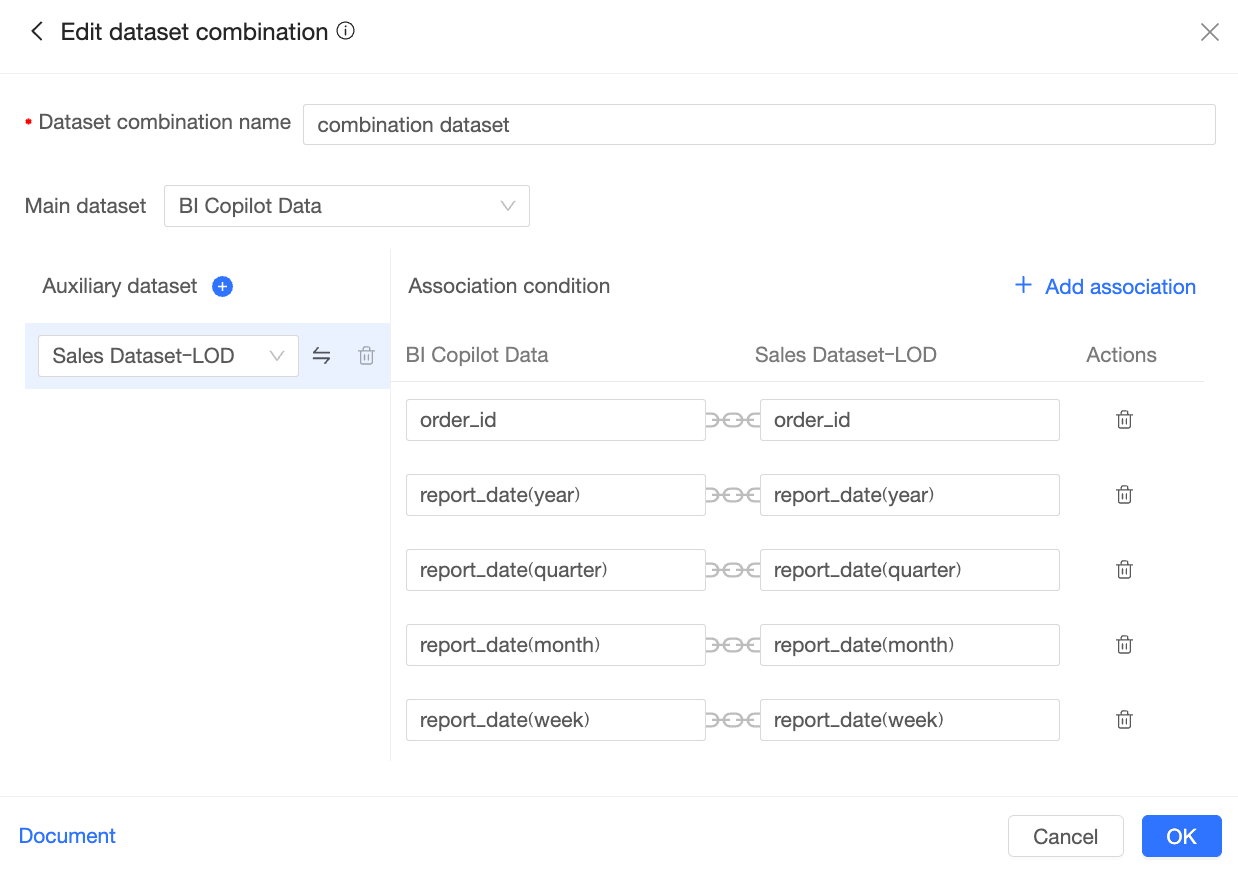
On the Edit dataset combination page, configure the following items:
Configuration item
Description
① Dataset combination name
Enter a name for the dataset combination, such as "Sales order data".
② Main dataset
Select one dataset as the main dataset.
③ Auxiliary dataset
Select one or more auxiliary datasets.
Click the
 icon to add datasets.
Click the
 icon to set the corresponding auxiliary dataset as the main dataset.
Click the
 icon to delete the corresponding auxiliary dataset.
④ Join conditions
Set the join conditions between the main and auxiliary datasets.
The system automatically joins fields that have the same name. You can also click Add Join in the upper-right corner to manually add join conditions.
Click OK to create the dataset combination.
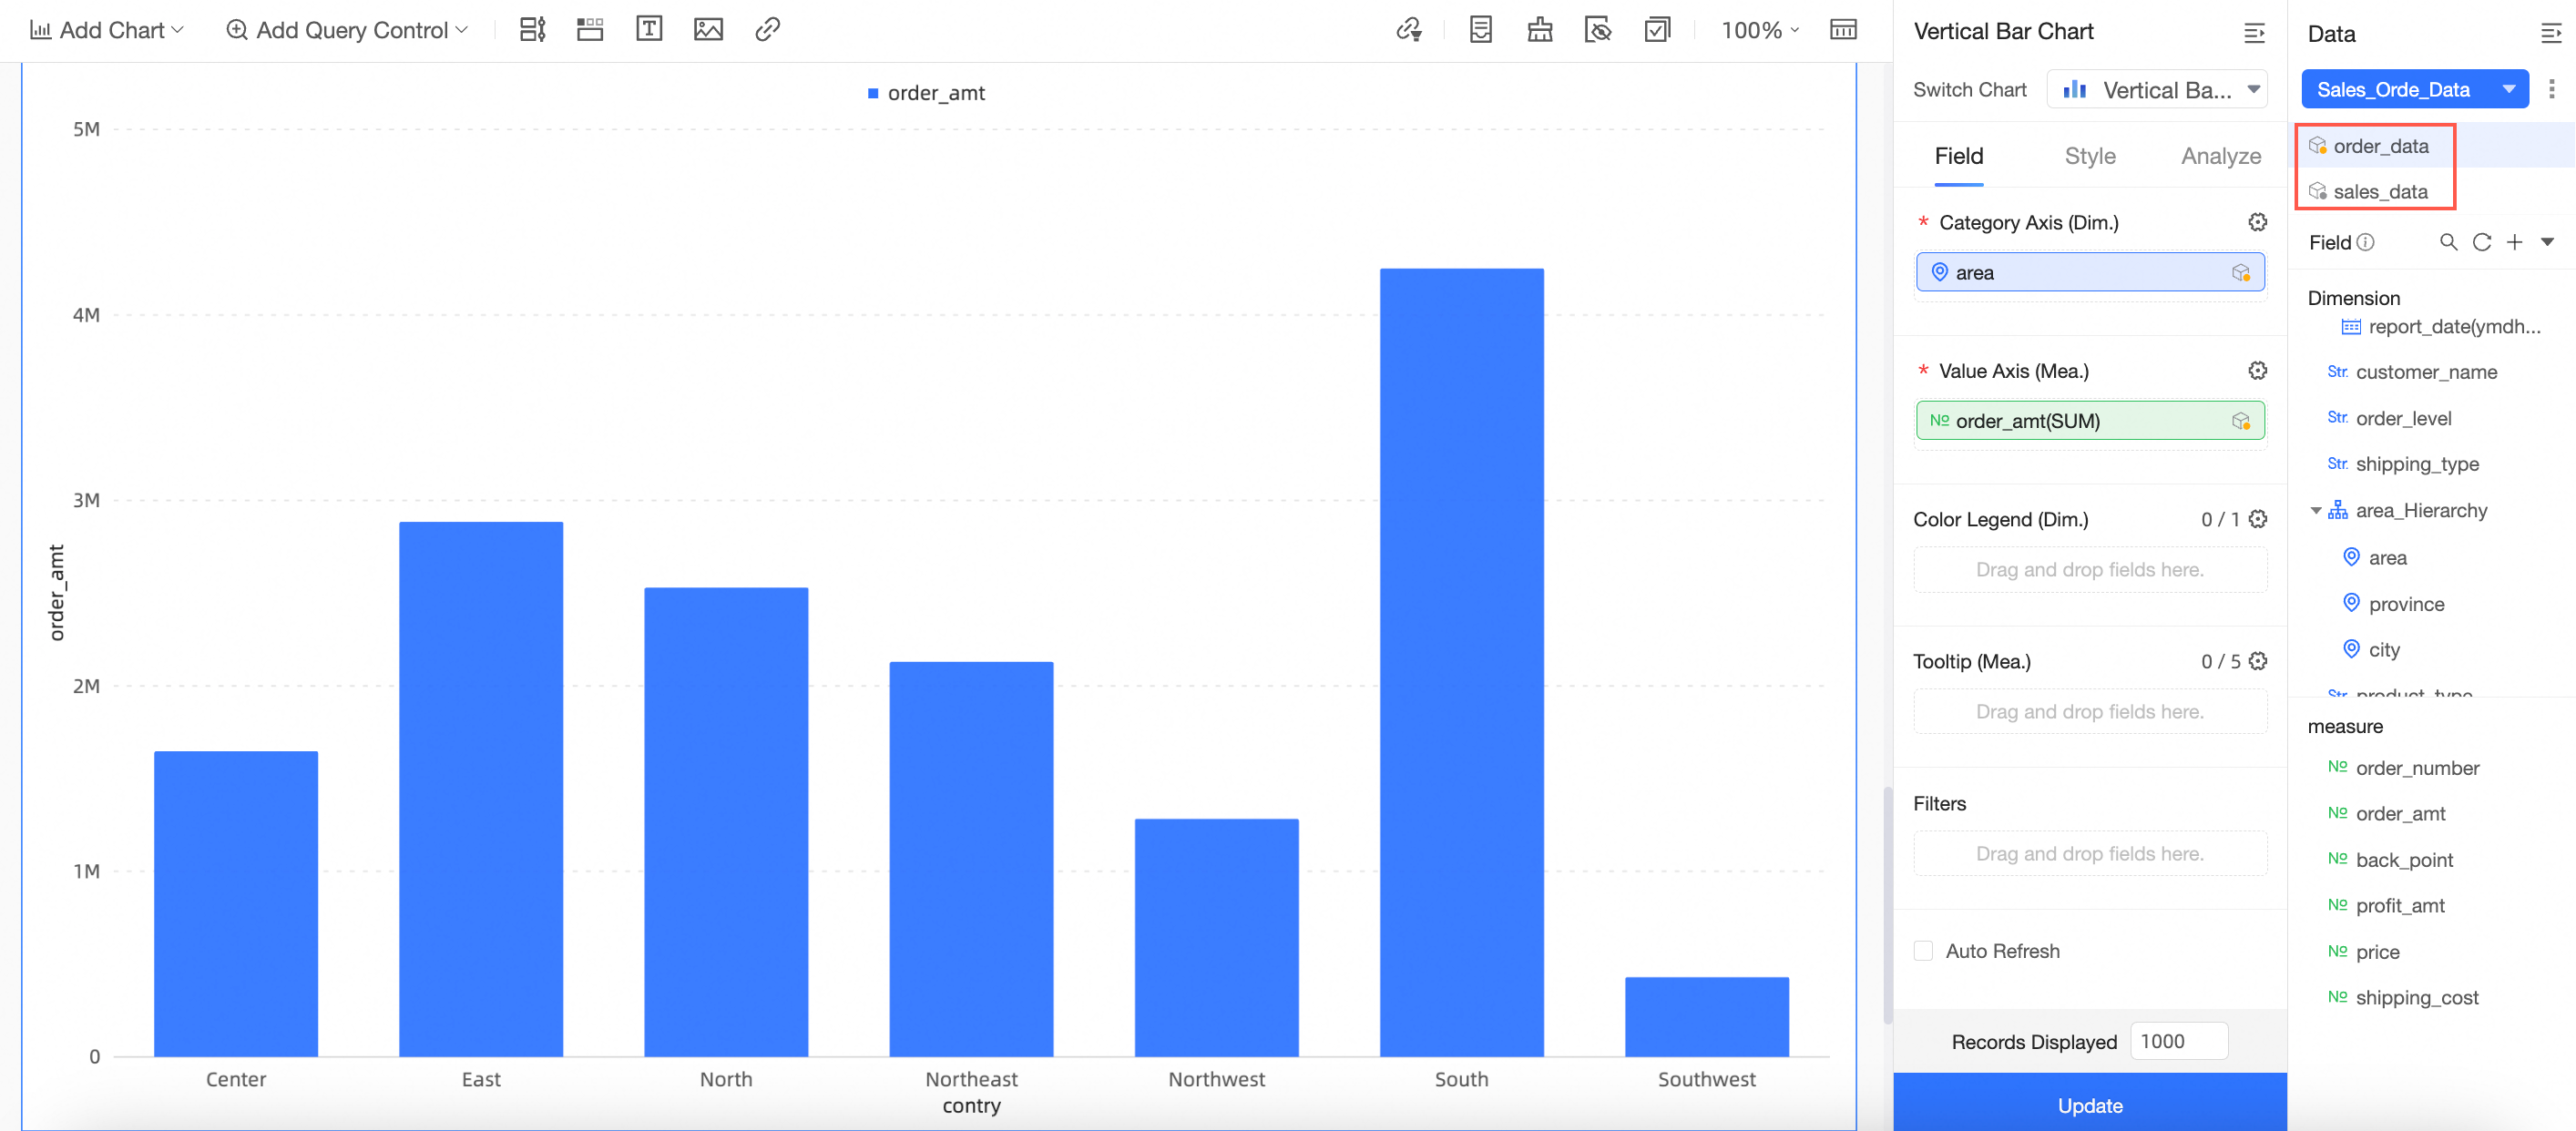
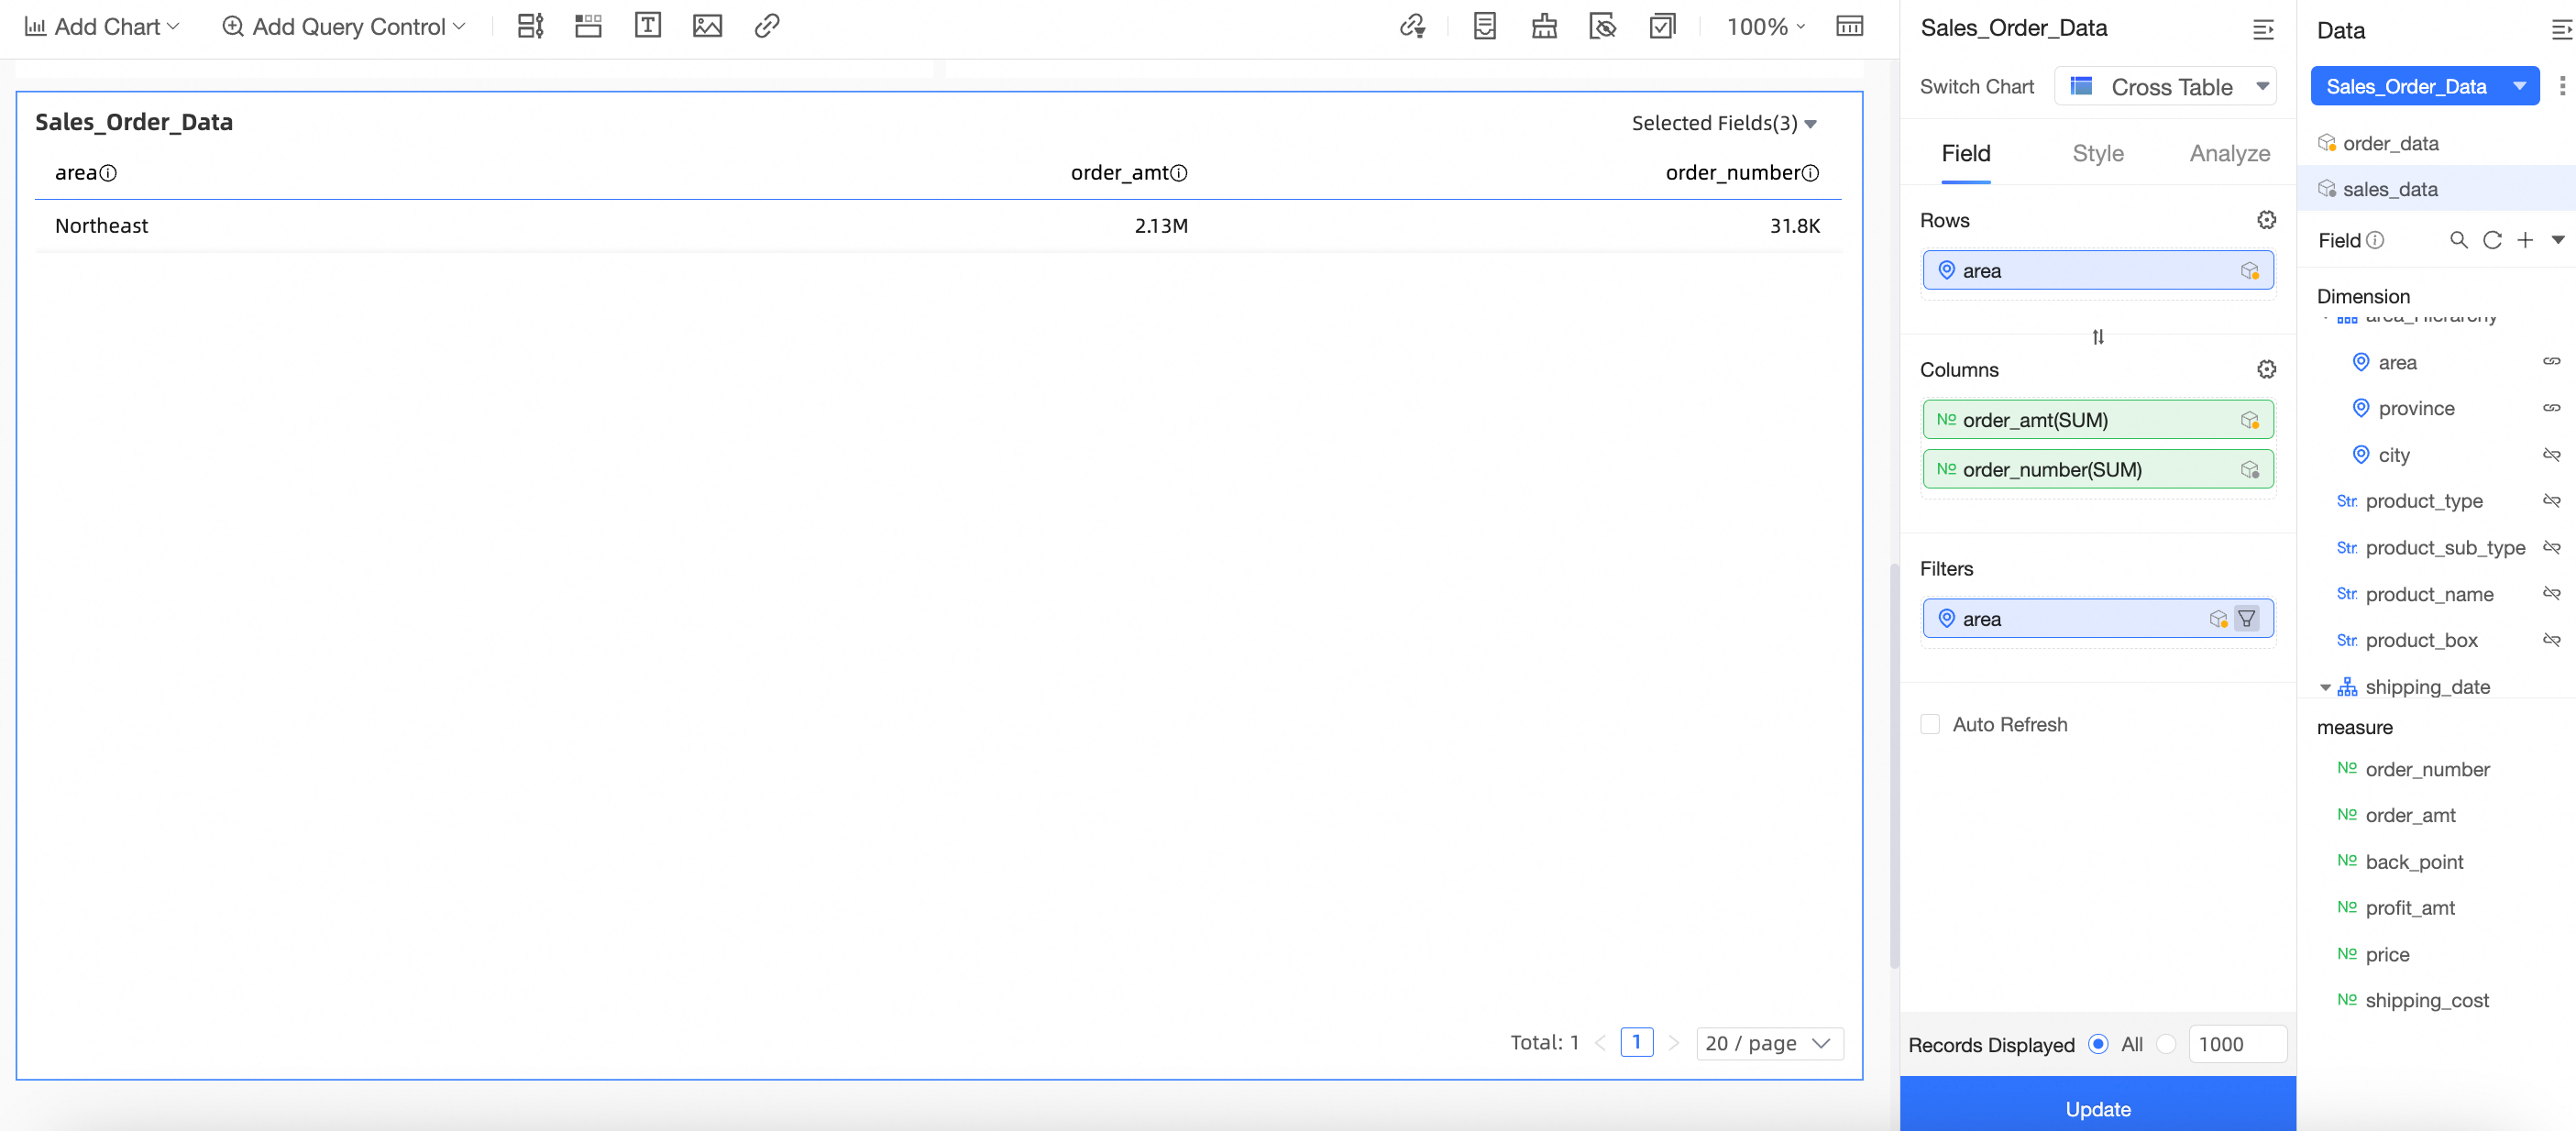
The data for the chart automatically switches to the newly created dataset combination. In this example, the dataset is automatically changed to "Sales order data".
Click the
 icon next to the dataset to select Preview data or Go to Edit dataset combination.
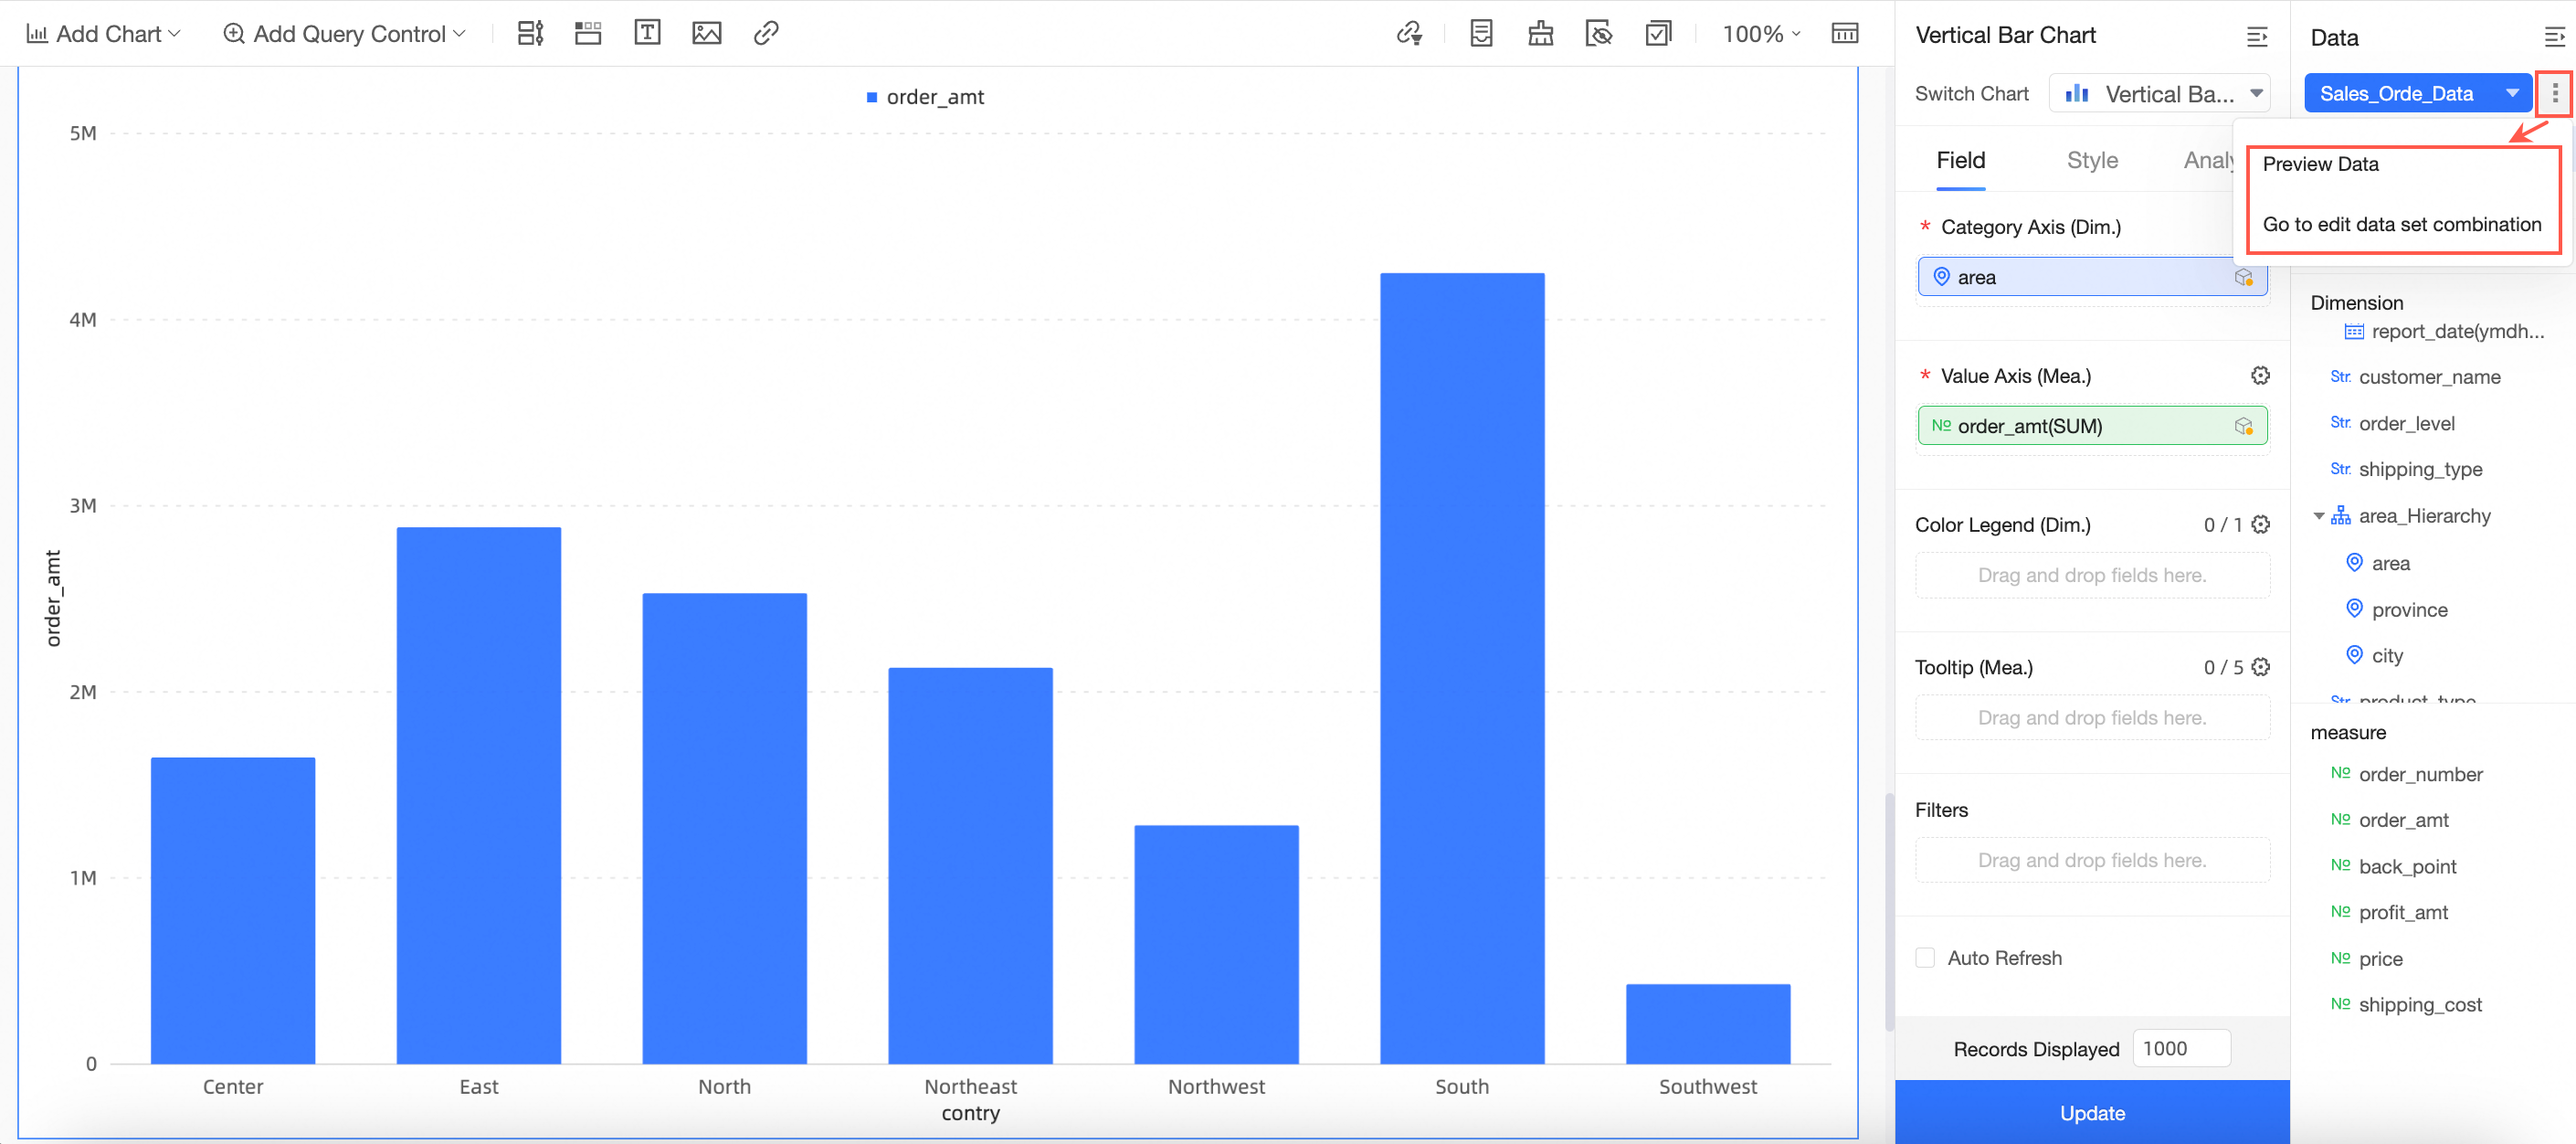
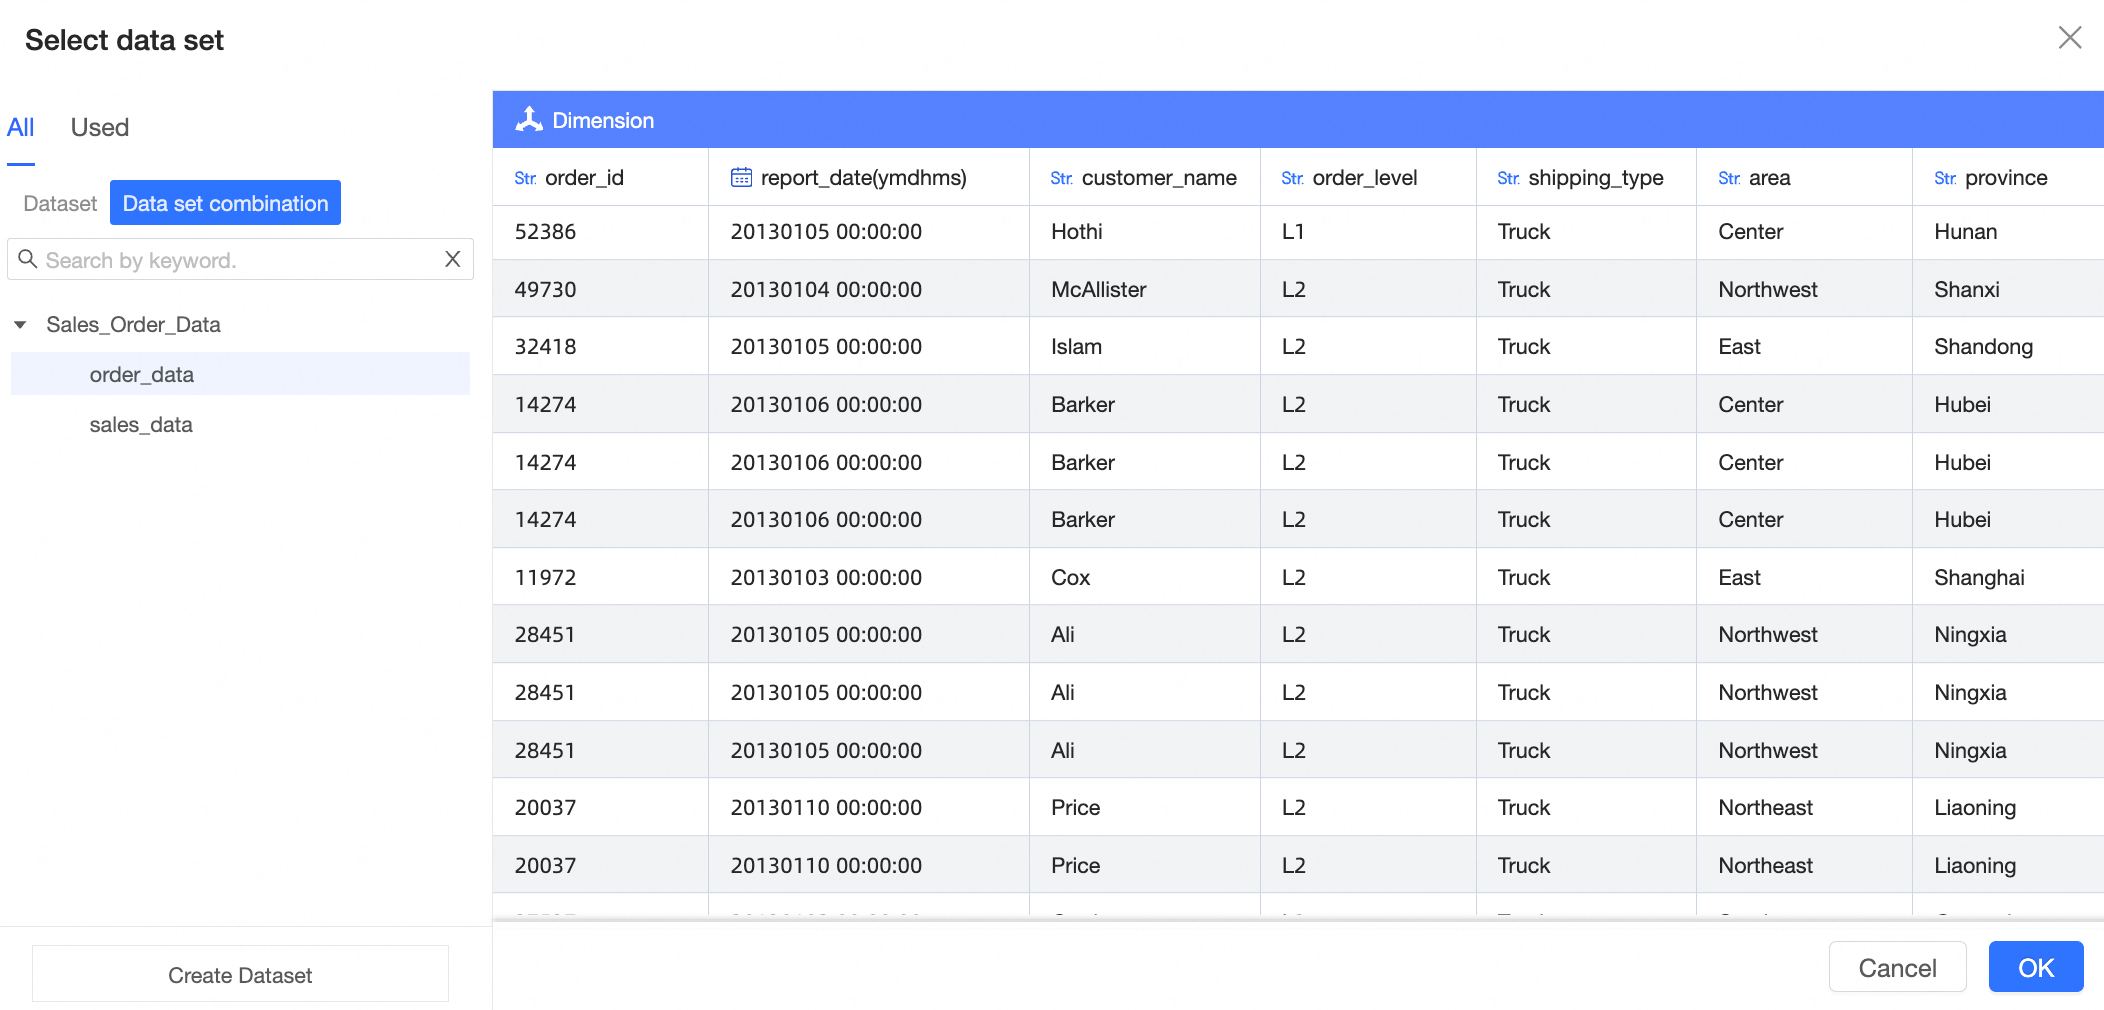
Preview data
On the data preview page, you can view All datasets and Used datasets, and preview the data.
Edit dataset combination
Click Go to Edit dataset combination to open the Edit dataset combination page. On this page, you can edit the dataset combination. For more information, see Create a dataset combination.
Manage dataset combinations
On the dataset combination management page, you can edit, copy, and delete dataset combinations.
Entry point
Click the
 icon to the right of the dataset combination.
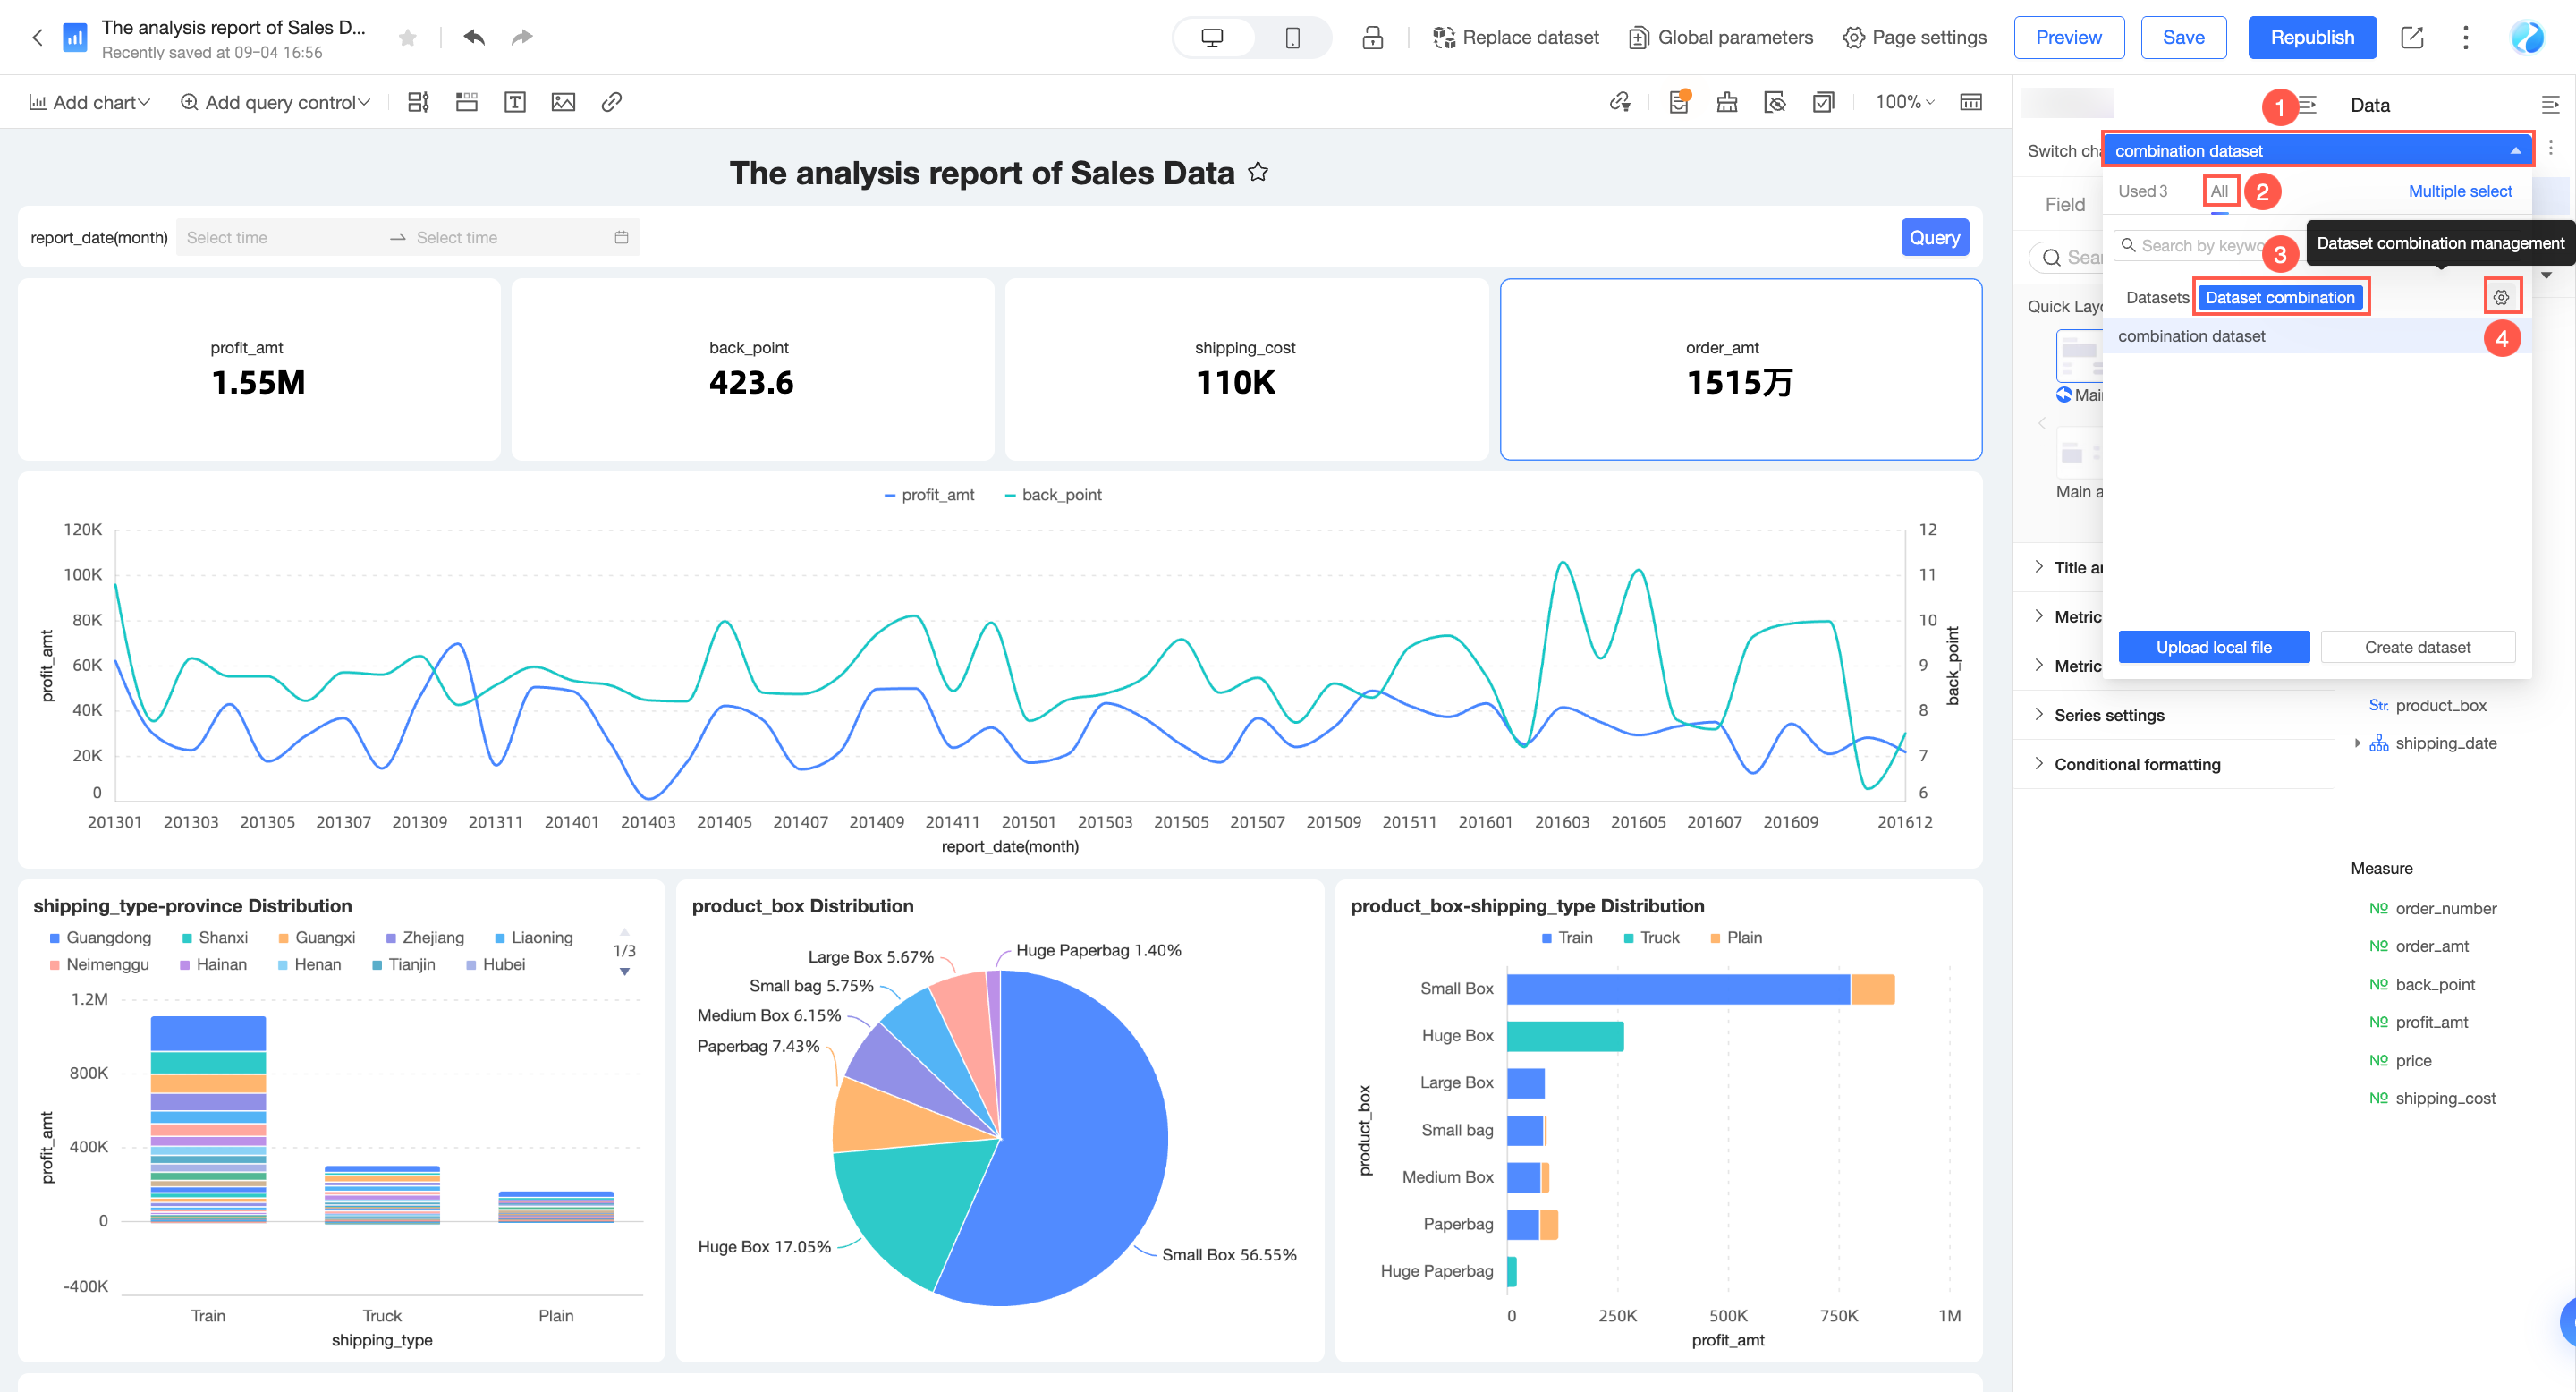
The Dataset combination management page appears.
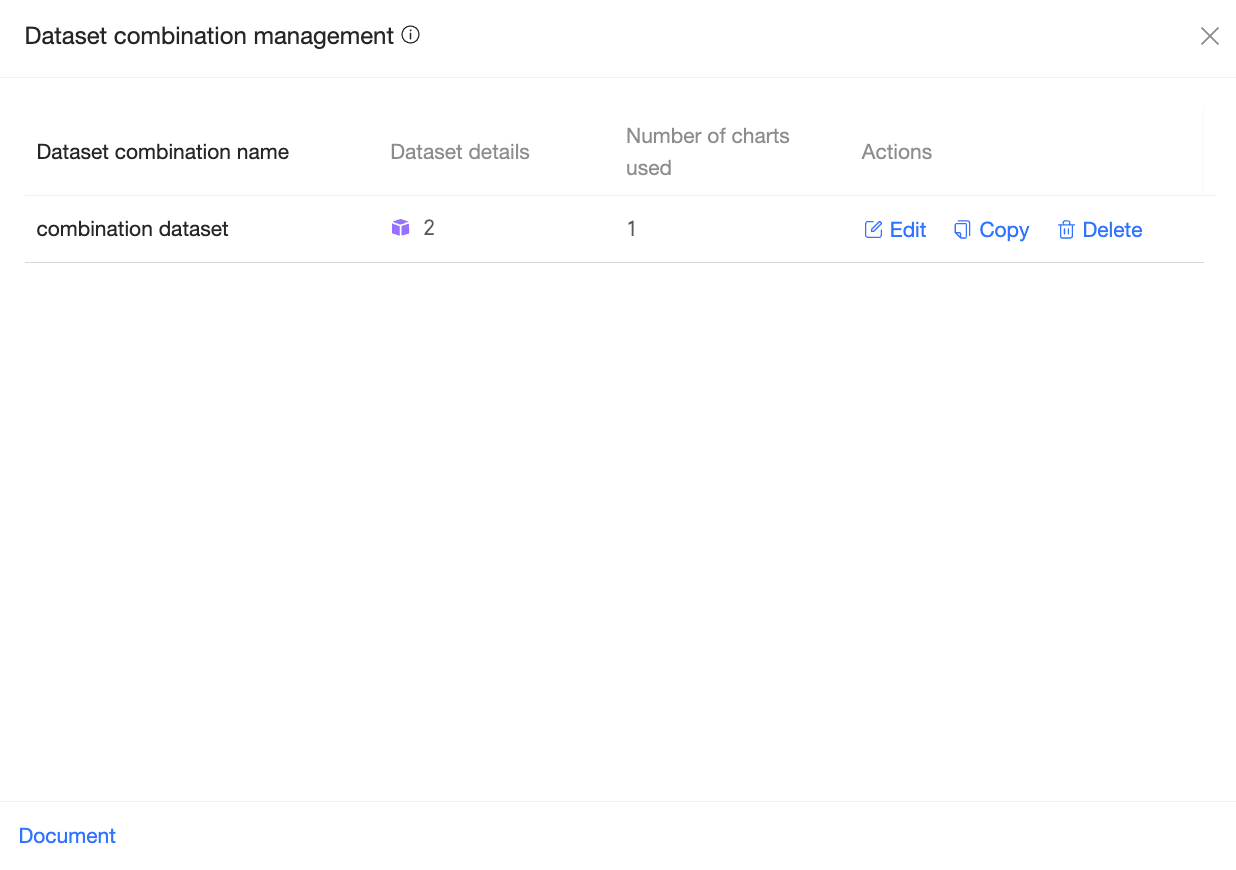
Operations
On the Dataset combination management page, you can view the combination name, dataset details, and the number of charts that use the combination. You can also edit, copy, or delete the combination.
Click Edit to open the page for editing the dataset combination. For more information, see the Create a dataset combination section in this topic.
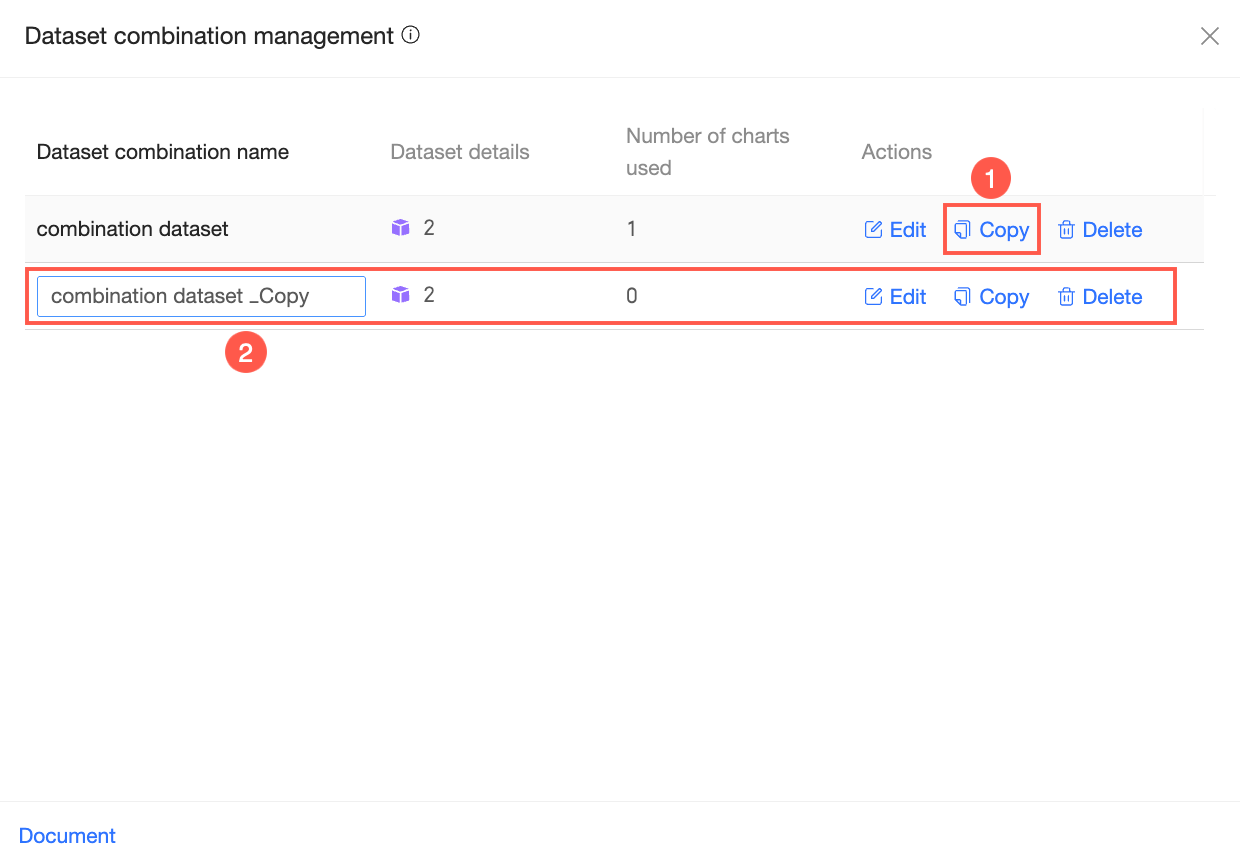
Click Copy to create a duplicate of the dataset combination. You can rename the copied combination and perform other operations as needed.
Click Delete to delete the dataset combination.
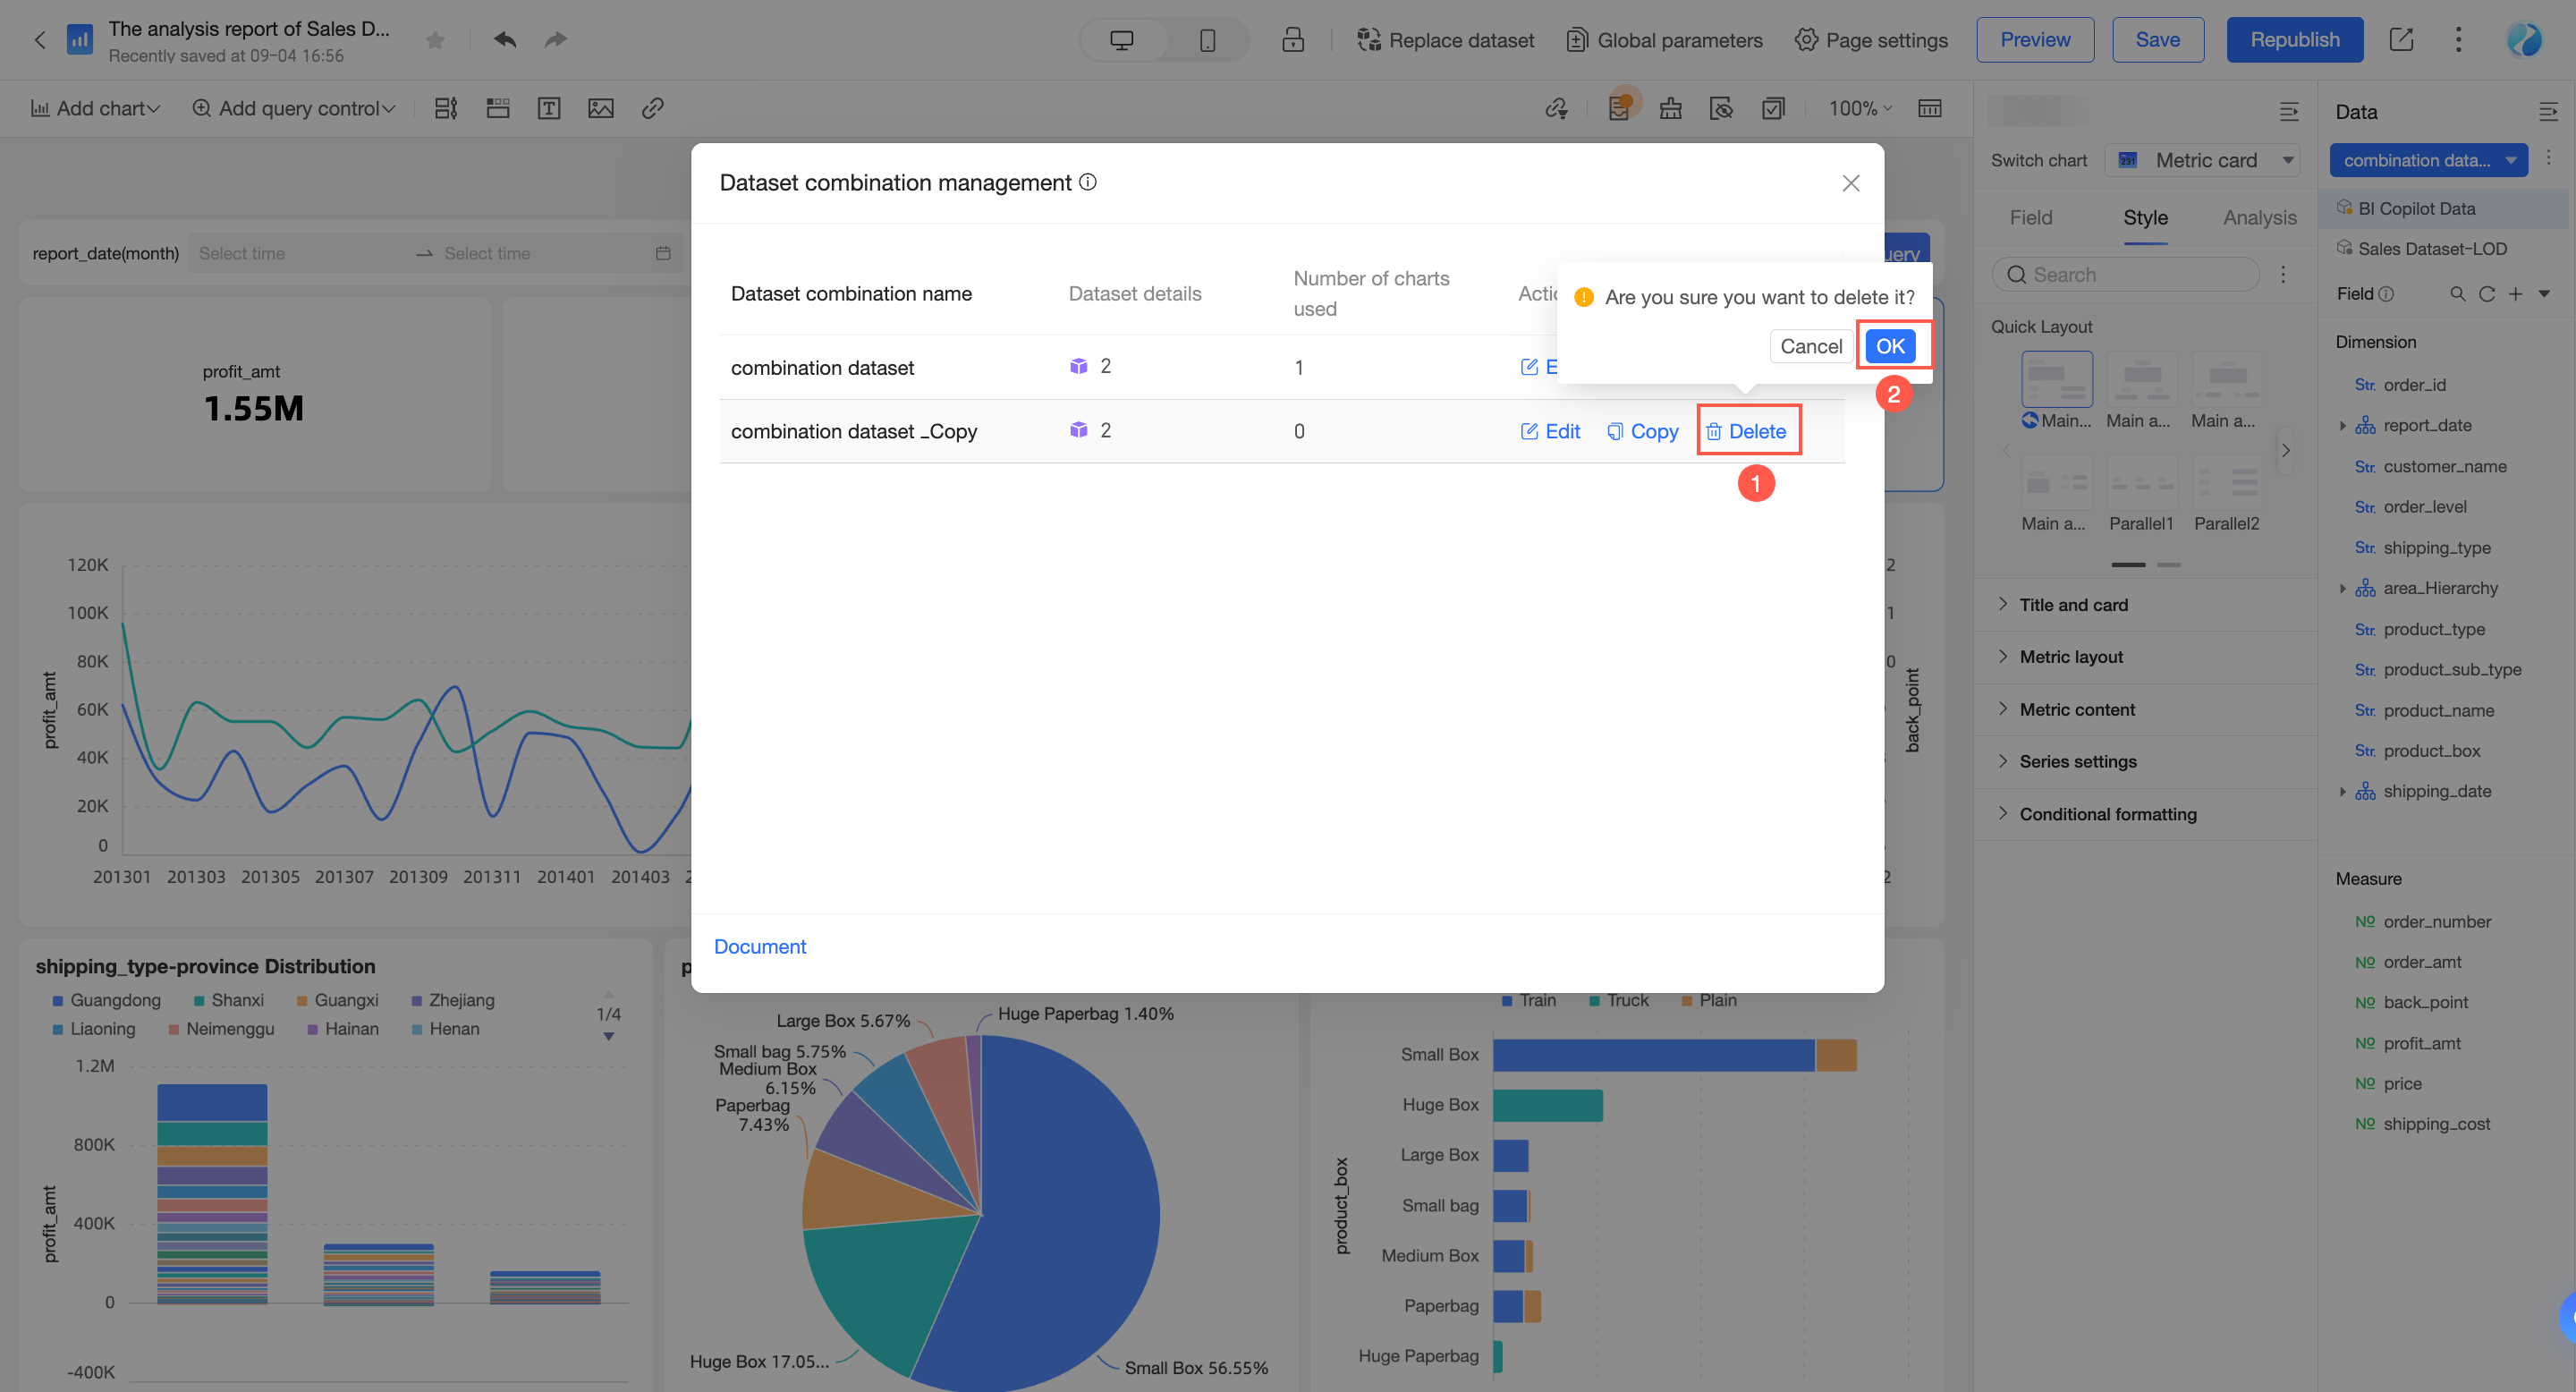 Note
NoteYou can delete a dataset combination only if it is not used by any charts (the chart count is 0). If a chart uses the combination, the deletion will fail. In this case, you must first modify the charts that use the combination before you can delete it.
Use a dataset combination to build a chart
This example shows how to use a dataset combination to create a chart in a dashboard.
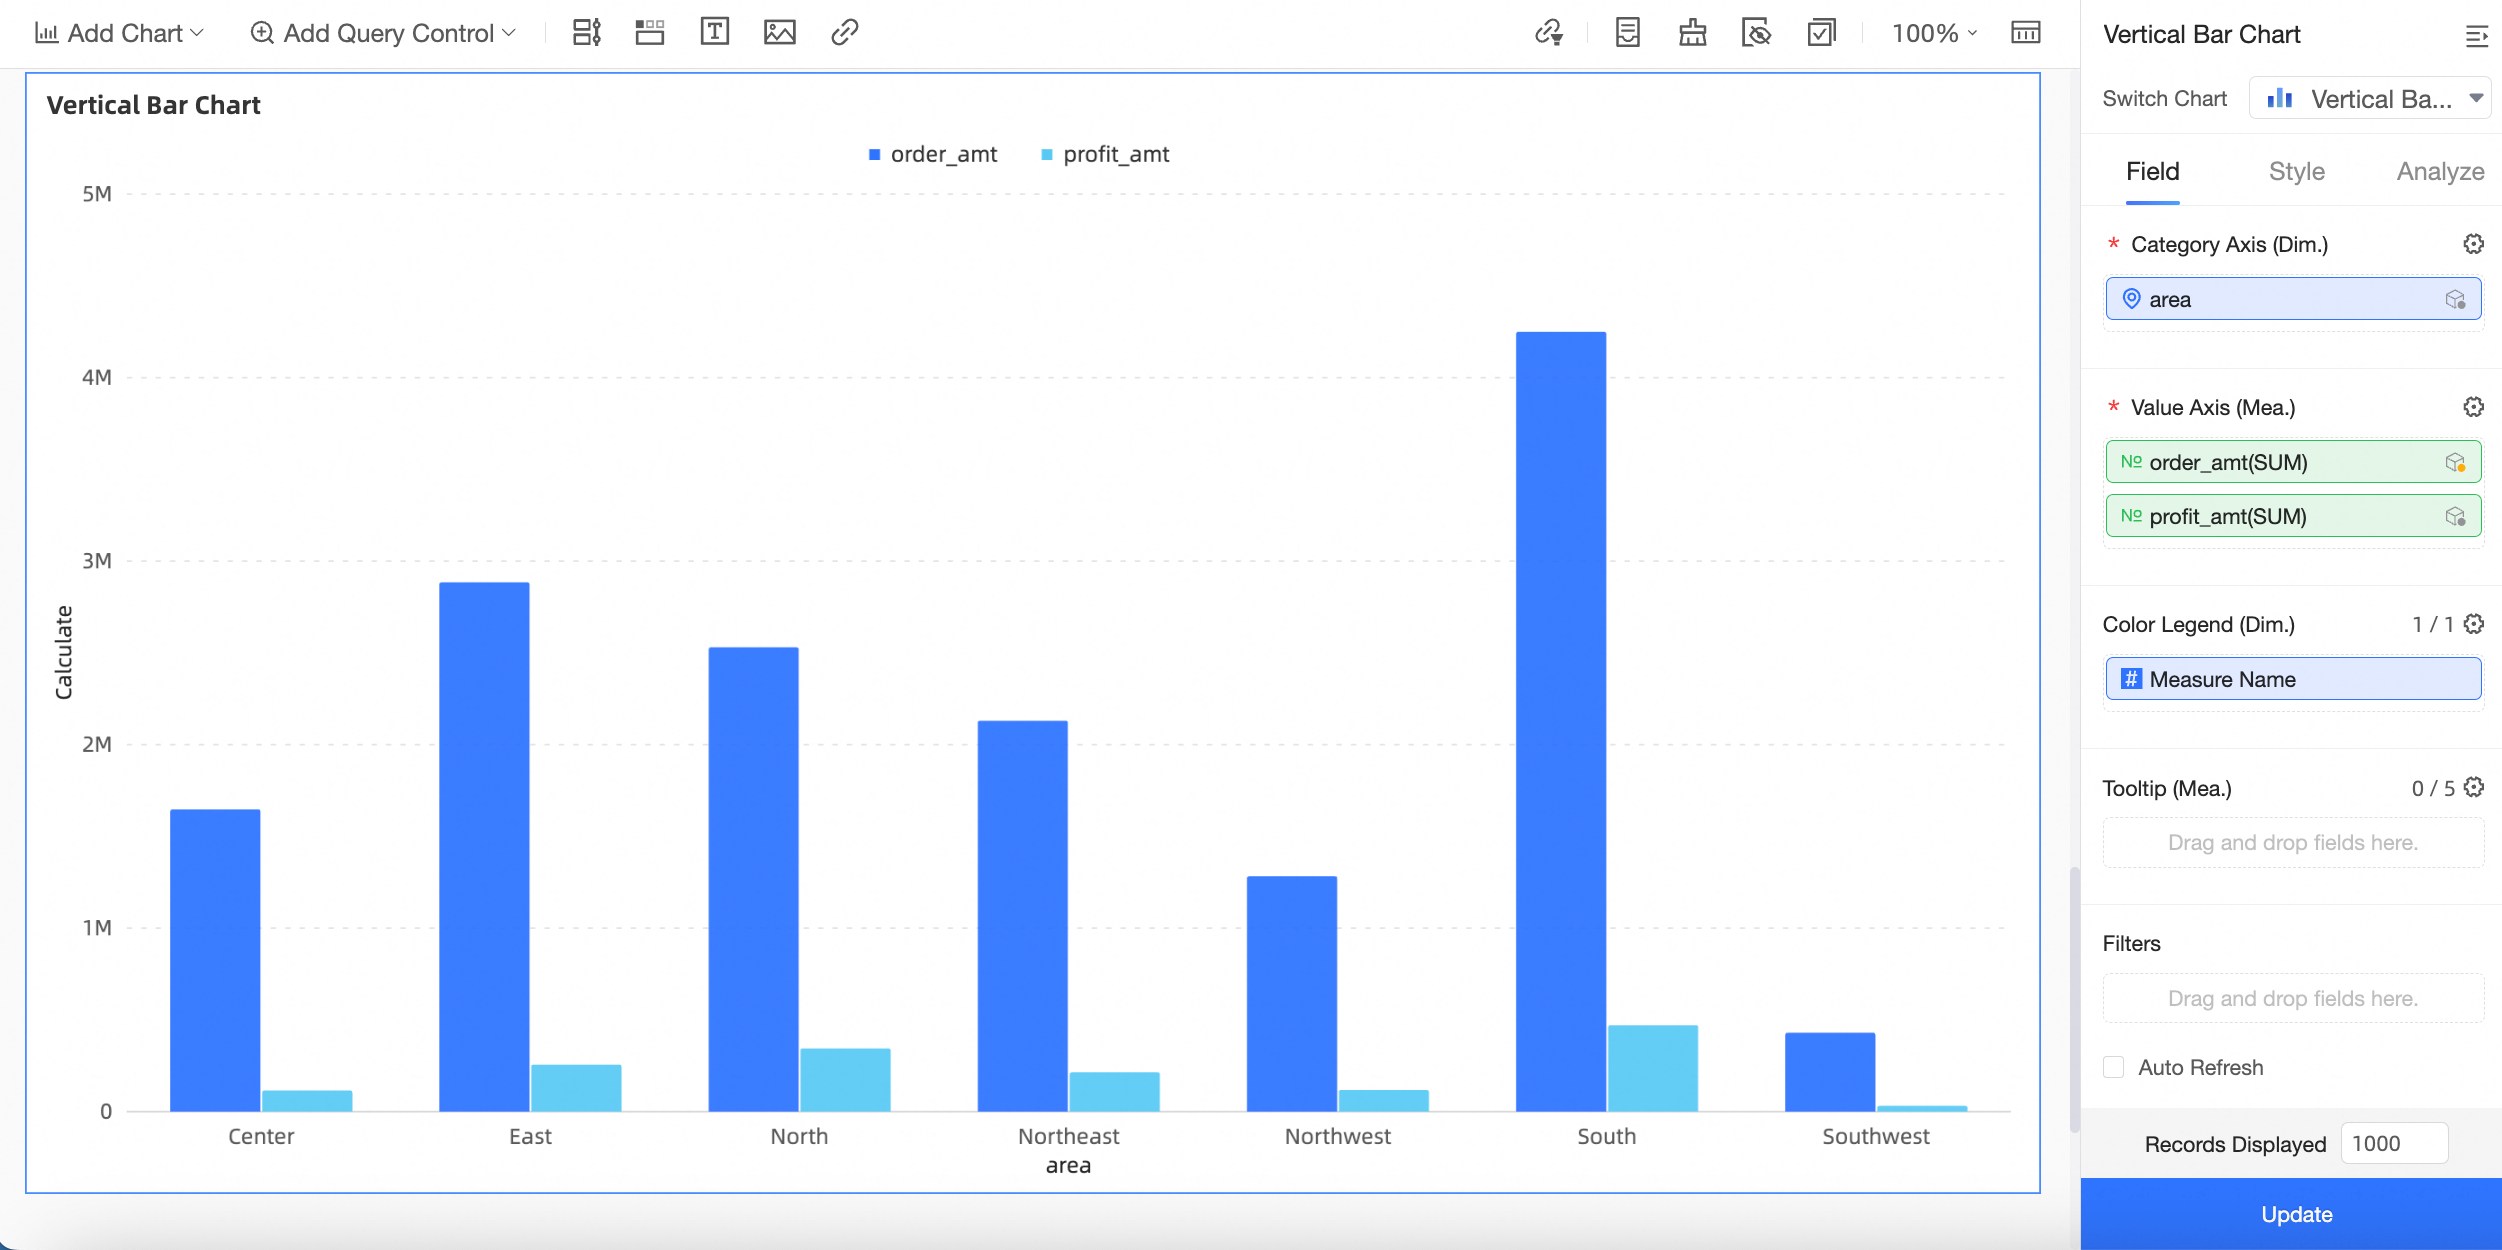
Select a dataset combination and drag fields.
In this example, select the Sales order data dataset.
On the field tab, double-click or drag the Region field from the main dataset (Order data) to the Category Axis/Dimensions area.
Double-click or drag the Order amount field from the main dataset (Order data) and the Profit amount field from the auxiliary dataset (Sales data) to the Value Axis/Measures area.
Click Update. The system automatically updates the chart.
 Note
NoteWhen you use a dataset combination, the system sends a query to each data source. The results are returned as aggregate data, which are then joined and rendered. You must ensure that each dimension value in the main dataset has only one matching value in the auxiliary dataset. Therefore, all fields in the auxiliary dataset, except for the join fields, must be aggregated. The aggregation method for dimension values is as follows: If there is only one enumerated value, that value is displayed. If there are multiple enumerated values, an asterisk (*) is displayed.
For example, if there is only one Product Package Box value for a given province and region, that value is displayed (Small box). If there are multiple Product Package Box values, * is displayed.
(Province and Region are join fields. The Product package field is not a join field.)
Click the auxiliary dataset to view the join status of its fields. You can manually join or unjoin fields.
The
 icon indicates that the field is currently a join field. Click the icon to unjoin the field.
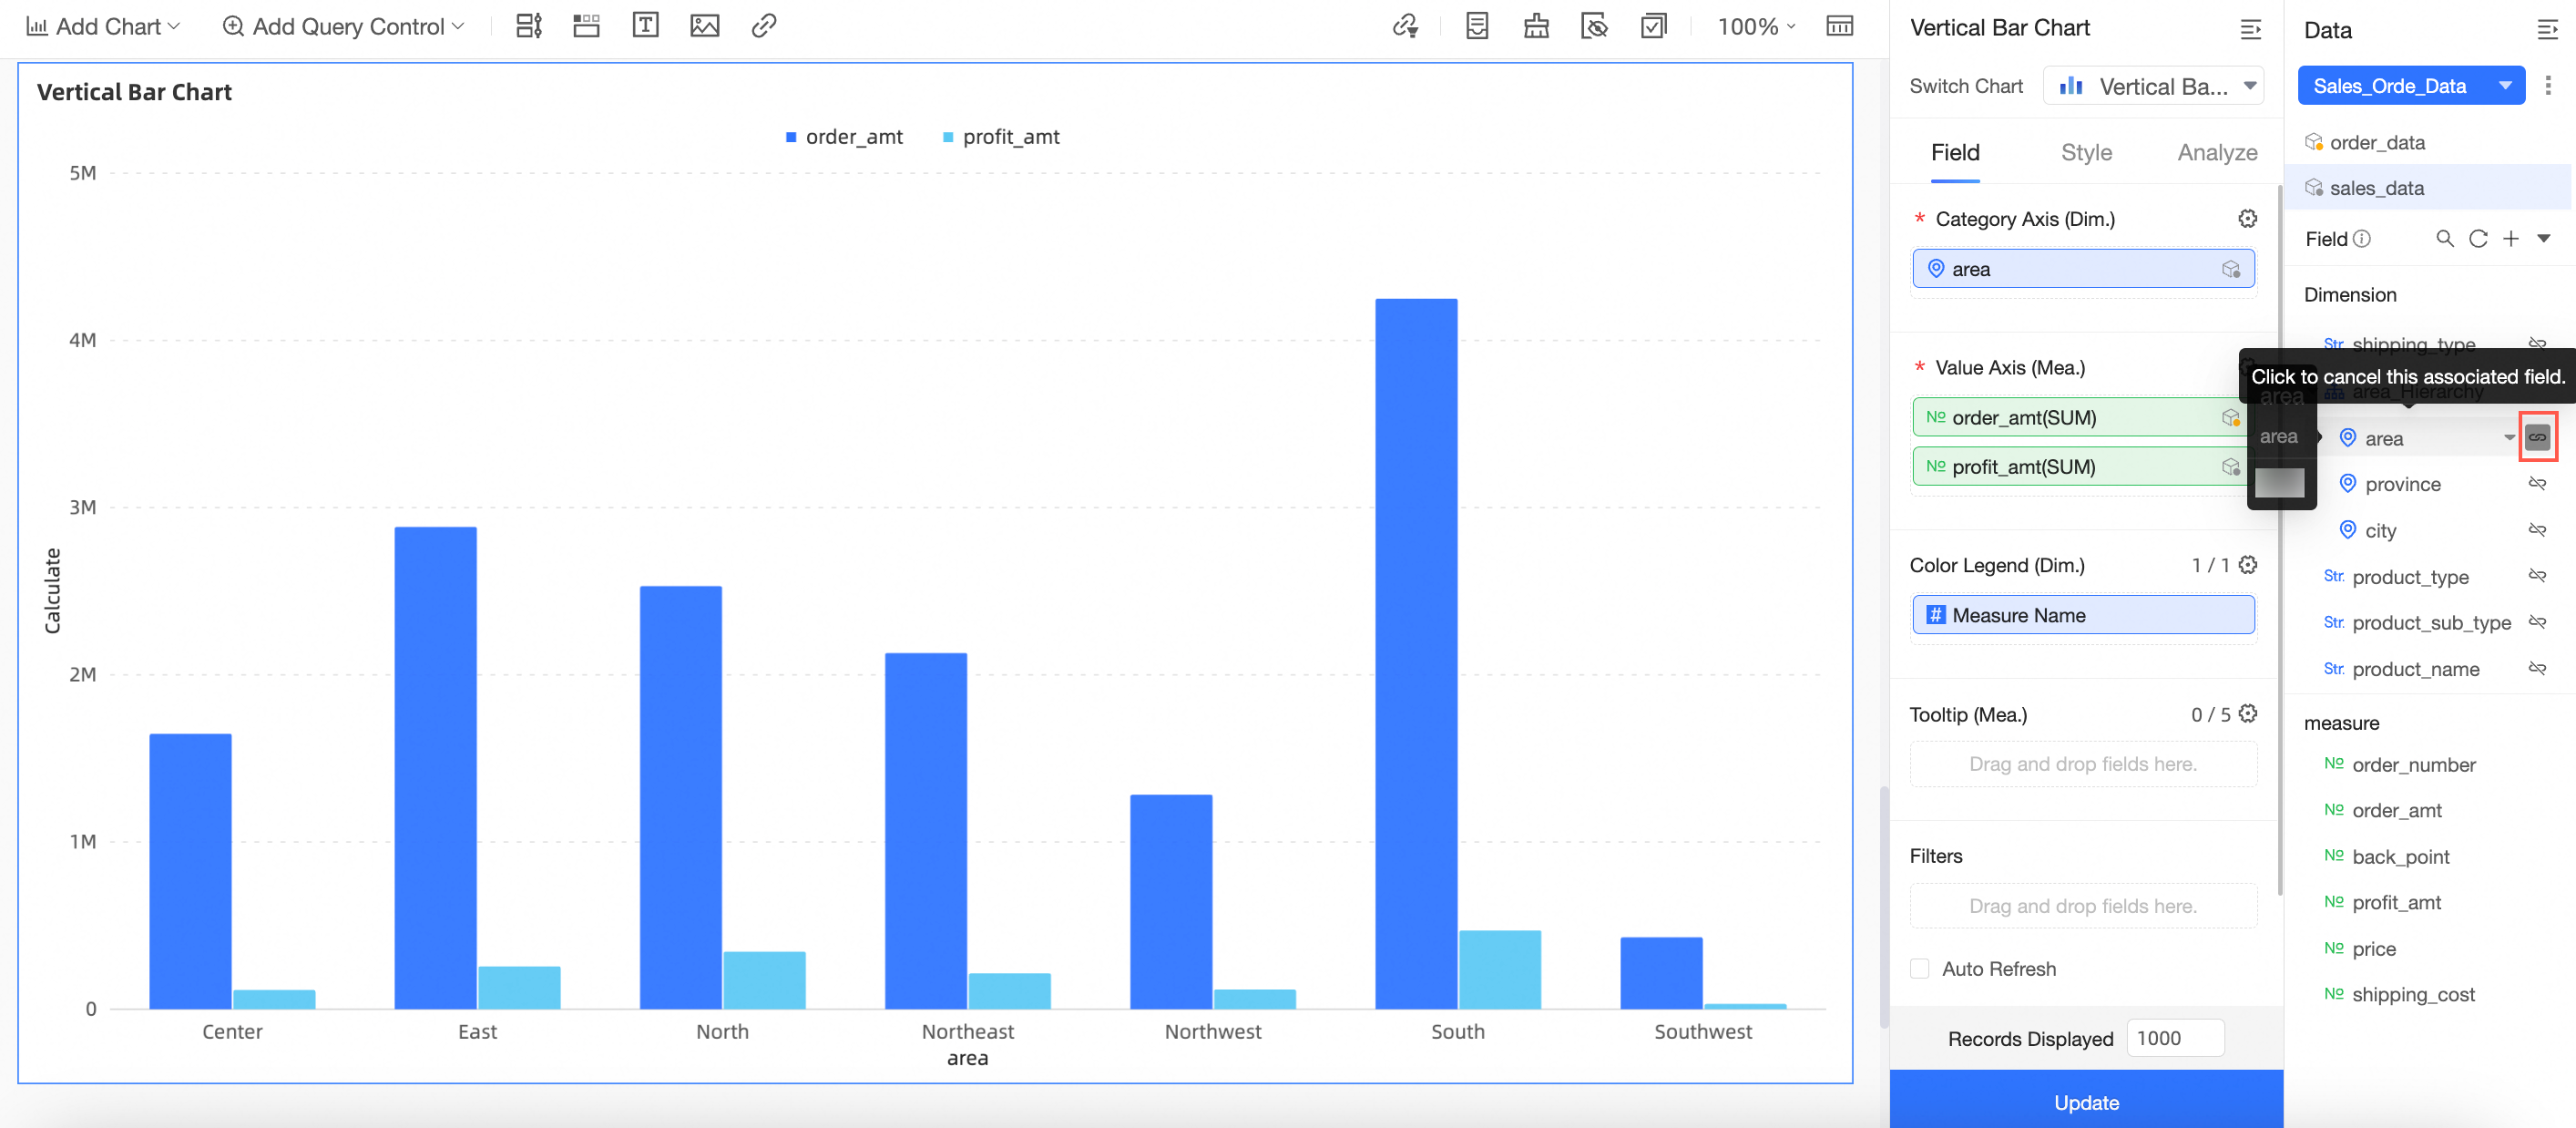
The
 icon indicates that the field is not currently a join field. Click the icon to make it a join field.
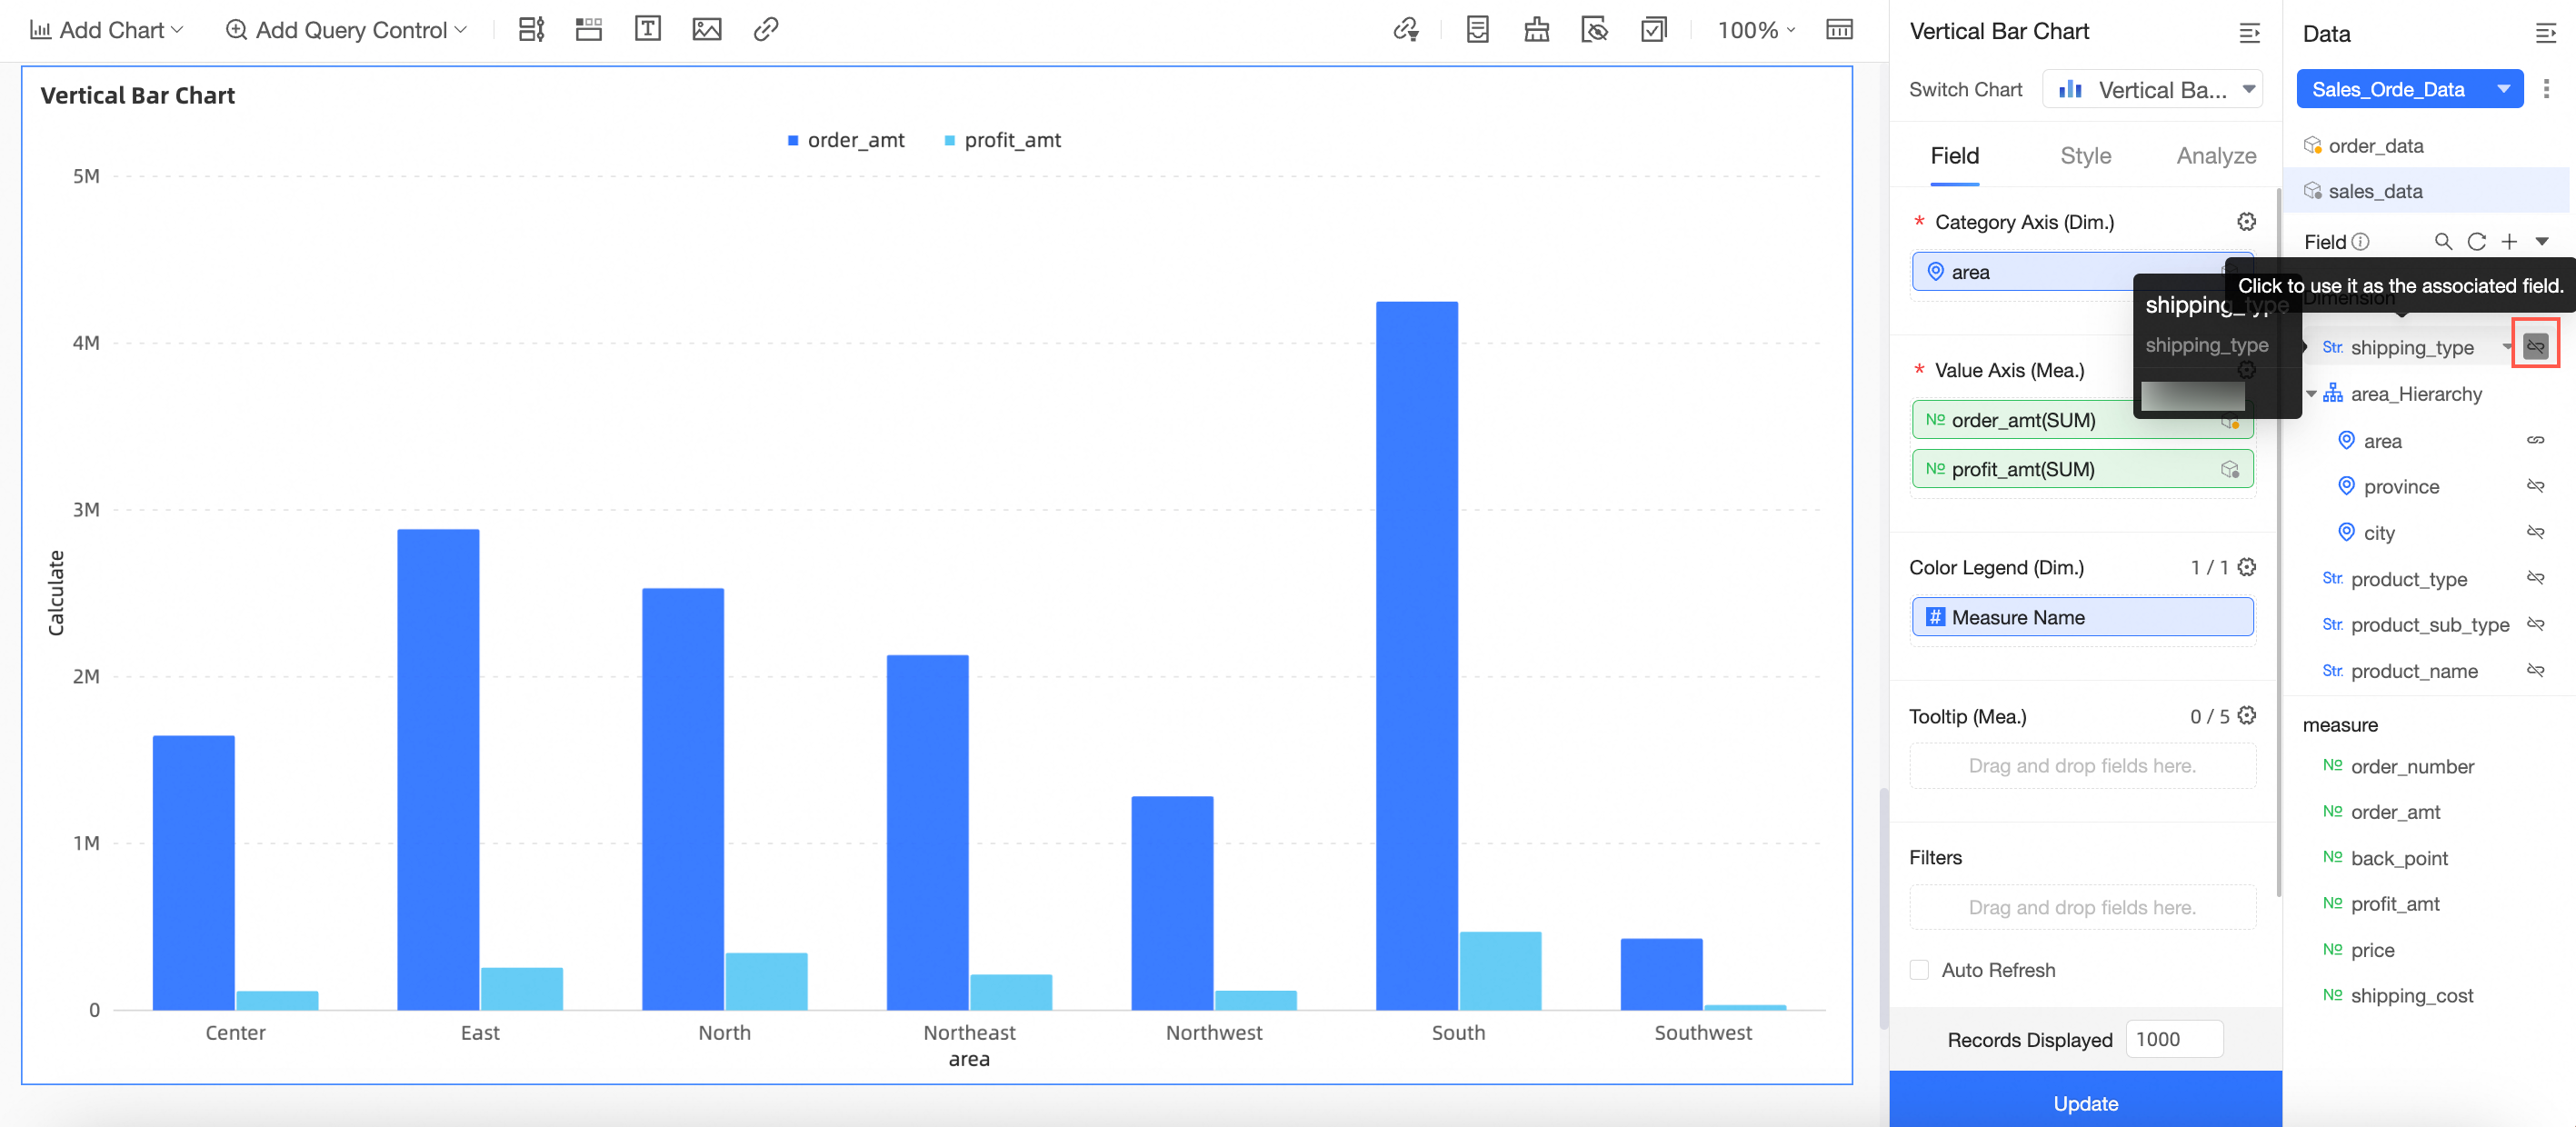 Note
NoteWhen you drag a join field into the chart, the corresponding join icon is automatically enabled.
At least one join icon must be enabled. Otherwise, the system cannot calculate the join relationship between the auxiliary and main datasets.
Enabling or disabling the join icon affects only the current chart.
Scenarios
You must use all join fields from the main dataset.
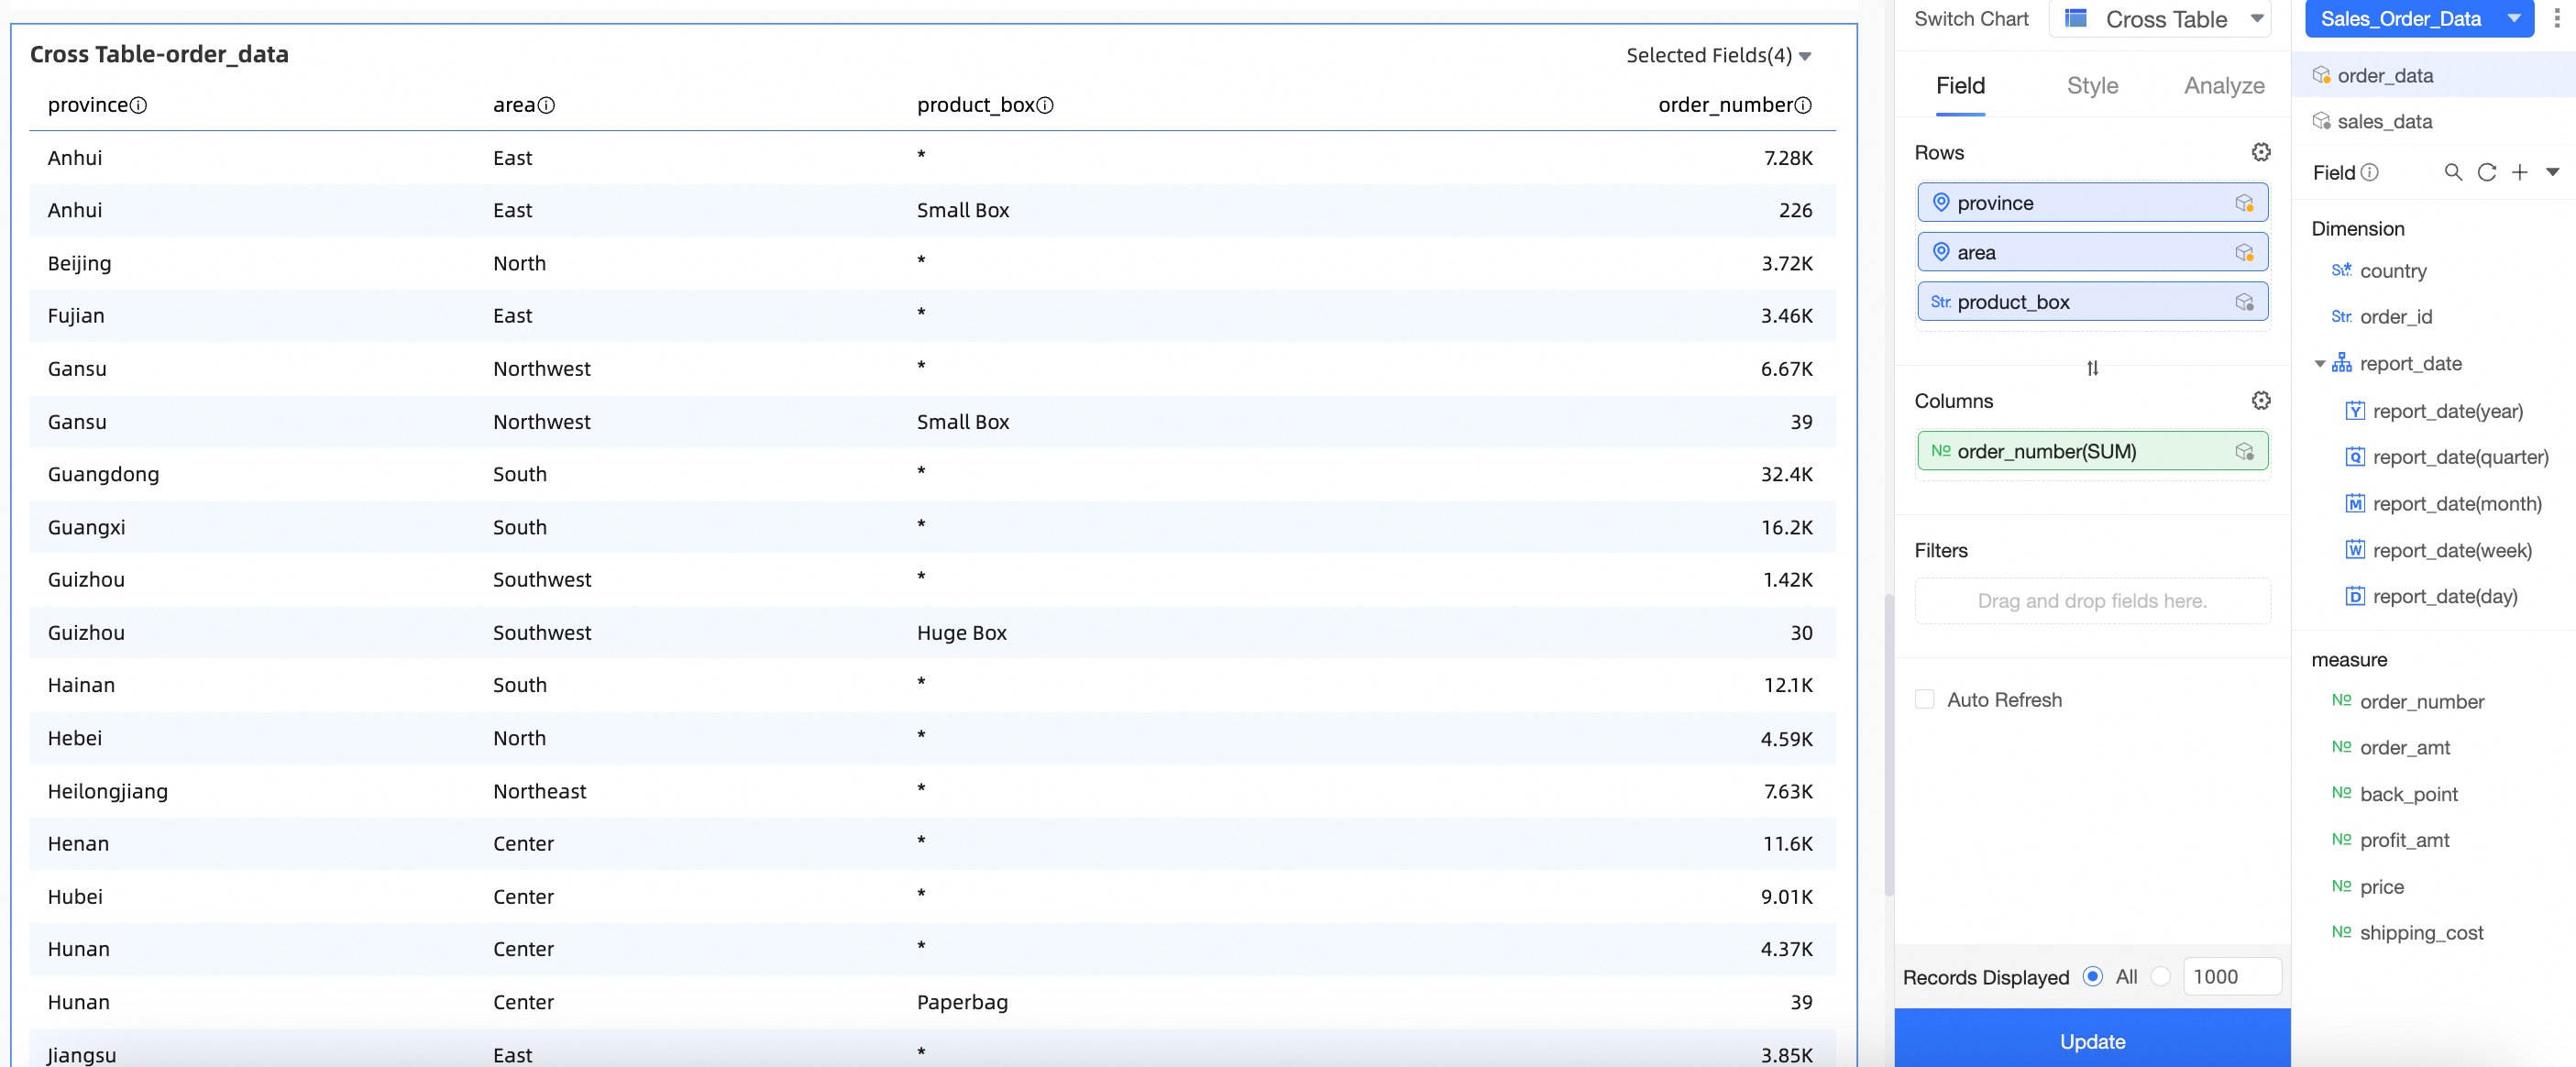
Scenario 1: Chart dimension fields include all join fields from the main dataset
Procedure:
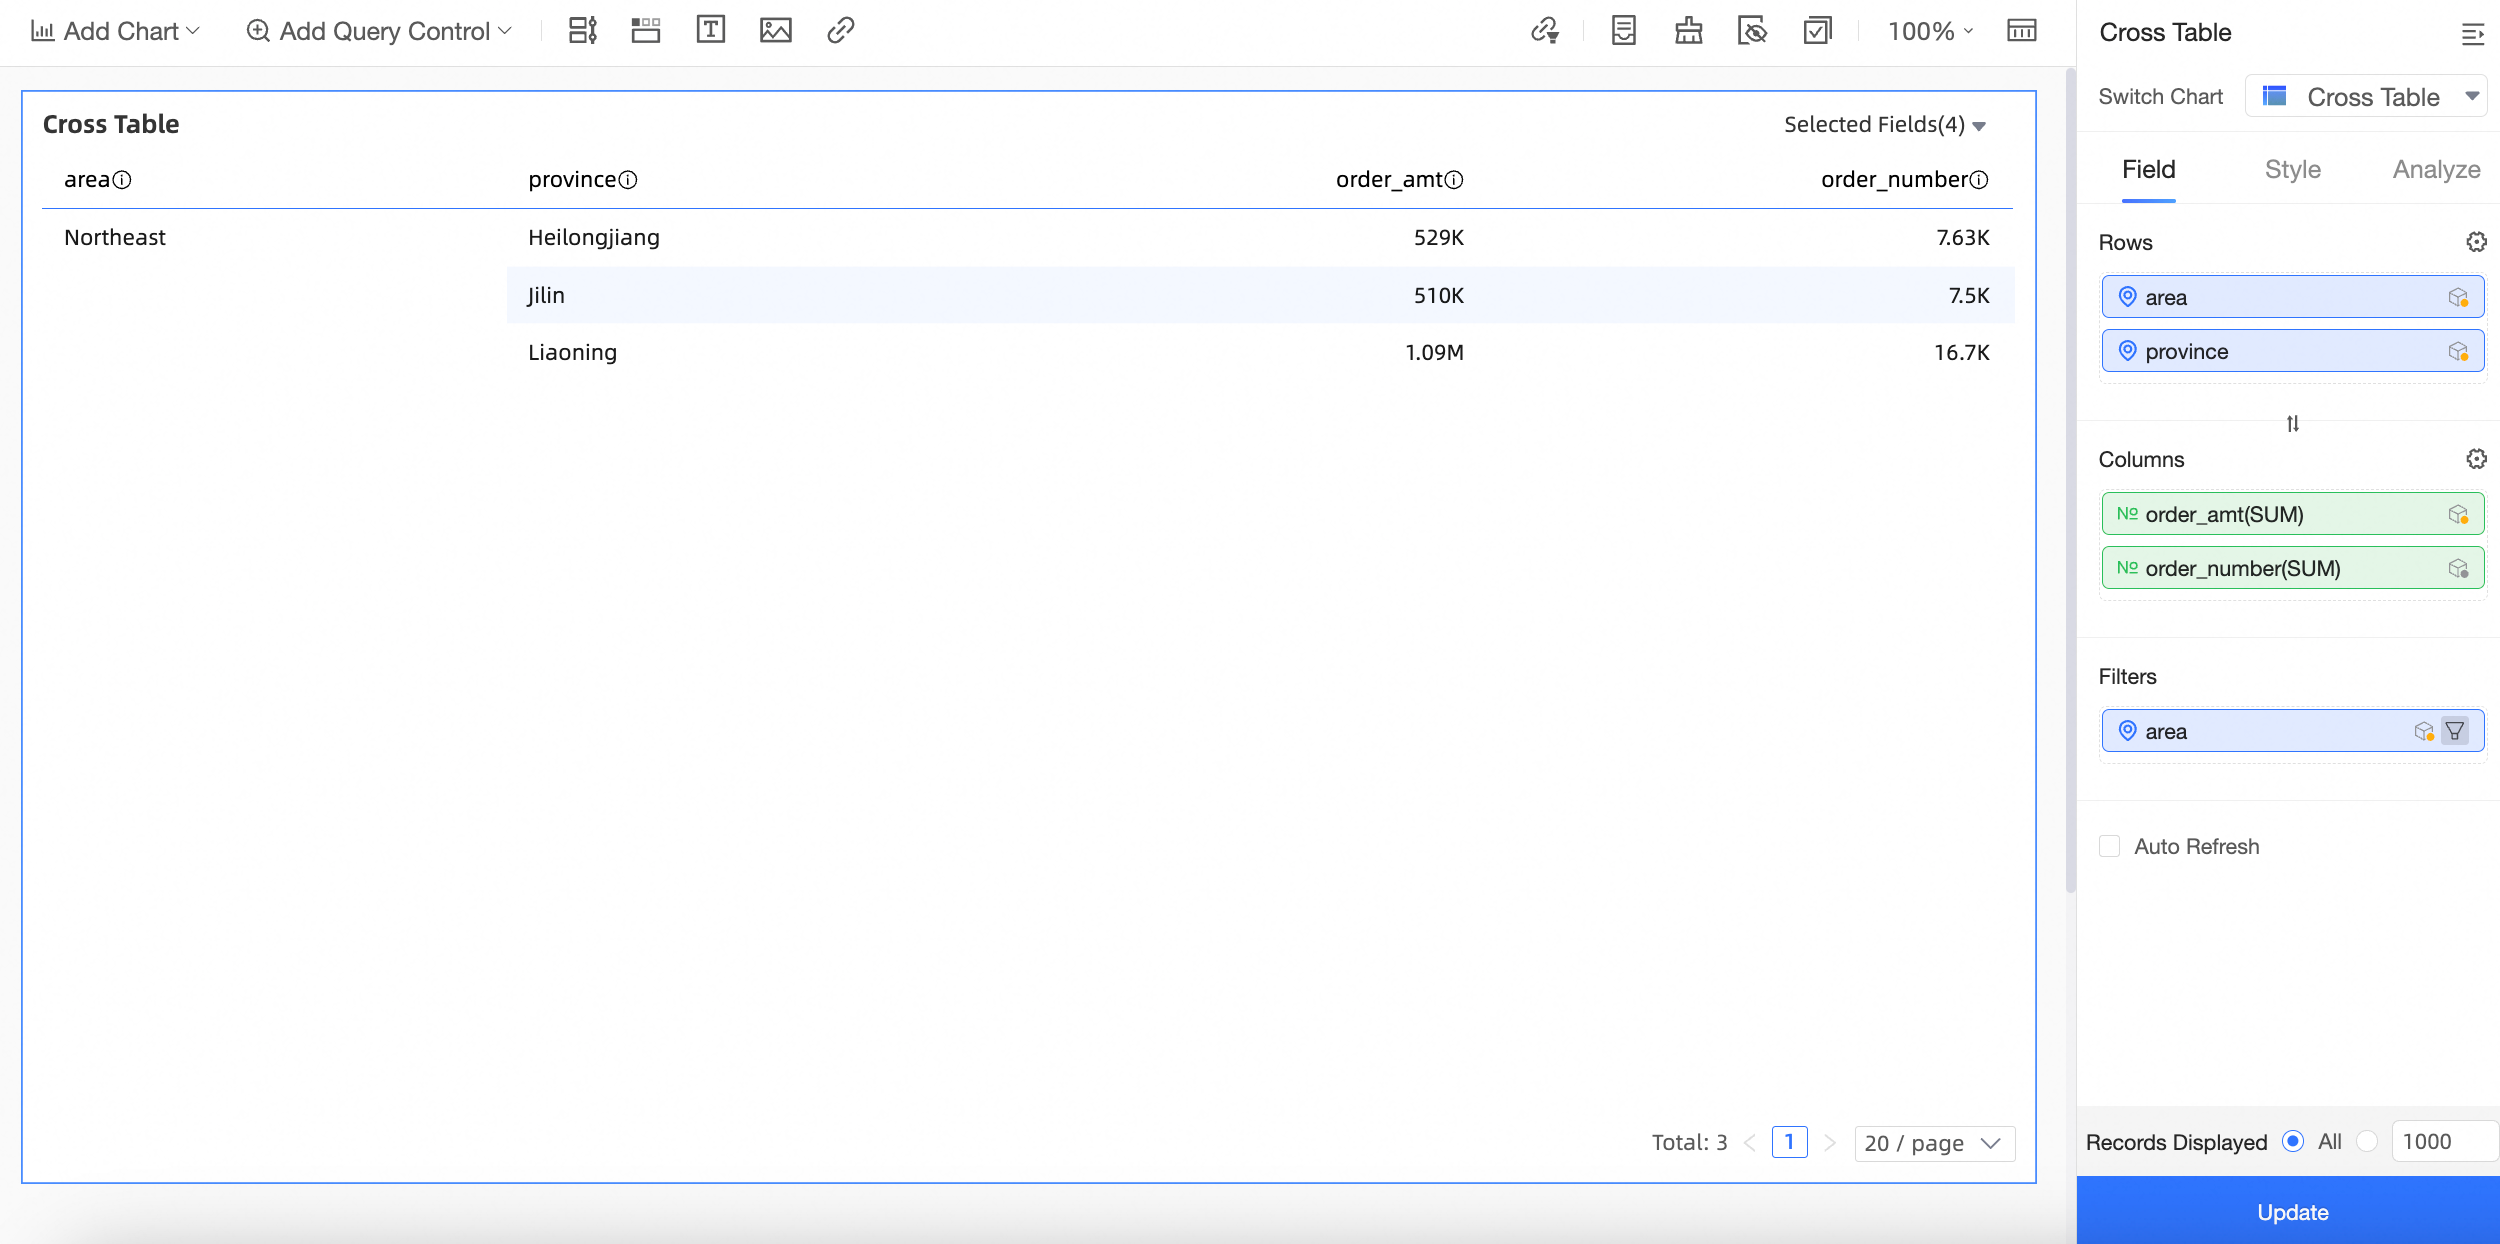
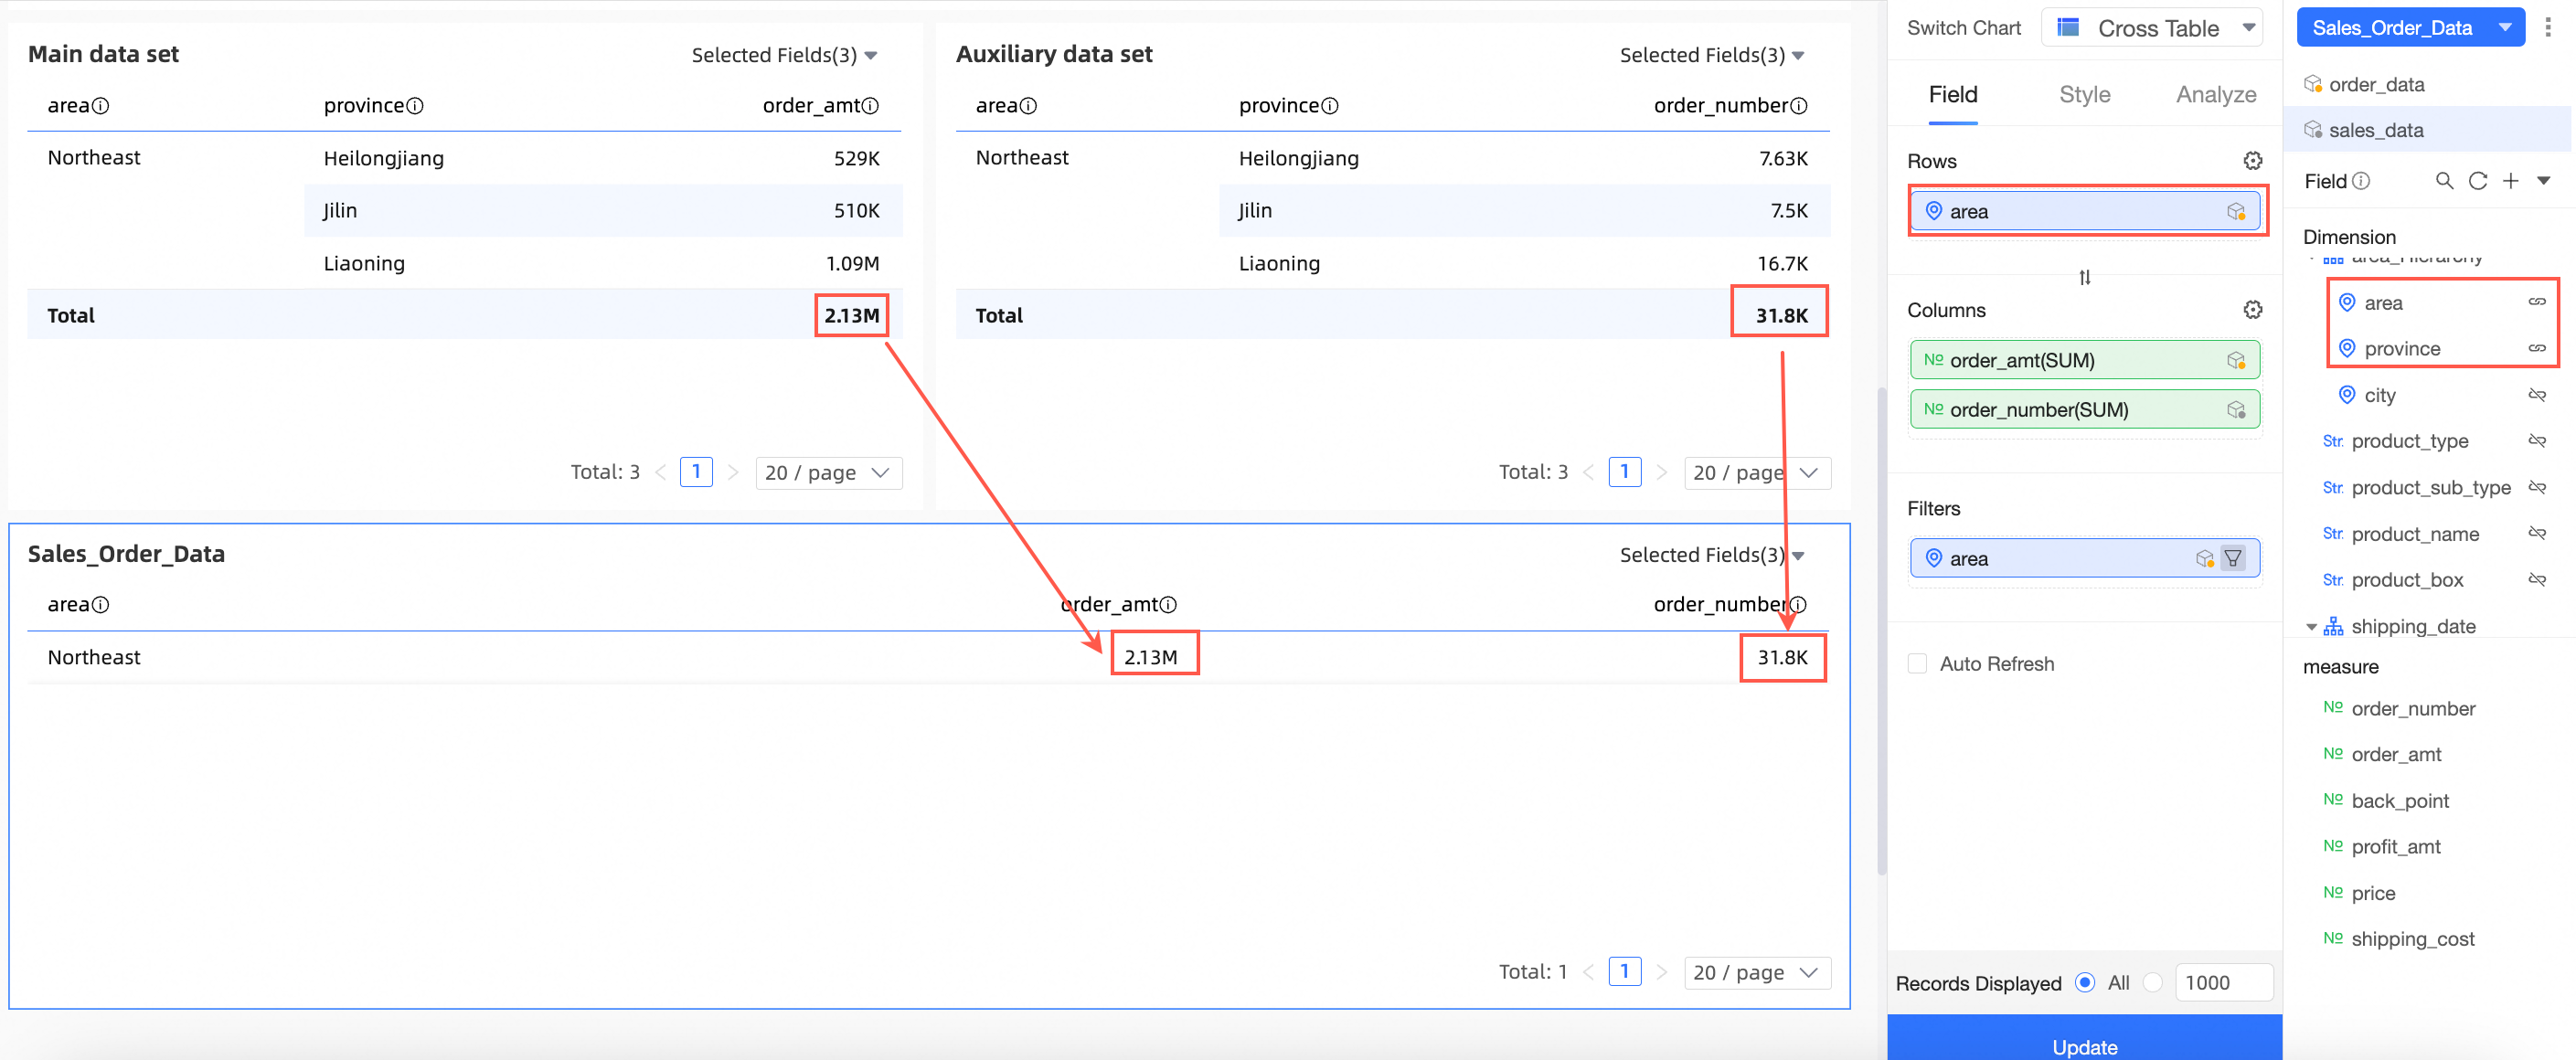
On the dashboard edit page, create a cross table as shown in the figure.

Select the Sales order data combination created in the Create a dataset combination section.
Drag the Region and Province fields from the main dataset to the Rows area. Drag the Order amount and Quantity fields from the auxiliary dataset to the Columns area.
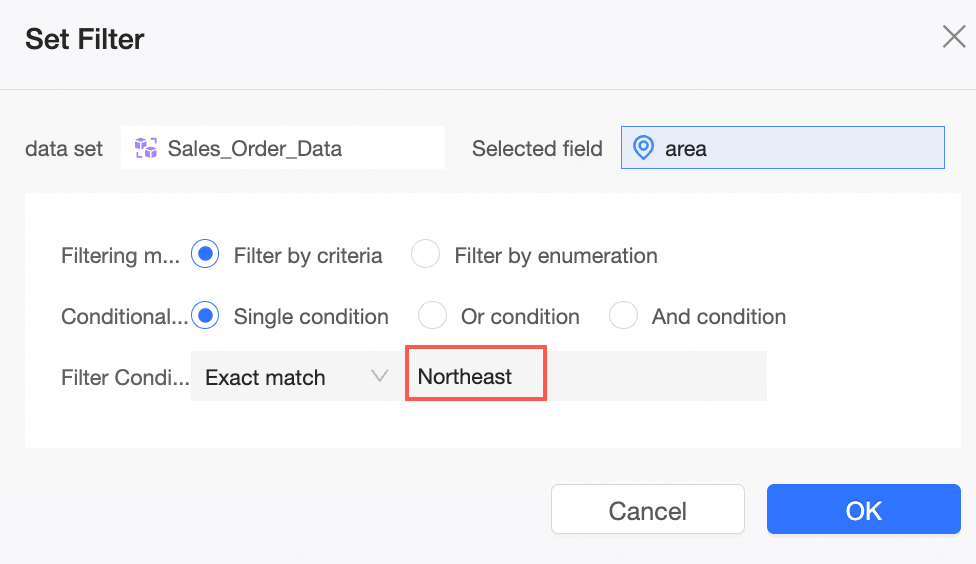
Drag the Region field from the main dataset to the Filters area and filter for the Northeast region.
Click Update. The chart is updated as shown in the following figure:
Explanation of display logic:
Main dataset: Order data, with Region and Province as dimension fields and Order amount as a measure field.
Auxiliary dataset: Sales data, with Region and Province as dimension fields and Quantity as a measure field.
Join fields: Region and Province.
As shown in the following figure, the cross table for the "Sales order data" combination takes the Region, Province, and Order amount fields from the main dataset and the Quantity field from the auxiliary dataset, and displays them together.
Scenario 2: Chart dimension fields do not include all join fields from the main dataset
Procedure
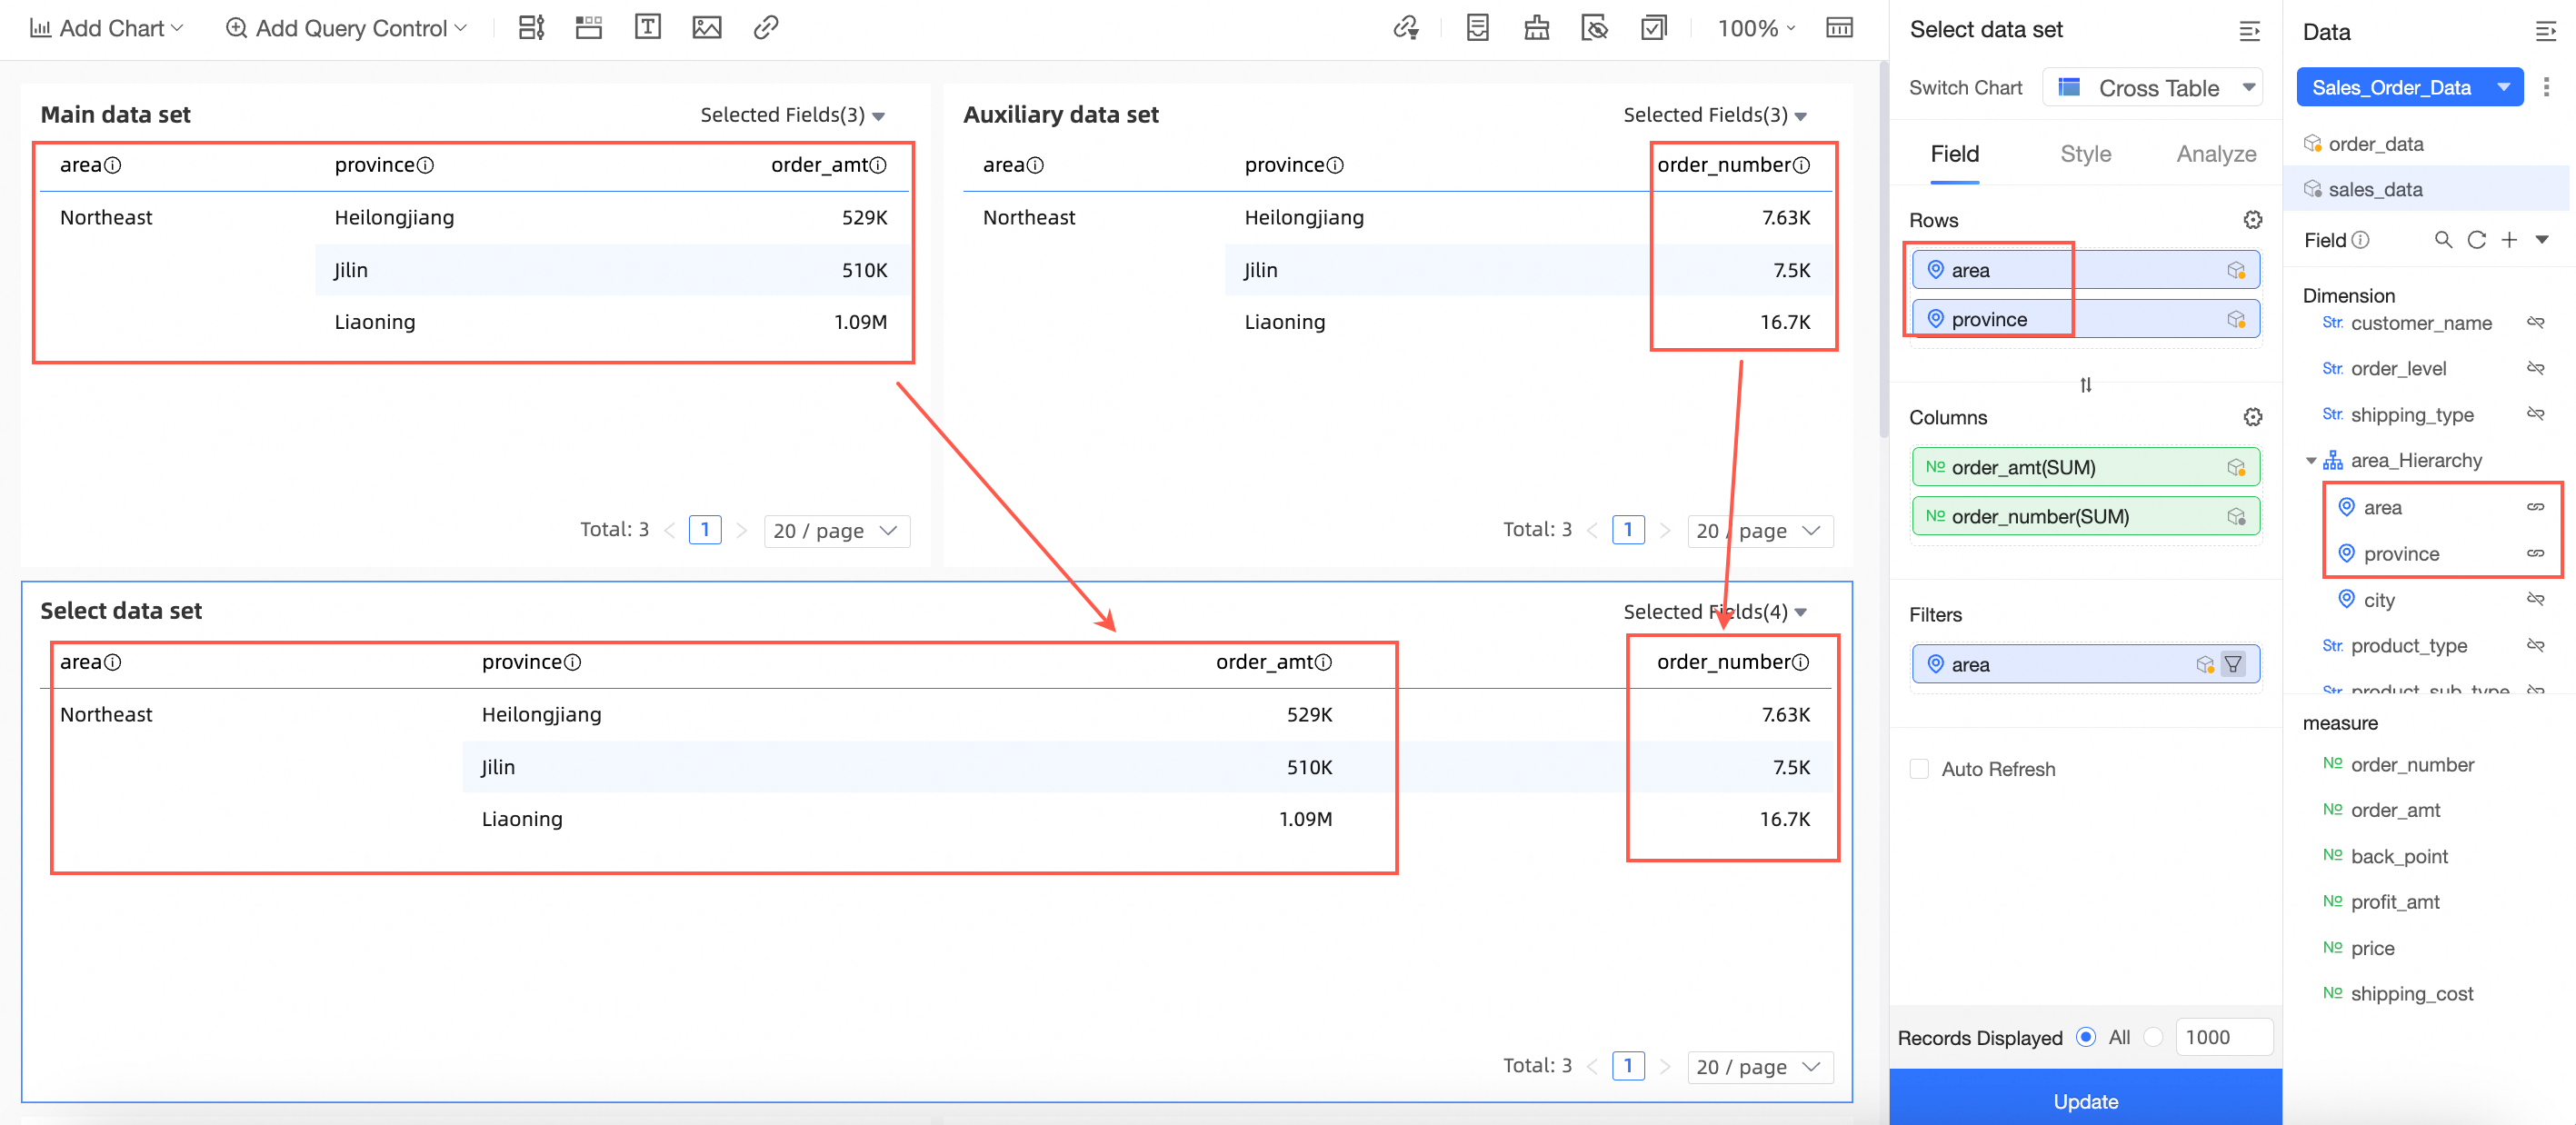
On the dashboard edit page, create a cross table as shown in the figure.
Select the Sales order data combination created in the Create a dataset combination section.
Drag the Region and Order amount fields from the main dataset to the Rows area. Drag the Quantity field from the auxiliary dataset to the Columns area.
Drag the Region field from the main dataset to the Filters area and filter for the Northeast region.
Click Update. The chart is updated as shown in the following figure:
Explanation of display logic:
Main dataset: Order data, with Region and Province as dimension fields and Order amount as a measure field.
Auxiliary dataset: Sales data, with Region and Province as dimension fields and Quantity as a measure field.
Join fields: Region and Province.
As shown in the following figure, the cross table for the "Sales order data" combination takes the Region and Order amount fields from the main dataset and the Quantity field from the auxiliary dataset. The Order amount and Quantity are re-aggregated (summed) data.
In this scenario, only four aggregation methods are supported: sum, count, maximum, and minimum. Using other methods causes an error.
If you do not use all join fields of the main dataset, features such as period-over-period comparisons, auxiliary lines, secondary indicators, and some aggregation functions are unavailable. To resolve this, you can cancel the join for the unselected fields or use all join fields from the main dataset.
Limits
Unsupported features
Dataset combinations are supported in dashboards, data dashboards, and workbooks. They are not supported in Downloads and ad hoc analysis.
The following charts do not support dataset combinations:
Detail tables, metric decomposition trees, and metric relationship graphs in dashboards.
Detail data in workbooks.
Detail tables in data dashboards.
The following features are not supported for charts that use dataset combinations:
Drilling, alert monitoring, dataset replacement, fluctuation analysis, automatic insights, and AI chat.
The following chart capabilities are not supported for charts that use dataset combinations:
Subtotals in cross tables.
Adding data comparisons in line charts.
A dataset combination can display a maximum of 10,000 rows of data.
Unsupported under specific conditions
During re-aggregation:
Aggregation methods are limited to sum, count, maximum, and minimum.
Period-over-period comparisons and secondary indicators in cross tables are not supported.
Auxiliary lines are not supported.
Fields in auxiliary datasets do not support secondary indicators in cross tables.
Totals are not supported when rows and columns are mixed in a cross table.