Add a MaxCompute data source to connect a MaxCompute database to Quick BI. After the connection is established, you can analyze and visualize data in Quick BI. Quick BI can connect to MaxCompute over the public network. This topic describes how to add a MaxCompute data source.
Prerequisites
You have created a MaxCompute project. For more information, see Create a MaxCompute project.
Limits
Versions 1.0 and 2.0 are supported.
Background Information
If you use a MaxCompute data warehouse and want to analyze the data in Quick BI, you can add a MaxCompute data source. For more information about MaxCompute, see What is MaxCompute.
The loading strategy for table lists from MaxCompute data sources has been changed from asynchronous loading to synchronous loading with caching. If the cache is not hit, data retrieval takes 10 to 15 seconds.
Limits
Versions 1.0 and 2.0 are supported.
Only workspace administrators and developers can add data sources.
Procedure
Log on to the Quick BI console.
To add a data source, follow the steps shown in the figure below.
Navigate to the Create Data Source interface from Create Data Source Entry Point.
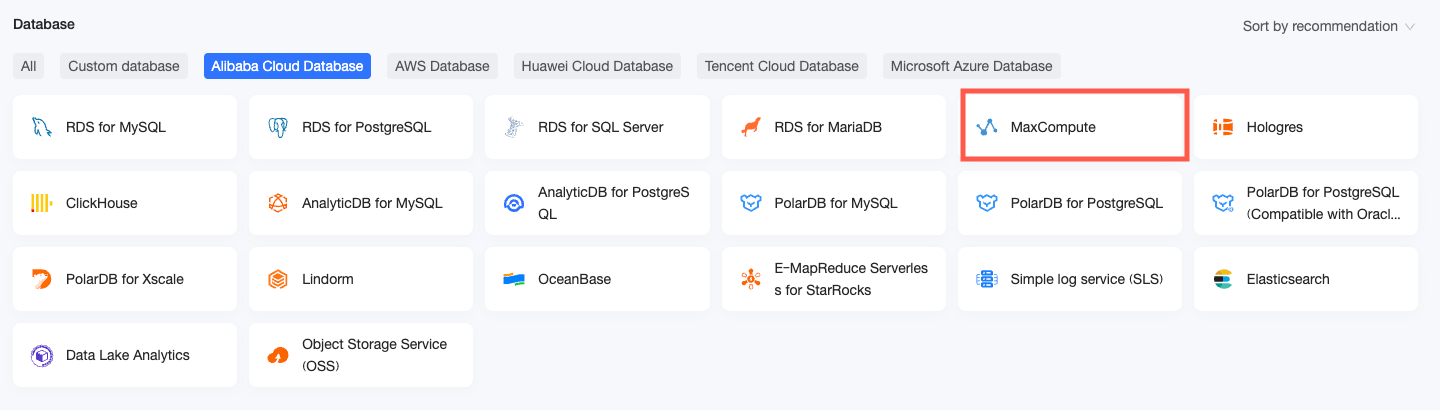
On the Alibaba Cloud Databases tab, select MaxCompute.
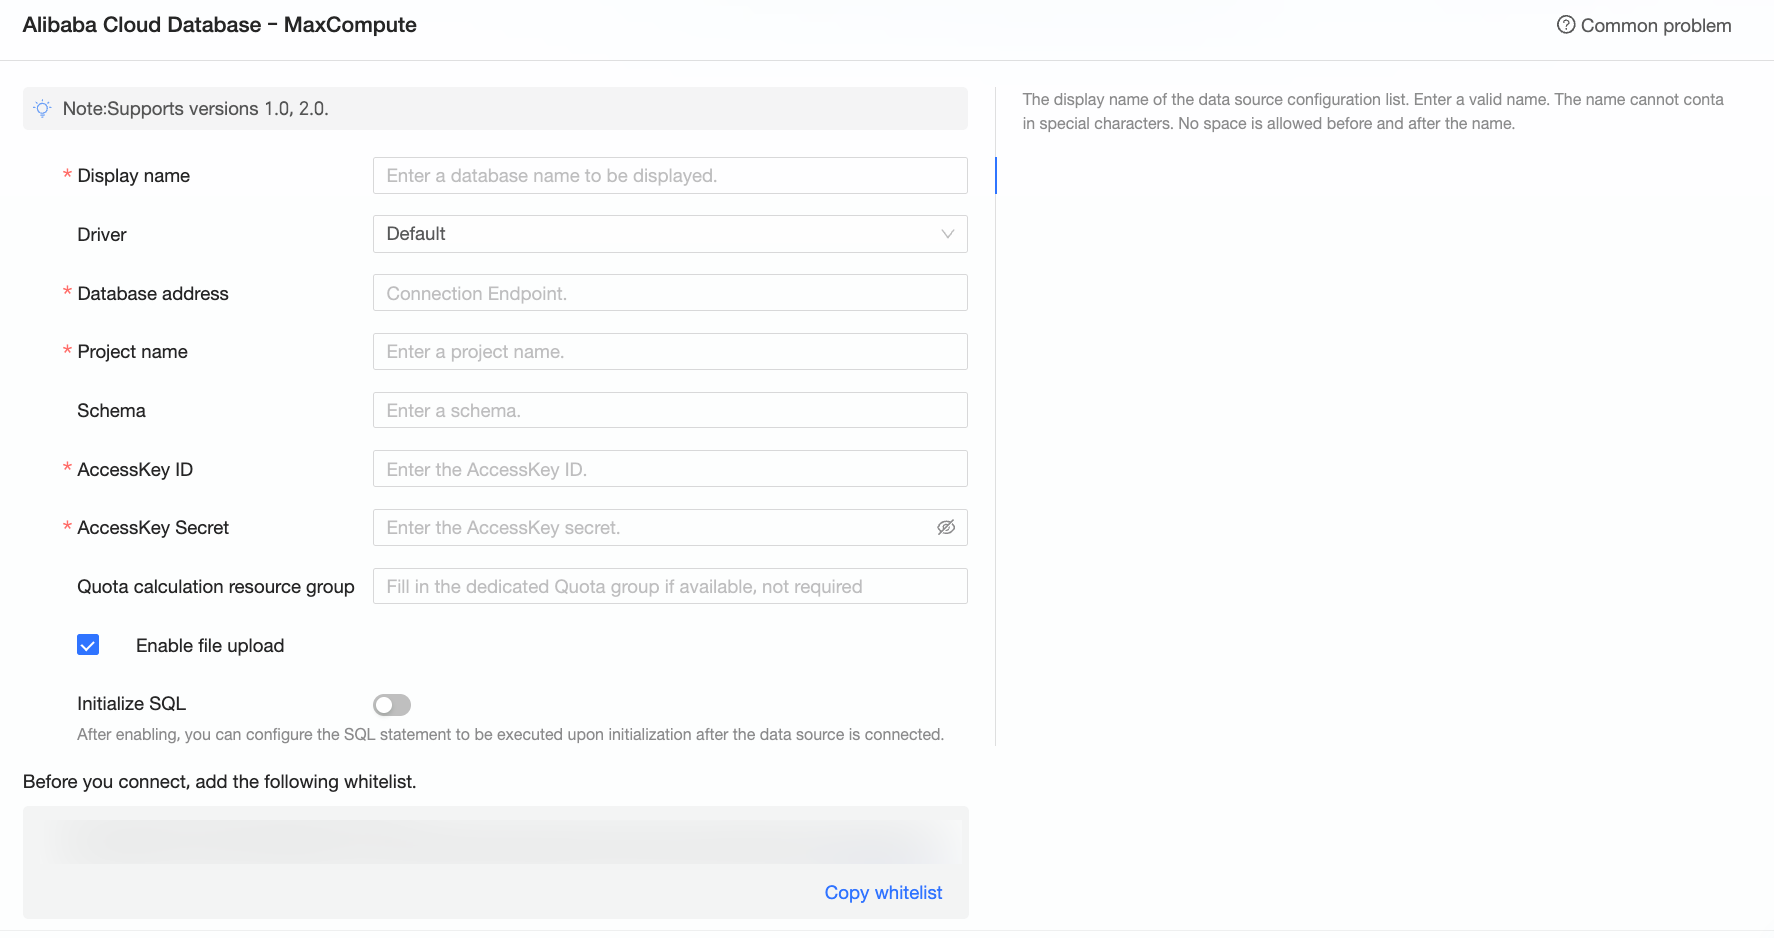
In the Configure Connection dialog box, set the parameters.
Name
Description
Display Name
The display name of the data source in the data source list.
Enter a name that meets the requirements. The name cannot contain special characters or leading or trailing spaces.
Database Address
The URL of the MaxCompute project. You can connect over the public network or an internal network. We recommend that you use an internal endpoint to avoid potential fees for public network access. If the network is unavailable, you may need to disable the whitelist.
Select the internal endpoint that corresponds to the region of your project. To find the region, log on to the MaxCompute console and check the region in the upper-left corner.
For example, the internal endpoint for China (Hangzhou) is https://service.cn-hangzhou-intranet.maxcompute.aliyun-inc.com/api.
Project Name
The name of the target MaxCompute project.
Log on to the MaxCompute console. In the upper-left corner, switch to the correct region. You can then find the project name on the Project Management tab.
Schema
The name of the schema to connect to.
This parameter is required if your MaxCompute project uses a three-layer model. This parameter is not required for a two-layer model.
AccessKey ID and AccessKey Secret
The AccessKey ID and AccessKey secret that have permissions to access the target MaxCompute project.
Make sure the account has the `CreateInstance` and `List` permissions for the project, and the `Desc` permission for tables. To upload files, the account must also have the `CreateTable` and `Write` permissions for the project. Log on to the Resource Access Management (RAM) console to obtain the AccessKey ID and AccessKey secret.
Quota Computing Resource Group
If you use the MaxQA query acceleration feature of MaxCompute, enter the MaxQA Quota group name. If you leave this field empty, the MaxCompute MCQA 1.0 feature is used for query acceleration by default.
Enable File Upload
If you enable this option, you can upload files.
Initialize SQL
If you enable this option, you can specify SQL statements to run for initialization after a data source connection is established.
Only `SET` statements are allowed. Use semicolons (;) to separate multiple statements.
Click Test Connection to test the connection to the data source.

After the test is successful, click OK to add the data source.
The new data source is displayed in the data source list.
NoteQuick BI caches the table list for MaxCompute data sources. When you add this type of data source for the first time, the initial data synchronization takes 10 to 15 seconds. To update the table list, click the Refresh button in the upper-right corner.
What to do next
After you add the data source, you can create datasets and analyze data.
Create a dataset based on tables from the MaxCompute data source or your custom SQL statements. For more information, see Create a dataset.
Create charts for data visualization and analysis. For more information, see Create a dashboard and Overview of visualization charts.
Drill down into data for in-depth analysis. For more information, see Step 3: Configure and display drill-down.