Managed Service for Prometheus provides a standard remote read interface, which allows open-source Prometheus to remotely read monitoring data from Managed Service for Prometheus. This topic describes how to configure open-source Prometheus to read monitoring data from Managed Service for Prometheus by using a remote read URL.
Prometheus Remote Read mode requires pulling extensive raw time-series data to a local compute engine, incurring limitations:
High operational overhead: Local Prometheus engine maintenance increases machine costs.
Network latency: Large data transfers traverse multiple devices, elevating latency.
Service constraints: Remote Read thresholds are easily exceeded at scale.
Instead, use the HTTP API query protocol of Managed Service for Prometheus, which:
Delivers performance gains of tens of times over local computation
Supports direct query via HTTP requests
Enables native Grafana connectivity.
Limitation
The remote read interface does not support HTTP/2.
Prerequisite
A Managed Service for Prometheus instance is created.
Step 1: (Optional) Grant read and write permissions on Cloud Monitor to a RAM user
If your Prometheus instance is created by using an Alibaba Cloud account and you want to use the AccessKey ID and AccessKey secret of a Resource Access Management (RAM) user to perform remote read and write operations, you must first grant read and write permissions on Cloud Monitor to the RAM user.
Log on to the RAM console as a RAM administrator or with an Alibaba Cloud account. In the left navigation pane, choose .
On the Permission page, click Grant Permission. In the panel that appears, set the parameters listed in the following table.
Parameter
Description
Resource Scope
Set this parameter based on your business requirements.
Principal
The RAM user.
Policy
You can attach one of the policies to a RAM user based on your business requirements:
AliyunCloudMonitorFullAccess: provides full permissions on Cloud Monitor. After you attach this policy to a RAM user, the RAM user has full permissions on instances managed in Cloud Monitor. For example, the RAM user can view, modify, and delete instances.AliyunCloudMonitorReadOnlyAccess: provides read permissions on Cloud Monitor. After you attach this policy to a RAM user, the RAM user has permissions to view instances managed in Cloud Monitor. The RAM user does not have permissions to modify instances, delete instances, or perform other operations.
Click Grant permissions and click Close.
Step 2: Obtain a remote read URL
Log on to the Cloud Monitor console. In the left navigation pane, choose . The Instances page appears.
In the top navigation bar, select the region where your Prometheus instance resides. On the Instances page, find the instance that you want to manage and click Settings in the Actions column.
On the Settings tab, copy the remote read URL for reading data over the Internet or internal network.

Step 3: Configure open-source Prometheus
Install open-source Prometheus. For more information, see DOWNLOAD.
Open the configuration file named Prometheus.yml, add the following content to the end of the file, replace the URL below
remote_readwith the remote read URL you obtained in Step 2, and then save the file.global: scrape_interval: 15s evaluation_interval: 15s scrape_configs: - job_name: 'prometheus' static_configs: - targets: ['localhost:9090'] remote_read: # Replace with the remote read URL that you obtained. - url: "http://ts-xxxxxxxxxxxx.hitsdb.rds.aliyuncs.com:3242/api/prom_read" read_recent: trueRestart open-source Prometheus.
Step 4: View the retrieved monitoring data in open-source Prometheus
Use a web browser to log on to open-source Prometheus.
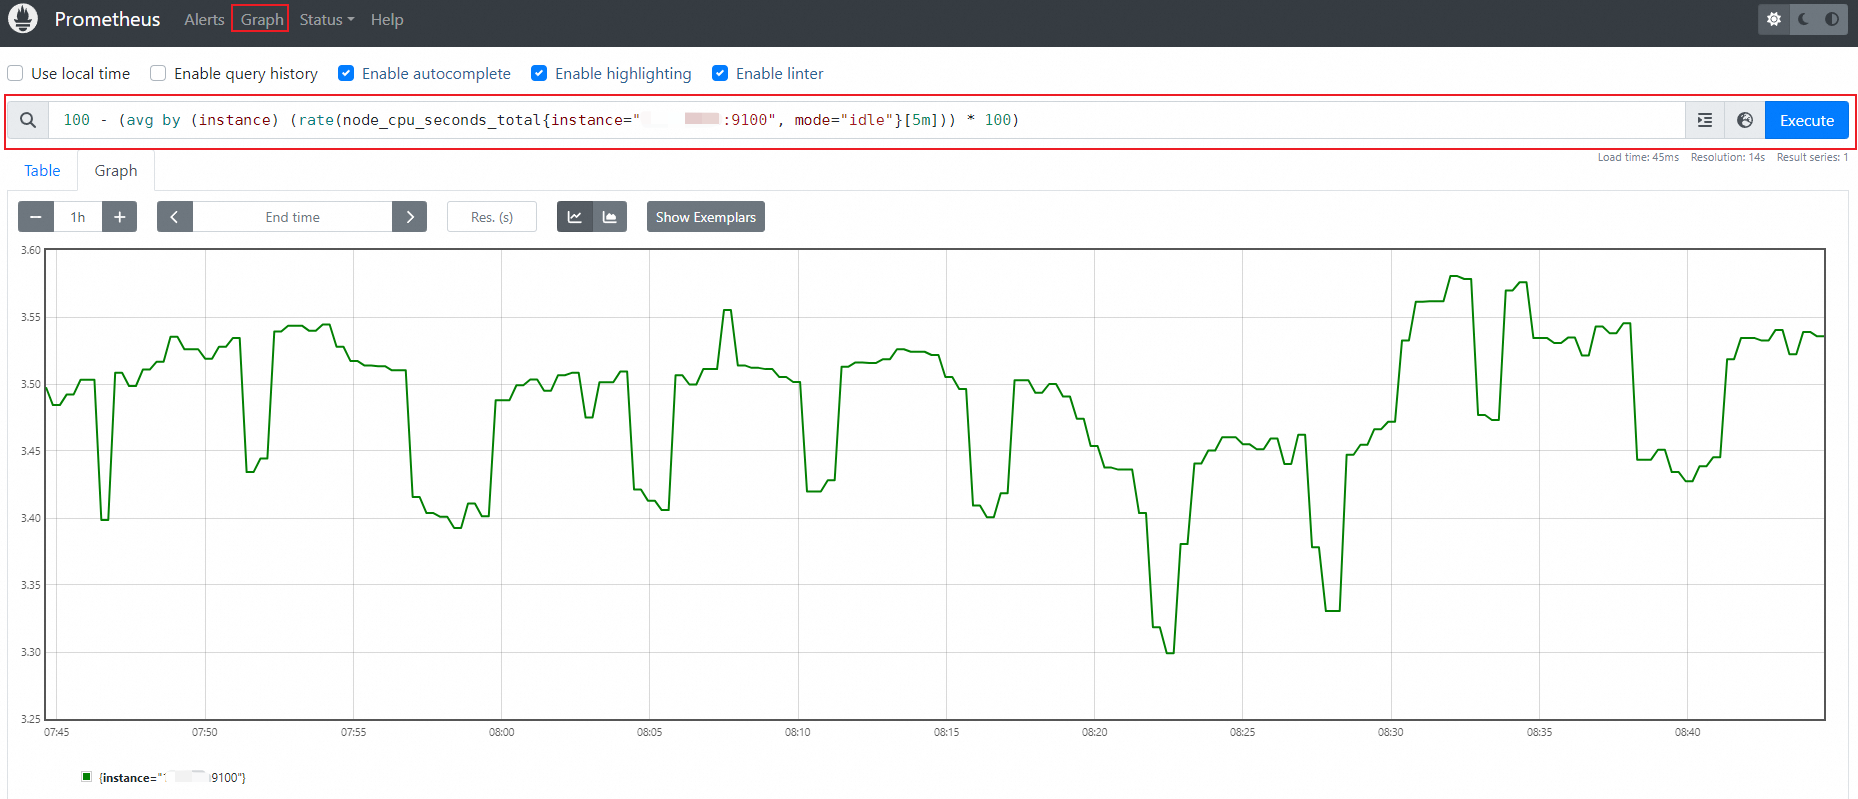
http://localhost:9090On the Prometheus page, click Graph in the top navigation bar.
On the Graph tab, enter a SQL statement into the search box and click Execute on the right side of the search box.
For example, you can enter the following SQL statement to query the CPU utilization of an instance with the specified IP address:
100 - (avg by (instance) (rate(node_cpu_seconds_total{instance="IP address:9100", mode="idle"}[5m])) * 100)