When you enable a monitoring component in Managed Service for Prometheus, a dashboard is automatically created. These out-of-the-box dashboards give you immediate visibility into your monitored environments without manual setup.
Prerequisites
Before you begin, make sure that you have:
Managed Service for Prometheus activated
At least one component enabled. For more information, see Component management
Find and open a dashboard
Log on to the Managed Service for Prometheus console
In the left-side navigation pane, click Integration Management.
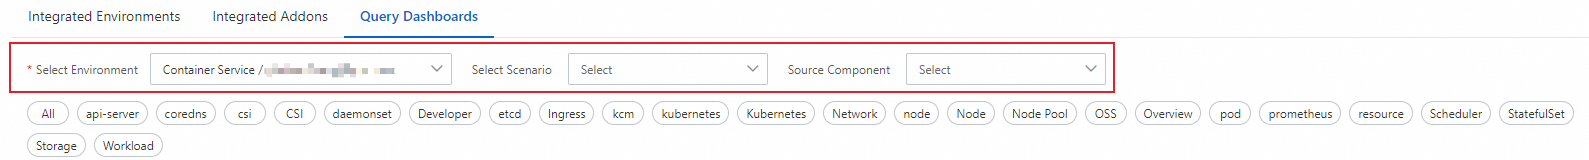
On the Integration Management page, click the Query Dashboards tab.
From the Select Environment drop-down list, select an environment type and an environment instance. To narrow your results, use the following filters:
Filter
Description
Select Environment
Filter by environment type and environment instance
Select Scenario
Filter by monitoring scenario
Source Component
Filter by the component that generated the dashboard
Click a dashboard name to open it.