You can view the amount of metric data reported by your Prometheus instance to evaluate the monitoring scope and data timeliness. You can also discard metrics that are no longer needed to avoid unnecessary costs and resource consumption.
Metrics that cannot be discarded
You cannot discard the advanced metrics from the following integrated cloud services:
Microservices Engine (MSE)
Lindorm
ApsaraMQ for Confluent
ApsaraMQ for Kafka
ApsaraMQ for RocketMQ (5.0)
Service Mesh (ASM)
PAI-EAS online model service
Intelligent Computing LINGJUN
You cannot configure or enable discarded metrics for general-purpose Prometheus instances. You can view metric details on the instance's Metric Management page.
Other metrics that cannot be discarded:
Basic metrics for container monitoring.
Metrics that are pushed directly through Pushgateway, RemoteWrite, or the OpenTelemetry (OT) protocol.
Metrics reported after the metric convergence feature is enabled. For example, this feature is available in Service Mesh (ASM) Premium Edition.
Advanced metrics from integrated cloud services (second-level metrics that do not start with Aliyun).
Prerequisites
A Prometheus instance has been created. For more information, see:
View metrics
Log on to the Cloud Monitor console. In the left navigation pane, choose . The Instances page appears.
Click the name of the target instance. In the navigation pane on the left, click Metric Management.
On the Metric Statistics page, you can set a time range in the upper-right corner to view metric statistics for the specified period.
Configure discarded metrics
If your Prometheus instance no longer needs to monitor certain metrics, you can discard them. Discarded metrics do not incur fees.
Log on to the Managed Service for Prometheus console. In the left-side navigation pane, click Integration Management.
On the Integrated Environments tab, click the name of the target environment. Then, on the Metric Scraping tab, click Discard Metrics and configure which metrics to discard.
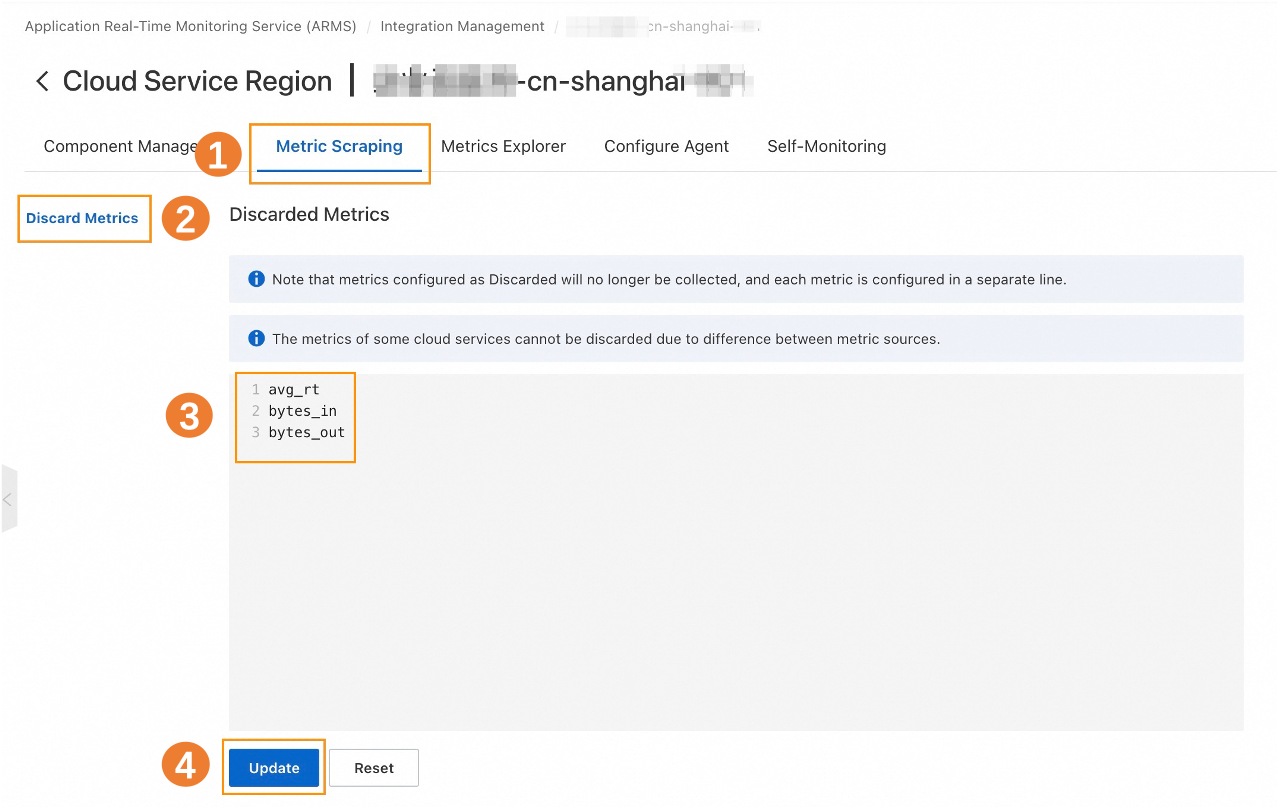 Important
Enter each metric name on a new line. Do not add commas, semicolons, colons, or spaces.
Enable discarded metrics
After you enable discarded metrics, they will start to incur fees again.
Log on to the Managed Service for Prometheus console. In the left-side navigation pane, click Integration Management.
On the Integrated Environments tab, click the name of the target environment. Then, on the Metric Scraping tab, click Discard Metrics. In the panel that appears, delete the metrics you want to enable and click Update.