This topic describes the diagnosis feature provided by PolarDB for MySQL. The diagnosis feature integrates with Database Autonomy Service (DAS) and allows you to use the session management feature to view the session statistics of an instance.
Procedure
Log on to the PolarDB console.
In the upper-left corner, select the region in which the cluster is deployed.
On the Clusters page, click the ID of the target cluster.
In the left-side navigation pane, choose .
Click the Session Management tab.

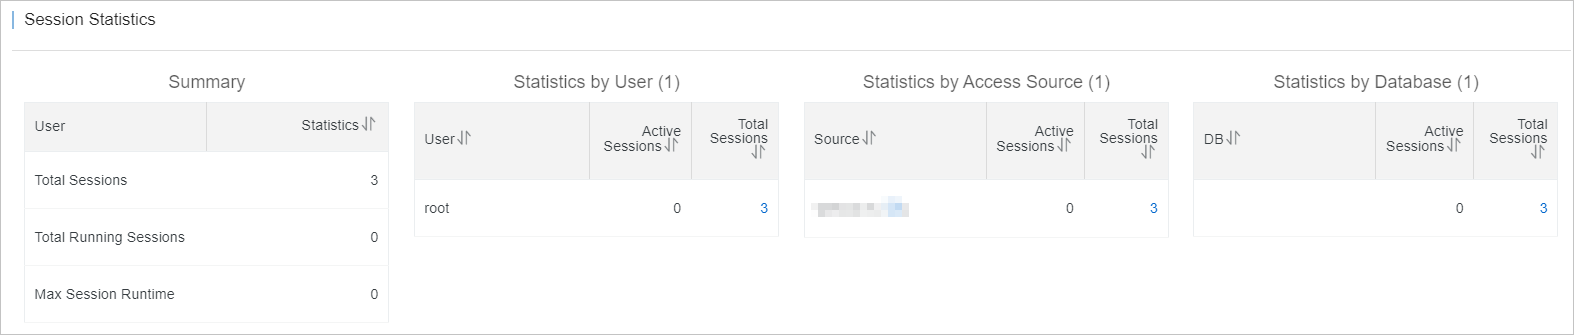
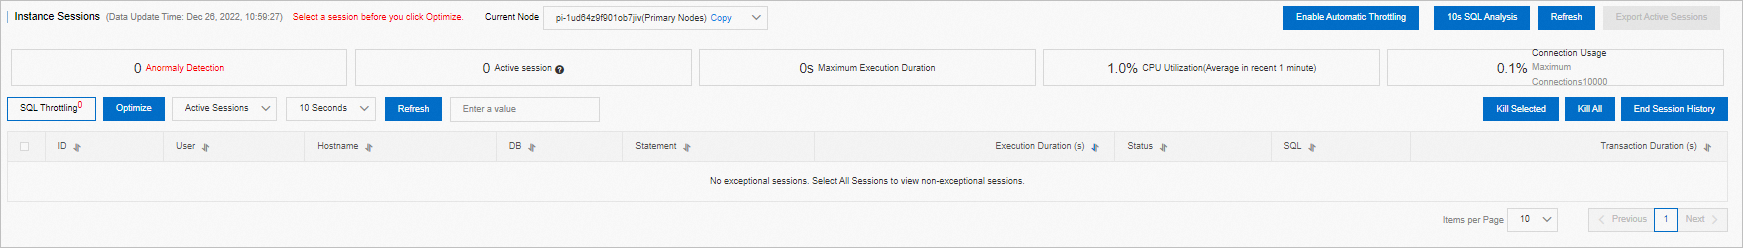
On the Session Management page, you can view the Instance Sessions and Session Statistics sections.
Instance Sessions: provides information about exceptional sessions, active sessions, and CPU usage.
 Note
NoteIn the upper-right corner of the Diagnosis page, you can click 10s SQL Analysis to view the most frequently executed SQL statements and slow queries within 10 seconds. For more information, see 10-Second SQL Analysis.
You can click SQL Throttling to control the number of database requests and the number of SQL concurrent requests to ensure the availability of services. For more information, see SQL Throttling .
You can click Optimize to diagnose and optimize SQL statements. For more information, see SQL optimization.
Session Statistics: provides the total number of sessions, session runtime, and other session statistics collected based on different metrics. For example, the system calculates the number of sessions initiated by different users.