Build a linear regression model to predict loan repayment ability using historical data on income, land area, and crop types.
Build a linear regression model using historical loan data (annual income, crop types, land area) to predict whether applicants can repay requested loan amounts.
Dataset is fictitious for learning purposes.
Prerequisites
A workspace is created. For more information, see Create and manage a workspace.
MaxCompute resources are associated with the workspace. For more information, see Create and manage a workspace.
Dataset fields
Field | Type | Description |
id | STRING | Unique identifier for each entry. |
name | STRING | Applicant name. |
region | STRING | Geographic region ordered from north to south. |
farmsize | DOUBLE | Farmland area (acres). |
rainfall | DOUBLE | Annual rainfall (millimeters). |
landquality | DOUBLE | Soil quality score. Higher values indicate better quality. |
farmincome | DOUBLE | Annual farming income. |
maincrop | STRING | Main crop type cultivated. |
claimtype | STRING | Type of loan applied for. |
claimvalue | DOUBLE | Requested loan amount. |
Build and run workflow
-
Go to the Machine Learning Designer page.
-
Log on to the PAI console.
-
In the left-side navigation pane, click Workspaces. On the Workspaces page, click the name of the workspace that you want to manage.
-
In the left-side navigation pane, choose .
-
Build workflow.
On the Designer page, click Preset Templates.
In Regression Algorithm Implementation for Agricultural Loan Prediction, click Create.
In Create Workflow, configure parameters or keep defaults.
Workflow Data Storage specifies OSS bucket path for temporary data and models.
-
Click OK.
The workflow is created in about 10 seconds.
In the workflow list, select Regression Algorithm for Agricultural Loan Prediction and click Enter Workflow.
Designer automatically builds the workflow.
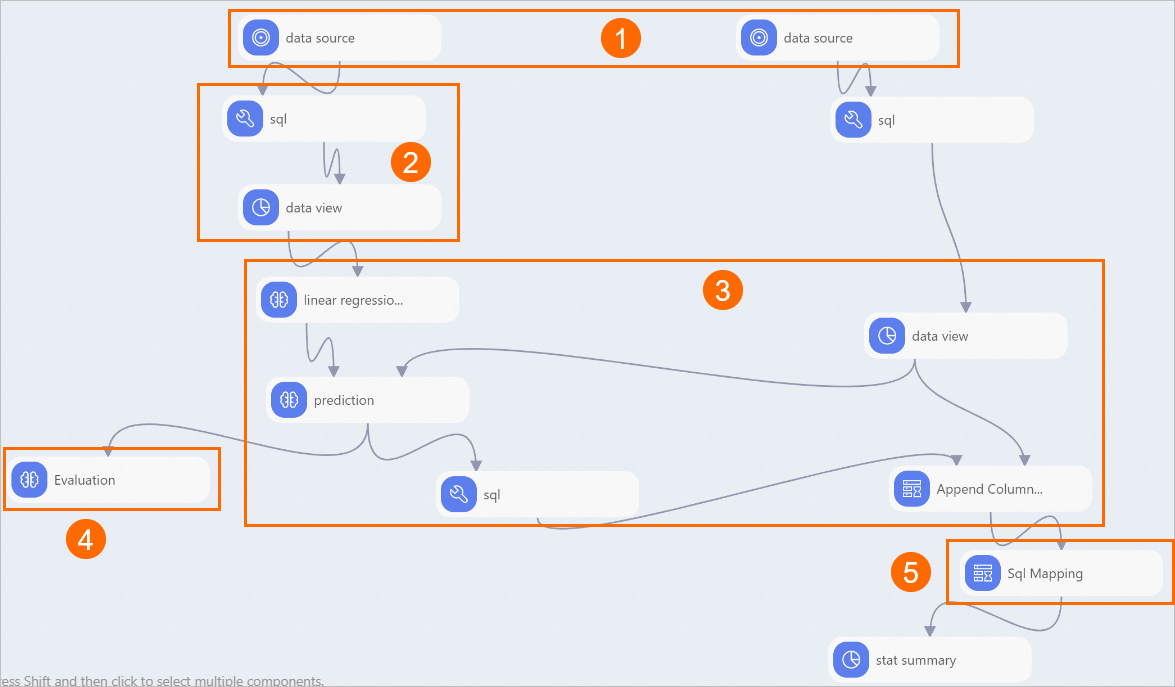
Area
Description
①
Reads workflow datasets:
Training: 100 historical loan records with features like farmsize and rainfall to train the model. claimvalue contains the loan amount recovered.
Test: 71 current loan applicants. claimvalue contains the requested loan amount.
Uses historical data to predict which applicants will receive loan approval.
②
Maps string values to numbers. For region, maps north, middle, and south to 0, 1, and 2, then converts to DOUBLE.
③
Linear Regression trains and generates a model using historical data. Prediction uses this model to predict loan issuance. Merge Columns combines user ID, predicted value, and requested loan amount.
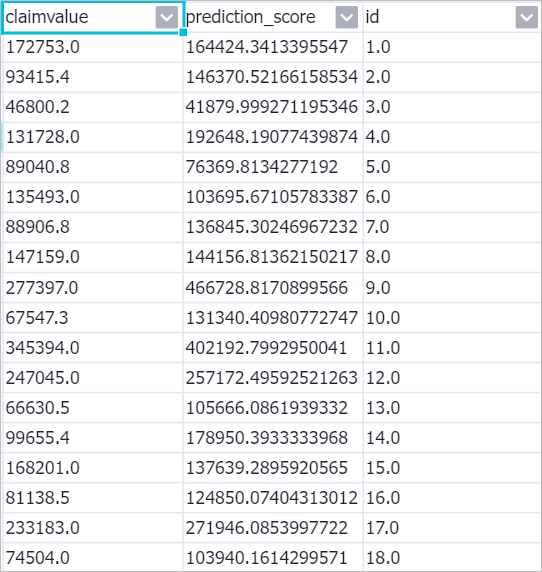 prediction_score contains the predicted repayment amount.
④
Regression Model Evaluation evaluates model performance. See Evaluation metrics for details.
⑤
Filtering And Mapping identifies eligible applicants whose predicted repayment amount exceeds the requested loan amount.
Table 1. Evaluation metrics
Field
Description
MAE
Mean absolute error.
MAPE
Mean absolute percentage error.
MSE
Mean squared error.
R
Multiple correlation coefficient.
R2
Determination coefficient.
RMSE
Root mean squared error.
SAE
Sum of absolute errors.
SSE
Sum of squares for error.
SSR
Sum of squares due to regression.
SST
Total sum of squares.
count
Number of rows.
predictionMean
Mean of predictions.
yMean
Mean of original dependent variables.
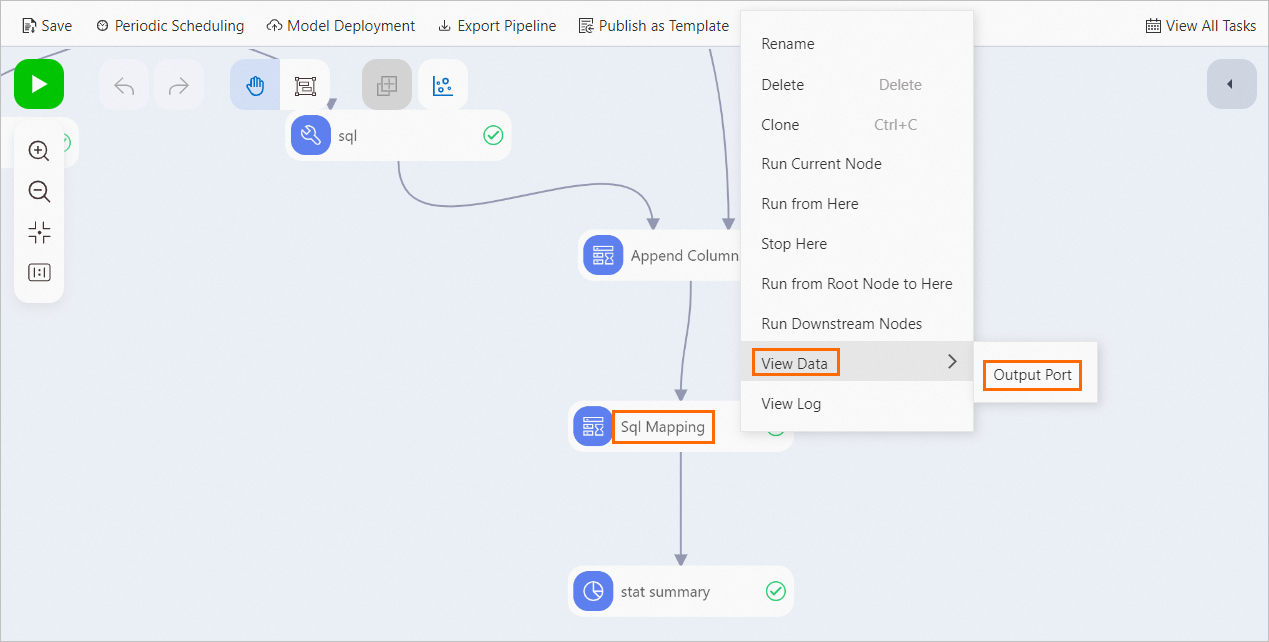
Run workflow and view results.
Click
 above the canvas.
After completion, right-click Filtering and Mapping and choose to view eligible applicants.
Related information
For more information about algorithm components: