This topic describes how to implement click-through rate (CTR) prediction based on an Avazu dataset and deploy the workflow in which the Min Max Scaler Batch Predict, OneHot Encoder Predict, Vector Assembler, and FM Prediction components are batch run in sequence to Elastic Algorithm Service (EAS) as online services. You can follow the data processing and feature engineering logic used in the batch training mode when you implement model prediction in real time. This ensures that the batch mode uses the same process as the real time mode.
Prerequisites
A workspace is created. For more information, see Create and manage a workspace.
MaxCompute resources are associated with the workspace. For more information, see Manage workspaces.
Datasets
Avazu is a classic dataset that is used to predict CTR. In this example, an Avazu subset that contains 200,000 data entries (160,000 training entries and 40,000 prediction entries) is used to build a pipeline to predict CTR. For more information, see Click-Through Rate Prediction. The following table describes the fields used in the dataset.
Column | Type | Description |
id | STRING | The ad ID. |
click | DOUBLE | Specifies whether the ad is clicked. |
dt_year | INT | The year when the ad is clicked. |
dt_month | INT | The month when the ad is clicked. |
dt_day | INT | The day when the ad is clicked. |
dt_hour | INT | The hour when the ad is clicked. |
c1 | STRING | The anonymized categorical variable. |
banner_pos | INT | The location where the banner is located. |
site_id | STRING | The site ID. |
site_domain | STRING | The domain of the site. |
site_category | STRING | The category of the site. |
app_id | STRING | The application ID. |
app_domain | STRING | The domain of the application. |
app_category | STRING | The category of the application. |
device_id | STRING | The device ID. |
device_ip | STRING | The IP Address of the device. |
device_model | STRING | The model of the device. |
device_type | STRING | The type of the device. |
device_conn_type | STRING | The connection type of the device. |
c14 - c21 | DOUBLE | More anonymized categorical variables, which reside in 8 columns. |
Procedure
Go to the Machine Learning Designer page.
Log on to the PAI console.
In the left-side navigation pane, click Workspaces. On the Workspaces page, click the name of the workspace that you want to manage.
In the left-side navigation pane, choose .
Create a pipeline.
On the Visualized Modeling (Designer) page, click the Preset Templates tab.
Click Create in the Click-Through Rate Prediction section
In the Create Pipeline dialog box, configure the parameters. You can use their default values.
The value specified for the Data Storage parameter is the Object Storage Service (OSS) bucket path of the temporary data and models generated during the runtime of the pipeline.
Click OK.
It requires about 10 seconds to create the pipeline.
On the Pipelines tab, double-click the created Click-Through Rate Prediction pipeline to open it.
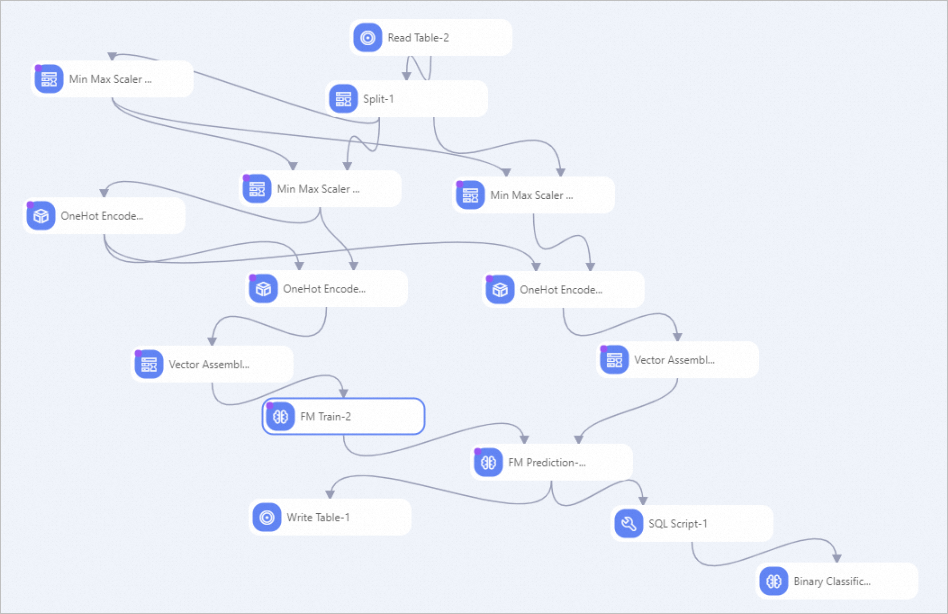
A pipeline is created based on the template as shown in the following figure.

This pipeline divides features into numeric and discrete features for processing.
Numeric features: The pipeline normalizes numeric features.
Discrete features: The pipeline one-hot encodes discrete features. Then, this pipeline combines the two types of features in a vector column, chooses the FM algorithm to train a model based on the vector column, and uses the model to implement inference.
Run the pipeline and view the results.
In the upper-left corner of the canvas, click
 .
. After the pipeline is run, right-click the Binary Classification Evaluation-1 component. In the shortcut menu that appears, click Visual Analysis, or click the
 icon on the canvas.
 In the dialog box that appears, click the Index Data tab to view the prediction accuracy.

If the prediction accuracy meets your requirements, package the workflow that combines data preprocessing, feature engineering, and model prediction and deploy the package to EAS as a service.
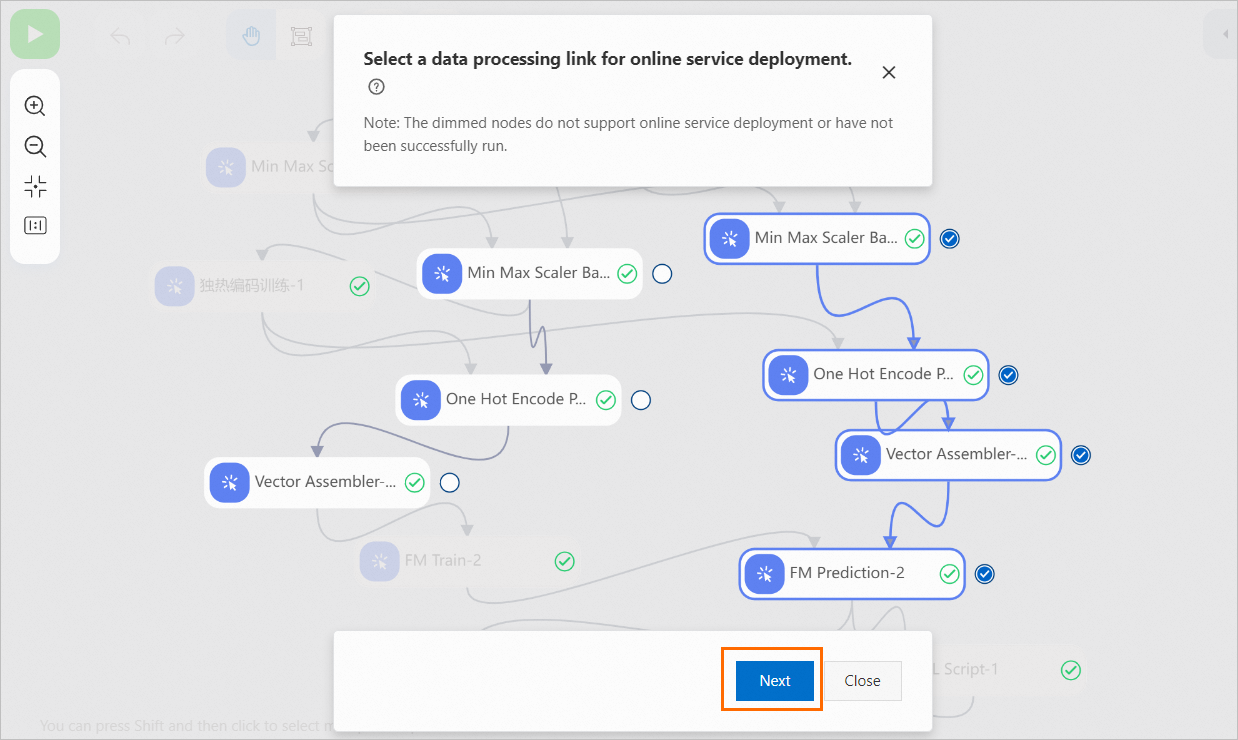
In the upper part of the canvas, click Create Pipeline Model.
Select the Min Max Scaler Batch Predict-2 component and click Next. If you select the Min Max Scaler Batch Predict-2 component, all the downstream nodes are automatically selected. The selected data processing link that you want to deploy and the related models are packaged as a pipeline model.

In the Pipeline Deployment dialog box, confirm the package information and click Next to start the packaging task.
 It takes about 3 to 5 minutes to complete packaging.
 Deploy the model service.
Method 1: In the Pipeline Deployment dialog box, click Deploy to EAS when the Status is Successful. After you configure the Service Name and Resource Deployment Information parameters, click Deploy to deploy the model. For more information, see Deploy a pipeline as an online service.
Method 2: If the Pipeline Deployment dialog box is closed, click View All Tasks in the upper-right corner of the canvas. In the Previous Tasks dialog box, view the status of the task. If the Status is Success, you can perform the following operations:
You can choose Model > Deploy in the Actions column and follow the on-screen instructions to deploy the model service.
You can also click Models in the upper part of the canvas. In the model list, find the packaged model, click Deploy to EAS, and follow the on-screen instructions to deploy the model service.
In the EAS console, find the deployed service and click Online Debugging in the Actions column to debug the service online. For more information, see Debug a service online.
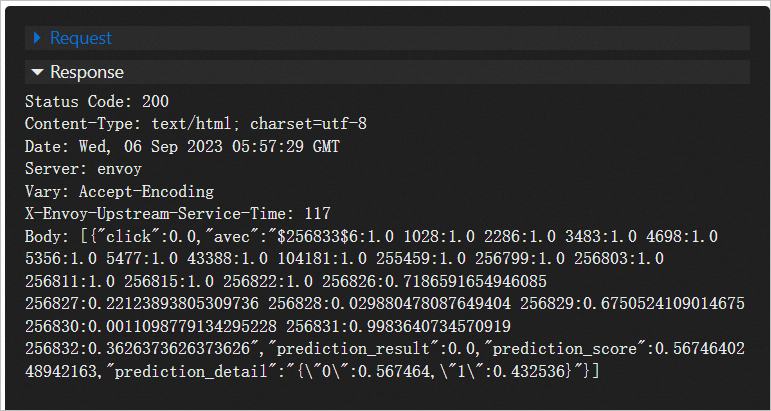
You can enter test data that has the same format as the dataset data in the Body field. Example:
[{"id":"10000169349117863715","click":0.0,"dt_year":14,"dt_month":10,"dt_day":21,"dt_hour":0,"C1":"1005","banner_pos":0,"site_id":"1fbe01fe","site_domain":"f3845767","site_category":"28905ebd","app_id":"ecad2386","app_domain":"7801e8d9","app_category":"07d7df22","device_id":"a99f214a","device_ip":"96809ac8","device_model":"711ee120","device_type":"1","device_conn_type":"0","c14":15704.0,"c15":320.0,"c16":50.0,"c17":1722.0,"c18":0,"c19":35.0,"c20":100084.0,"c21":79.0}]The test data is processed by the Min Max Scaler Batch Predict, OneHot Encoder Predict, Vector Assembler, and FM Prediction components in sequence. The following figure shows the prediction results.
