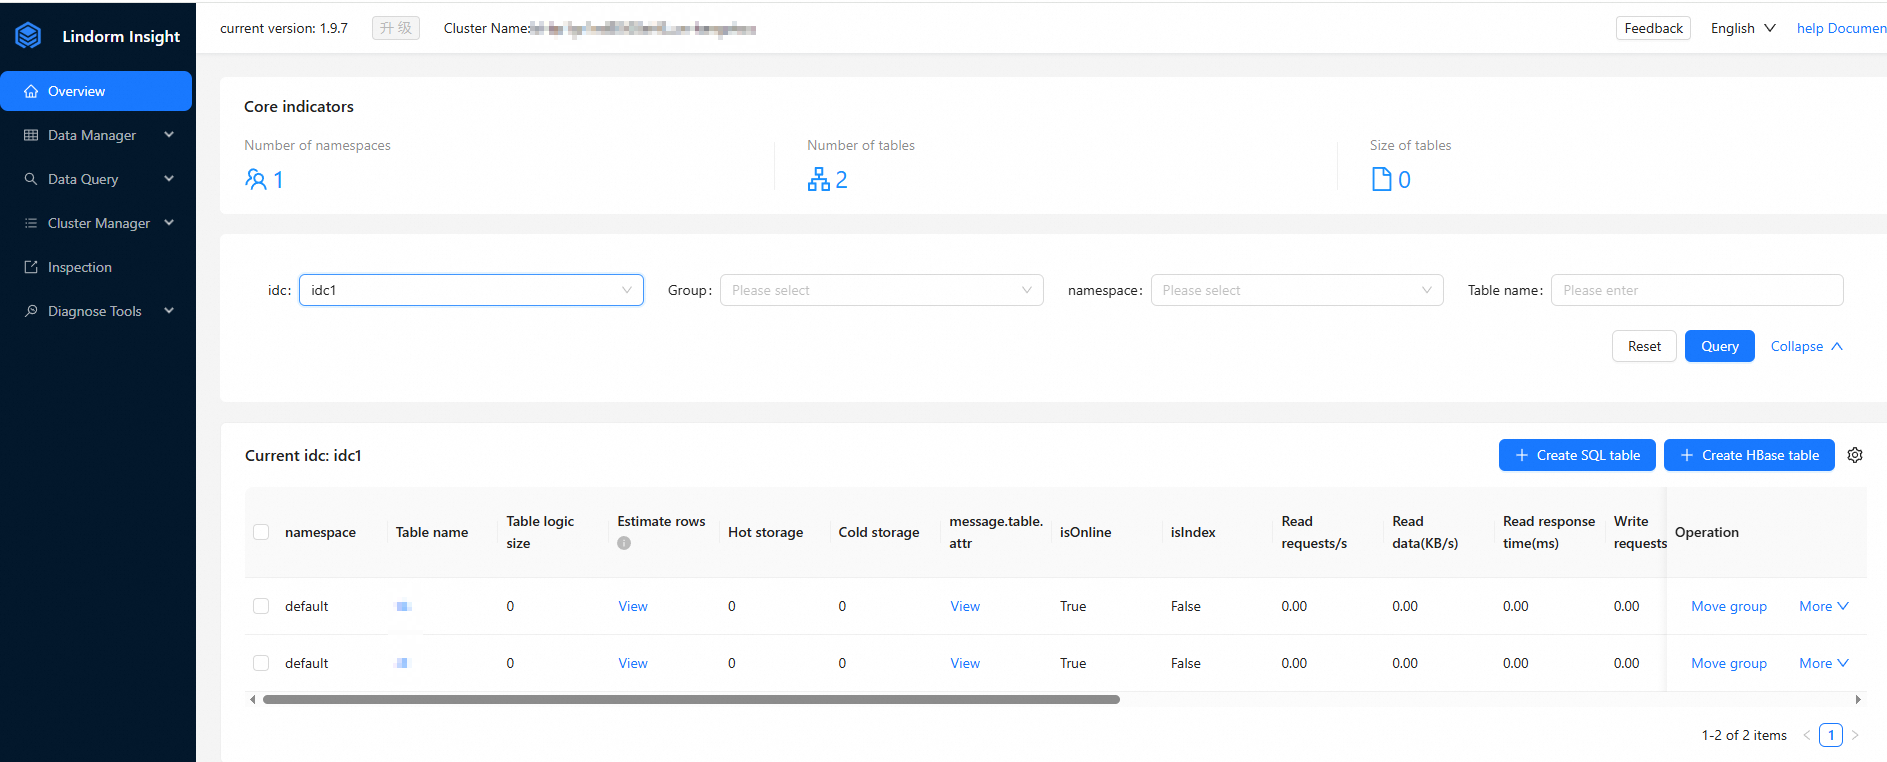
The cluster management system lets you view cluster storage usage and manage cluster data. This topic describes how to log on to the cluster management system from the Lindorm console.
Prerequisites
A Lindorm instance has been created.
The public IP address used to access the cluster management system must be added to the Lindorm whitelist.
Procedure
Log on to the Lindorm Management Console.
On the Instances page, click the target instance ID.
In the navigation pane on the left, click Database Connections.
On the Wide Table Engine page, in the Lindorm Insight section, click By By ClusterManager Internet Visit or By By ClusterManager VPC Visit to log on to the cluster management system.

On the Log On page, enter your username and password.
ImportantIf you are logging in to the cluster management system for the first time, click Reset UI Access Password on the Wide Table Engine page in the Lindorm Insight section to set your password. The password must meet the following requirements:
It must be 2 to 30 characters in length.
It must contain one or more of the following character types: uppercase letters, lowercase letters, special characters, and digits.
The supported special characters are underscores (_) and hyphens (-).
Click Log On to open the Lindorm Insight page.

Introduction to the cluster management system
The cluster management system includes an information panel, data management, and data query. For more information, see the following table.
Main page | Subpage | Description | References |
Overview | N/A |
| |
Data Management | Namespace management |
| |
User management |
| ||
Table change management | Change the properties of tables. | ||
Data Query | SQL executor | Use SQL statements to query data in Lindorm wide tables. | |
Cluster Management | Group and node management |
| |
Diagnostics | Large query request detection | Detect large query operations such as large scans. | |
topRegion analysis | Sort and display regions based on different metrics and dimensions. | ||
Client source tracing | View information about clients that access the cluster. |
FAQ
Why do I receive the error Your current password is weak even if my password meets the requirements?
This error indicates that you are using a weak password, such as a simple combination of numbers or adjacent keys on the keyboard. Such passwords are easy to crack and pose a high security risk. Please use a strong password and submit it again.