Query Insight combines Slow Query logs with the `hg_table_info` system table for table statistics. It provides execution information for your queries, such as resource consumption, metadata of the involved tables, and the execution plan. Query Insight also helps you quickly determine whether a query has DDL conflicts or table locks, assisting you with troubleshooting and issue resolution.
Prerequisites
Instances are logged in. For more information, see Log on to an instance.
Access Query Insight
You can access Query Insight directly from the Diagnostics and Optimization page in HoloWeb. Alternatively, you can navigate to Query Insight from the SQL Editor or the Historical Slow Queries page in HoloWeb.
-
Log on to the Hologres Management Console.
-
In the navigation pane on the left of the top menu bar, select the desired region.
-
You can click Go to HoloWeb to go to the HoloWeb development page.
-
Access the Query Insight page.
Access Query Insight Directly
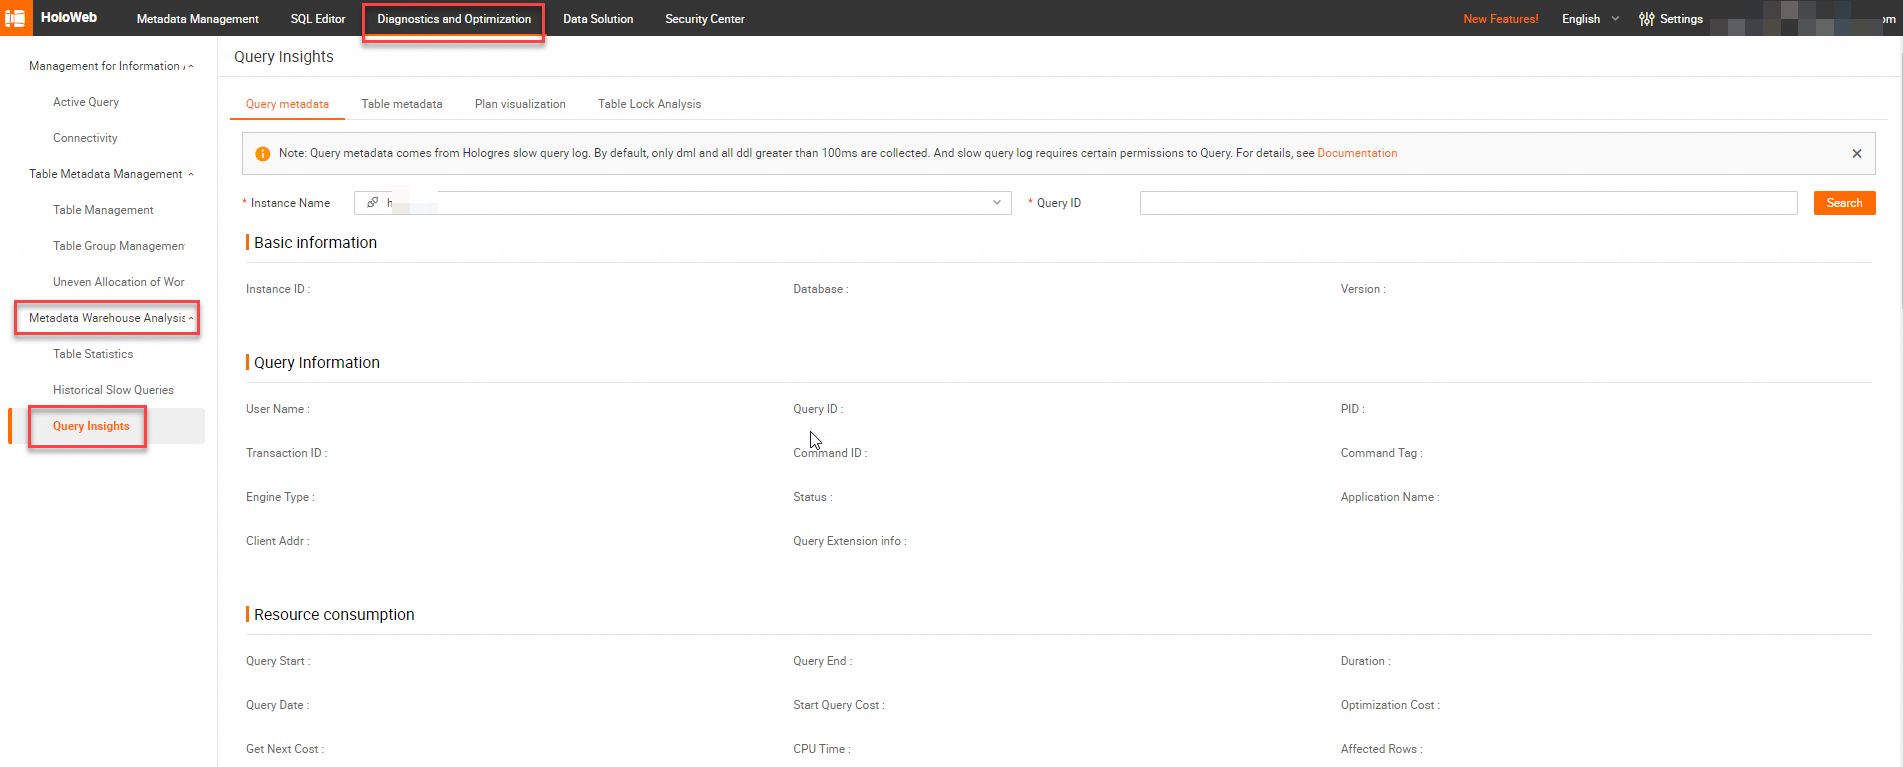
In the top menu, select Diagnostics and Optimization. Then, in the navigation pane on the left, click Metadata Warehouse Analysis > Query Insight to go to the Query Insight page.
Navigate to Query Insight
In HoloWeb, you can navigate to Query Insight from the SQL Editor or the Historical Slow Queries page. To navigate, follow these steps:
-
SQL editor: In the HoloWeb SQL editor, you can navigate to Query Insight from any SQL statement that has a running time greater than 1s and contains a Query ID.
-
Historical Slow Queries: In the query list, click the Actions column
 icon for the target SQL query to navigate to Query Insight.
On the Query Insight page, you can view Query Metadata and Table Metadata, and perform Plan Visualization and Table Lock Analysis.
-
Query Metadata
Query metadata is sourced from Hologres slow query logs. By default, the system collects only DML statements with a running time greater than 100 ms and all DDL statements. However, when you query this data, only DDL statements with a running time greater than 1 second appear in the results. You must have specific permissions to query slow query logs. For more information, see Slow Query Log Viewing and Analysis. Select the Query Metadata tab, then select the Instance Name and Query ID, and click Search to display the query metadata.
-
Basic Information
Displays the instance ID, DB, and Milvus version for the query.
-
Query Information
Displays basic query information collected from slow query logs, such as the user, execution status, and the execution engine used.
-
Resource Consumption
Displays the resource consumption during query execution, collected from slow query logs. This includes information such as scan functions and CPU consumption.
-
Other Information
Displays additional extension information for the query, collected from slow query logs, such as the client IP address.
-
SQL
Displays the content of the current SQL query. You can format the query for a more intuitive display or copy the query.
-
Query Details
If the query runs with parameters, this section displays the specific parameter values. You can merge the parameters into the SQL statement if needed.
-
Execution Plan
Displays the execution plan of the query, which is from the Plan field in the slow query logs. Note that the system collects execution plans only for queries with a running time greater than 10s. You can use the visualization feature to view a graphical representation of the execution plan for further query optimization. For more information about execution plans, see EXPLAIN and EXPLAIN ANALYZE.
-
Statistics
Displays running information for the current query, collected from the Statistics field in the slow query logs. This section shows detailed consumption information for each operator, such as the number of scanned rows and the operator running time. You can analyze operator consumption using these statistics to further optimize the query.
-
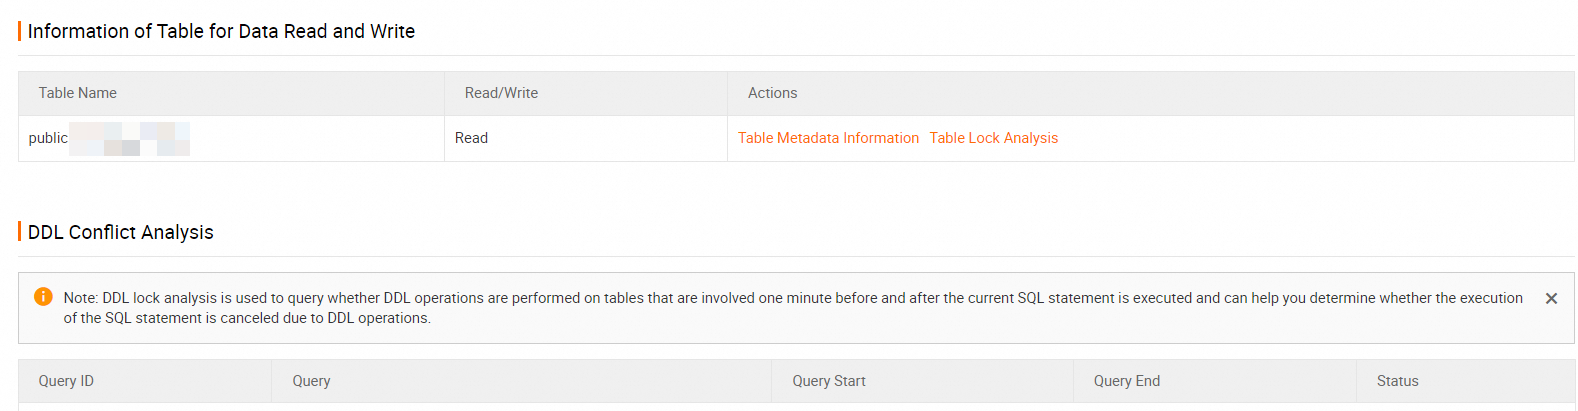
Read/Write Table Information
Displays the tables that are read from or written to by the current query. You can click the following links:
-
Table Metadata: Navigates to the Table Metadata page where you can view the metadata for the current table. Note that table metadata is collected from the `hg_table_info` table and the data is updated on the next day (T+1). Therefore, if a table was created today, you cannot query its metadata until tomorrow.
-
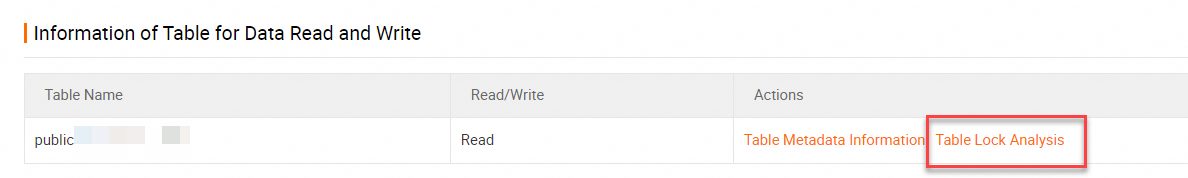
Table Lock Analysis: Navigates to the Table Lock Analysis page where you can check if the current query has locks. This analysis detects only DML-related locks. For example, if an SQL query with a fixed plan slows down, you can use Table Lock Analysis to check whether the table has concurrent DML operations from the Hologres execution engine (HQE), which can increase the query running time.
-
-
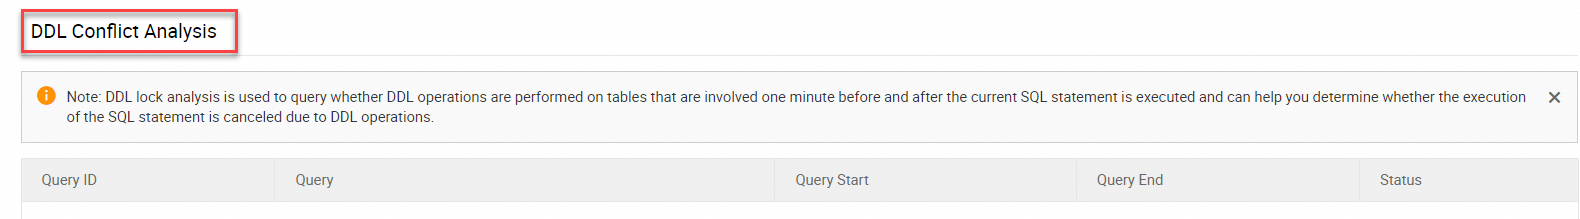
DDL Conflict Analysis
Displays whether the tables involved in the current query had DDL operations within one minute before or after the query's execution. This helps you determine if DDL conflicts caused the query to fail with the error message
Query is canceled. -
Error Messages
If a query fails, the error details are displayed. In addition, the intelligent SQL diagnosis feature in Query Insight on HoloWeb automatically adds new failure causes and solutions to the Error Message section to help you resolve SQL errors more easily. For more information about common SQL statement failures and solutions, see FAQ for Hologres SQL statements.
Table Metadata
Table metadata is sourced from the Hologres system table `hg_table_info`, which contains table statistics. The system collects and reports this data once every morning. The data is updated on a T+1 basis. Therefore, you can query the table metadata for the current day on the next day.
You can navigate to the Table Metadata page from the table information in Query Metadata to view the corresponding table metadata. You can also manually enter table information, such as the instance name, database, and schema, and the metadata collection time to view the table metadata.
-
Basic Information
Includes the table name and indicates whether the table is partitioned. It also provides partition-related information.
-
Table Metadata Information
Includes the table creation time, metadata collection time, and storage capacity.
-
Table Property Information
Displays the indexes that are set for the current table, such as the primary key (PK) and distribution key.
-
Table Schema Information
Displays the table schema, including fields, field types, nullability, and default values.
Plan Visualization
The plan visualization feature displays the `plan` field from the slow query logs. Note that plan information is collected only for queries that run for more than 10s. For more information about the execution plan, see EXPLAIN and EXPLAIN ANALYZE.
Table Lock Analysis
Table Lock Analysis checks whether the current SQL statement generates DML (INSERT, UPDATE, or DELETE) operations in the Hologres execution engine (HQE). This helps you diagnose slow execution issues for SDK SQL statements that are caused by locks. A lock is indicated if a table has both SDK or HQE queries and HQE DML queries running concurrently. You should avoid running both types of operations at the same time.
Troubleshoot Common Issues Using Query Insight
-
Error: relation with OID xxx does not exist
Troubleshooting method: This error usually occurs because a table involved in the query was subject to a TRUNCATE or DROP operation, which changed the table's OID. You can use Query Insight to view the Query ID that reported the error and confirm whether DDL locks existed at the same time.
-
Error: query is canceled
Troubleshooting: The error occurs because tables involved in the query underwent DDL operations, such as TRUNCATE or DROP, while the query was executing. You can enter the Query ID of the failed query into Query Insight. In the Query Metadata tab, in the DDL Conflict Analysis area, you can view the DDL operations on the table.
-
High Latency for SDK SQL Statements
If SDK SQL statements experience high latency, use Query Insight to check for lock contention. For example, if a statement takes 18 seconds to execute, click Lock Analysis in the Information of Table for Data Read and Write area.
 A DML statement from HQE is executed at the same time. DML statements executed using HQE acquire table locks. As a result, SDK SQL statements in the query wait for the locks to be released, which increases execution duration. If no DML statements from HQE are found, it indicates that no table lock is acquired. In this case, see Optimize write and update performance to further investigate the cause.