After Global Accelerator (GA) is deployed, you can use the network detection tool provided by Cloud Monitor (CMS) or perform manual testing to test the acceleration performance. The network detection tool is suitable for large-scale testing and multi-region testing. Manual testing is suitable for temporary testing or in-depth analysis of specific issues in an acceleration region.
Prerequisites
A GA instance is deployed. For more information, see Create and manage standard GA instances.
The listener port is added to the whitelist, such as the security group, of the endpoint server. For information about how to add a security group rule, see Add a security group rule.
Use the network detection tool to test the acceleration performance
The network detection tool allows you to perform testing from the detection points of Internet service provider (ISP) networks in different regions.
Domain name access test
If you create a GA instance to accelerate connections to backend servers that have specific domain names, you can compare the access speed before and after traffic is accelerated by GA. In this example, an HTTP detection is initiated.
Click Synthetic Tests to go to the Synthetic Tests page.
Enter the domain name of the backend server that you want to detect and click Test Now.
By default, an HTTP detection is performed. If you want to perform an HTTPS detection, enter a complete URL, such as
https://example.com.In the Probe Check Result section, click
 on the right of the Detection Point City column, enter the name of the acceleration region, and then click Confirm.
 View the detection results.
NoteThe acceleration performance varies based on the actual workload.
In the following example, a client in China (Hong Kong) and a backend server in US (Silicon Valley) are used.
Figure 1. Before GA is used
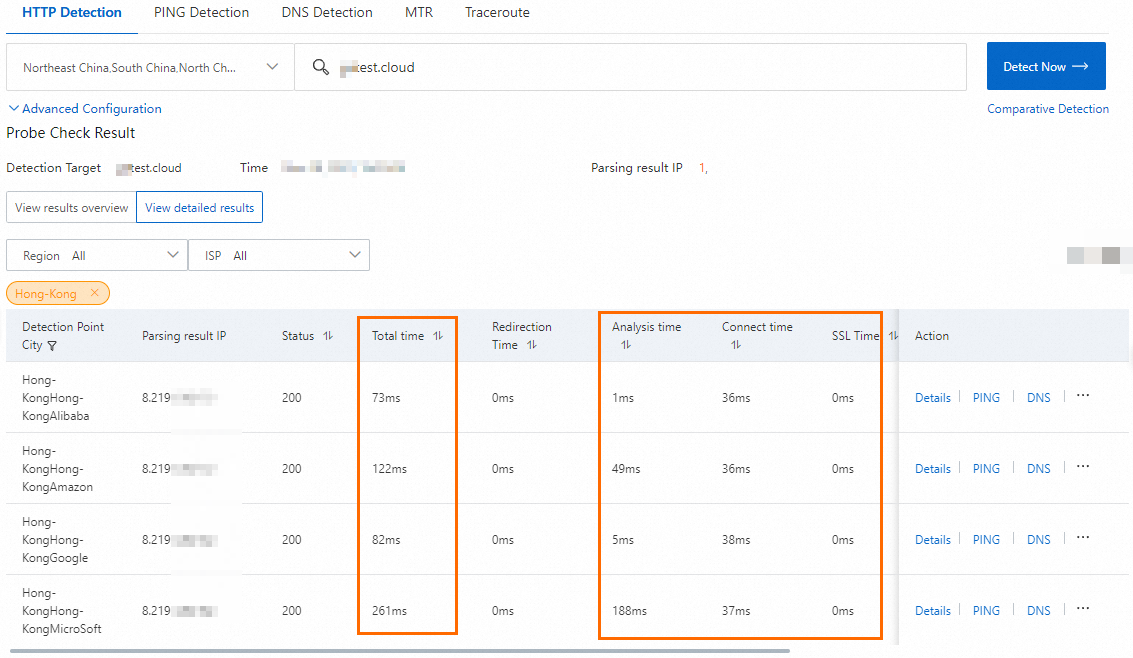
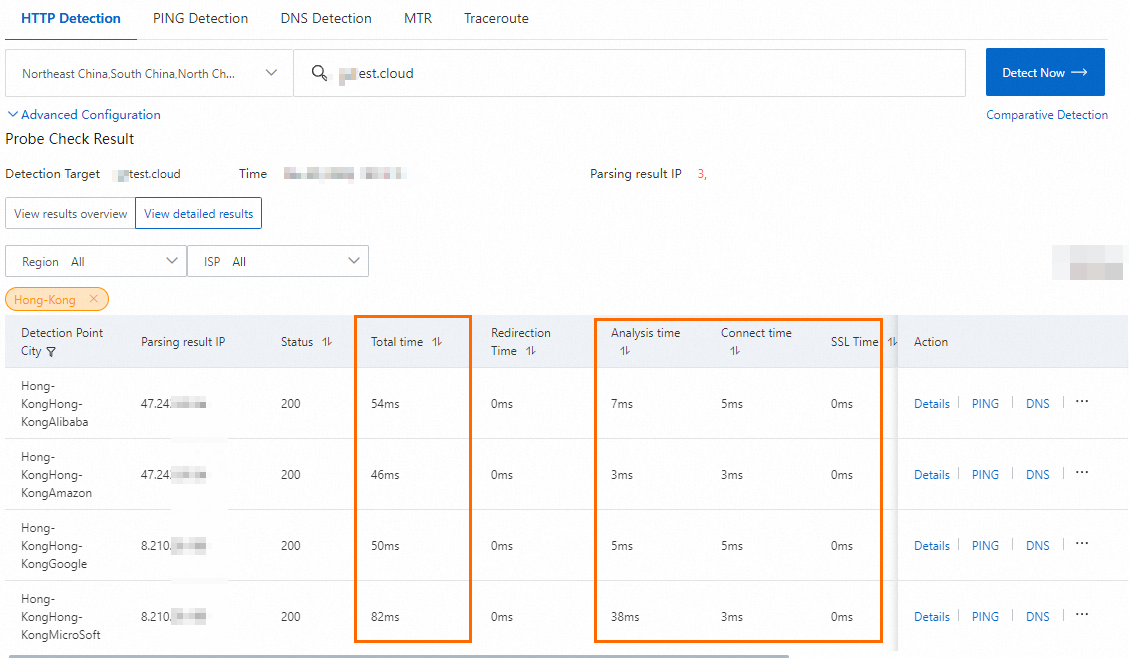
Figure 2. After GA is used
IP address access test
If you create a GA instance to accelerate connections to backend servers that have specific IP addresses, you can initiate instant detection for the accelerated IP address and the IP address of a backend server to compare the access speed before and after traffic is accelerated by GA. In this example, an HTTP detection is initiated.
Click Synthetic Tests to go to the Synthetic Tests page.
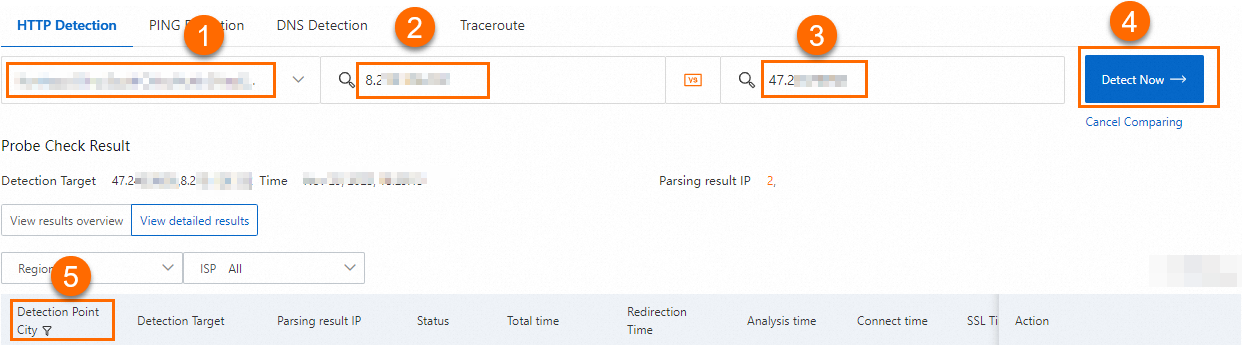
Click Comparative Test below the Test Now button.
Perform the following steps to configure the parameters:
No.
Description
1
Select ISPs and regions from the drop-down list.
In this example, all values are selected.
2
Enter the IP address of the backend server.
3
Enter the accelerated IP address.
4
Click Test Now.
5
In the Probe Check Result section, click
on the right of the Detection Point City column, enter the name of the acceleration region, and then click Confirm. View the detection results.
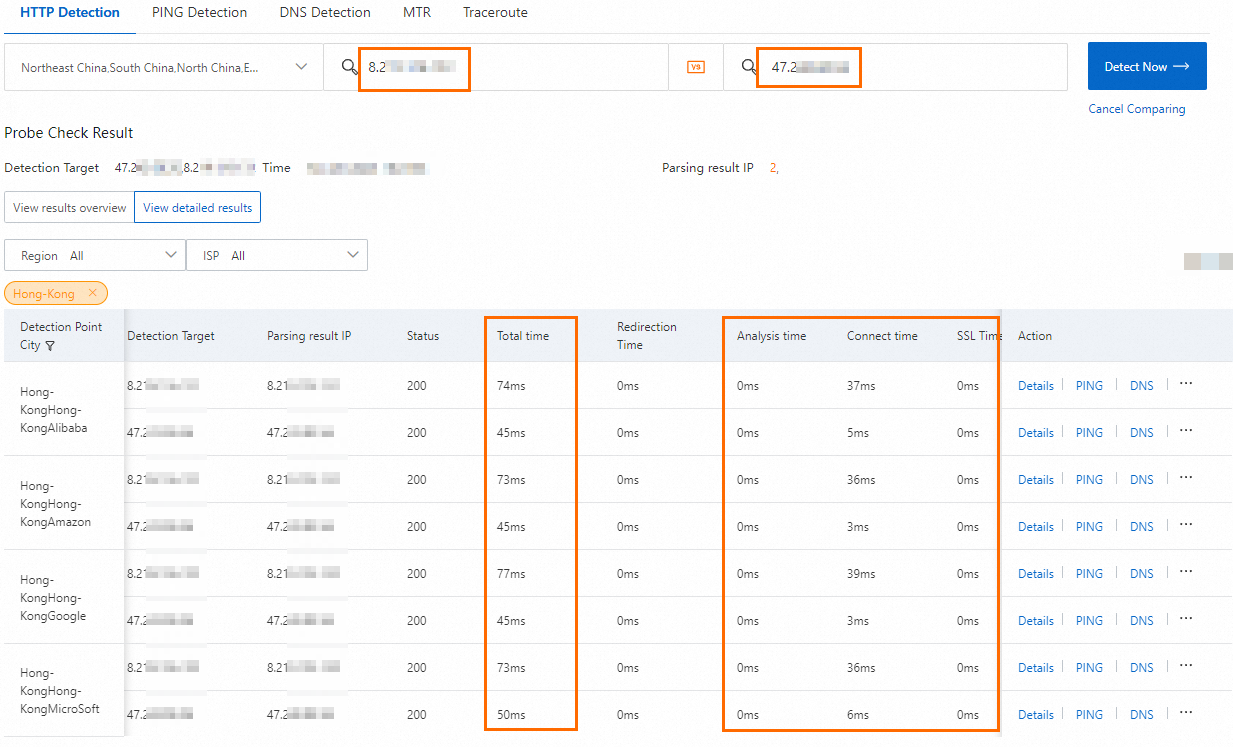
NoteThe acceleration performance varies based on the actual workload.
In the following example, a client in China (Hong Kong) and a backend server in US (Silicon Valley) are used.
Perform manual tests
After GA is deployed, you cannot use ICMP Ping or TCPing to test the acceleration performance. However, you can run the curl command to test the acceleration performance of TCP, HTTP, and HTTPS listeners, and use UDPing to test the acceleration performance of UDP listeners.
GA supports the proxy response mechanism. ICMP Ping and TCPing requests are responded to and closed in the acceleration region and are not passed to the backend servers. ICMP Ping and TCPing can be used to test the network connectivity between the client and the acceleration region, but cannot be used to test the latency.
Perform testing of TCP, HTTP, and HTTPS listeners
Open the CLI on a client in the acceleration region.
Run the following command before and after you use GA to check the network latency between the client and the backend server:
curl -o /dev/null -s -w "time_connect: %{time_connect}\ntime_starttransfer: %{time_starttransfer}\ntime_total: %{time_total}\n" "http[s]://<domain name or IP address>[:<port>]"Take note of the following parameters:
time_connect: The period of time that is required to establish a TCP connection. Unit: seconds.
time_starttransfer: The start time of data transfer. The start time refers to the amount of time from when the client sends a request to the backend server to when the first byte is sent to the client. Unit: seconds.
time_total: The total connection time. The total connection time refers to the period of time from the time when the client sends a request to the time when the client receives the last byte from the backend server. Unit: seconds.
Use a domain name
NoteThe acceleration performance varies based on the actual workload.
In the following example, a client in China (Shenzhen) and a backend server in US (Silicon Valley) are used.
Figure 1. Latency before acceleration (access to a domain name)

Figure 2. Latency after acceleration (access to a domain name)

Use an IP address
NoteThe acceleration performance varies based on the actual workload.
In the following example, a client in China (Hong Kong) and a backend server in US (Silicon Valley) are used.
Figure 1. Network latency before acceleration (access to the IP address of the backend service)

Figure 2. Network latency after acceleration (access to the accelerated IP address)

Perform testing of UDP listeners
If the listener protocol of your GA instance is UDP, you can use UDPing to test the acceleration performance of GA. UDPing allows you to send UDP packets to a specified IP address and port.
UDP is a datagram transmission protocol. UDP datagrams are directly transmitted to endpoints in an endpoint group, and no sessions are established during transmission.
This topic describes how to use UDPing to test the acceleration performance of a GA instance that uses a UDP listener. In the following example, the endpoint server and the client run Alibaba Cloud Linux 3.
Deploy UDP Echo on the endpoint server.
Use UDPing to test the acceleration performance. We recommend that you deploy UDP Echo on the endpoint server. UDP Echo provides a quick and straightforward test of network latency and connectivity by simply echoing packets.
In this example, socat is used to deploy UDP Echo.
# Install socat.
yum install socat
# Start socat.
nohup socat -v UDP-LISTEN:<listener port>,fork PIPE 2>/dev/null &
Deploy UDPing on the client.
# Download UDPing.
wget https://networktools-public.oss-cn-hangzhou.aliyuncs.com/ga/udping/udping.py
# Grant UDPing execution permissions.
chmod +x udping.py
Test the acceleration performance.
Log on to the client.
Run the
./udping.py <Backend server IP address> <Listener Port>command to view the network latency before GA is used.Run the
./udping.py <Accelerated IP address> <Listener port>command to view the network latency after GA is used.NoteThe acceleration performance varies based on the actual workload.
In the following example, a client in the China (Hong Kong) region accessed a backend server in the Germany (Frankfurt) region.
Figure 1. Network latency before GA is used

Figure 2. Network latency after GA is used

References
For more information about the network detection tool, see the following topics: