This topic describes how to query and analyze Alibaba Cloud service events in the system event bus. Event analysis lets you query these events by schema and key-value conditions, apply aggregate functions, and visualize results as charts or tables.
Prerequisites
Before you begin, make sure that you have:
Activated EventBridge and granted the required permissions to a Resource Access Management (RAM) user. For more information, see Activate EventBridge and grant permissions to a RAM user
Enable event analysis
Log on to the EventBridge console. In the left-side navigation pane, click Event Buses.
In the top navigation bar, select a region.
On the Event Bus page, find the system event bus and click Details in the Actions column.
In the Basic Information section of the Event Bus Overview page, turn on Event Analysis.
In the Note message, click OK.
Query and analyze events
Log on to the EventBridge console. In the left-side navigation pane, choose Event Center > Event Analysis.
In the top navigation bar, select a region.
On the Event Analysis page, configure the following query parameters and click Query.
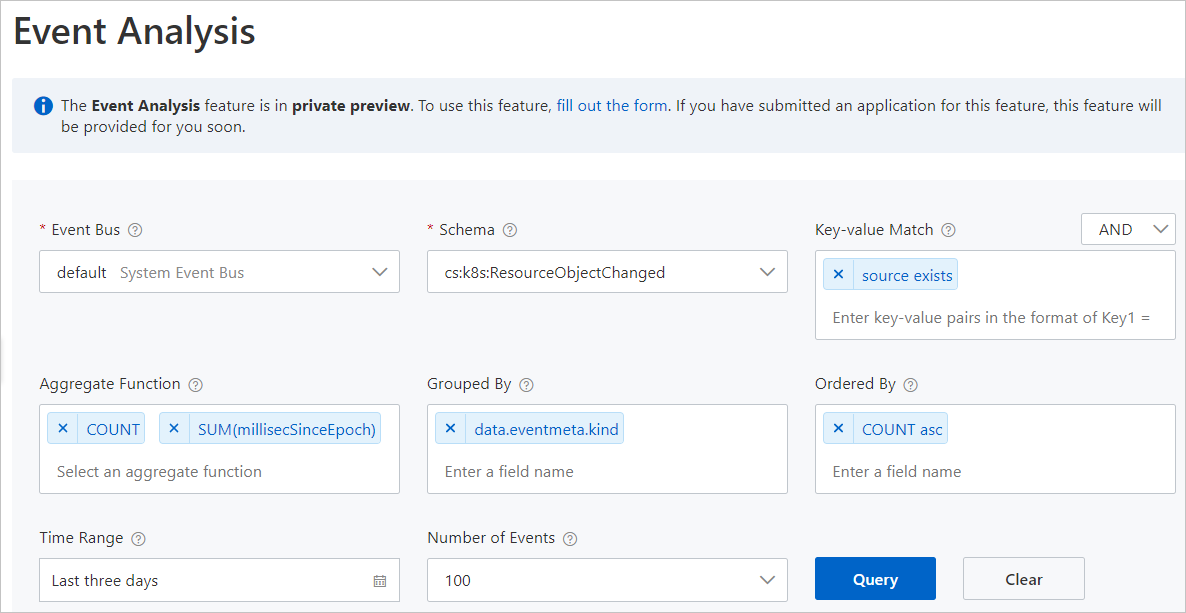
Query parameters
| Parameter | Required | Description |
|---|---|---|
| Event Bus | Yes | The name of the event bus whose events you want to query. |
| Schema | Yes | The event type schema to query. Each schema corresponds to a specific type of Alibaba Cloud service event. For a list of supported event types, see Alibaba Cloud service event sources. |
| Key-value Match | No | One or more key-value pairs to filter events. Supported operators: = (equals), != (not equals), exists, and does-not-exist. Select AND or OR to define the relationship between multiple key-value pairs. |
| Aggregate Function | No | An aggregate function for data visualization. Each aggregate function produces a separate line chart. Required for chart-based results on the Aggregate Function tab. |
| Grouped By | No | One or more event property fields to group results by. |
| Ordered By | No | One or more fields to sort results by, in ascending or descending order based on the specified aggregate functions. Required for table-based results on the Table tab. |
| Time Range | No | The time range for the query. |
| Number of Events | No | The maximum number of events to return. |
View query results
Results appear on two tabs: Aggregate Function and Table. Each tab serves a different analysis purpose.
Aggregate Function tab
Use this tab to identify trends and patterns over time.
Y-axis: Aggregate values and units.
X-axis: Time.
Lines: Each color represents a different resource item. For example, querying Container Service for Kubernetes (ACK) events produces separate lines for Deployments, ReplicaSets, and StatefulSets. For details on these resource types, see Concepts.
This tab requires the Aggregate Function parameter to be configured.
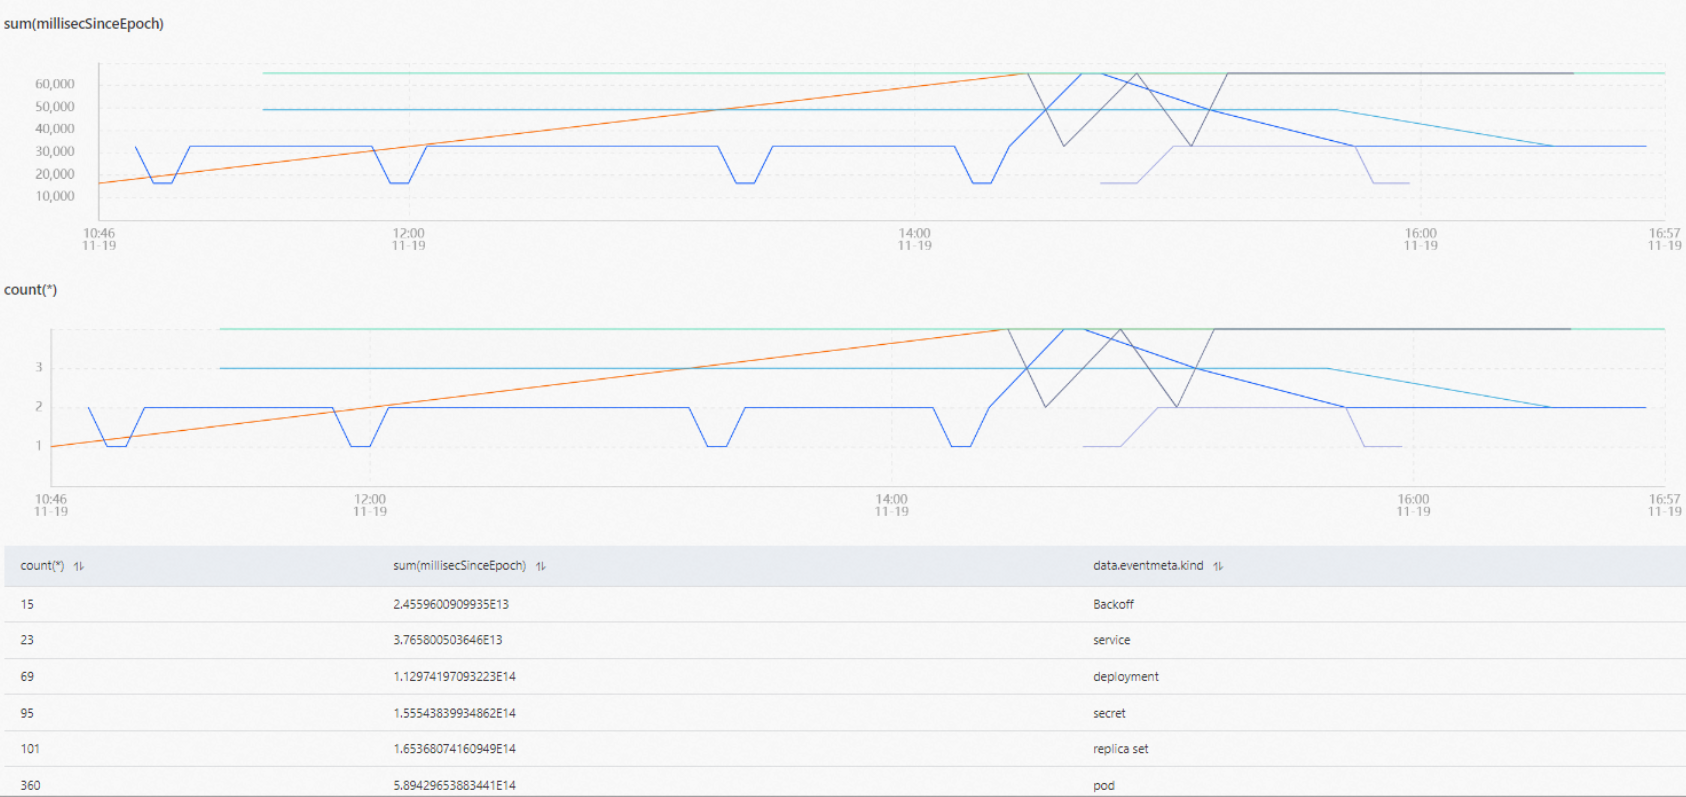
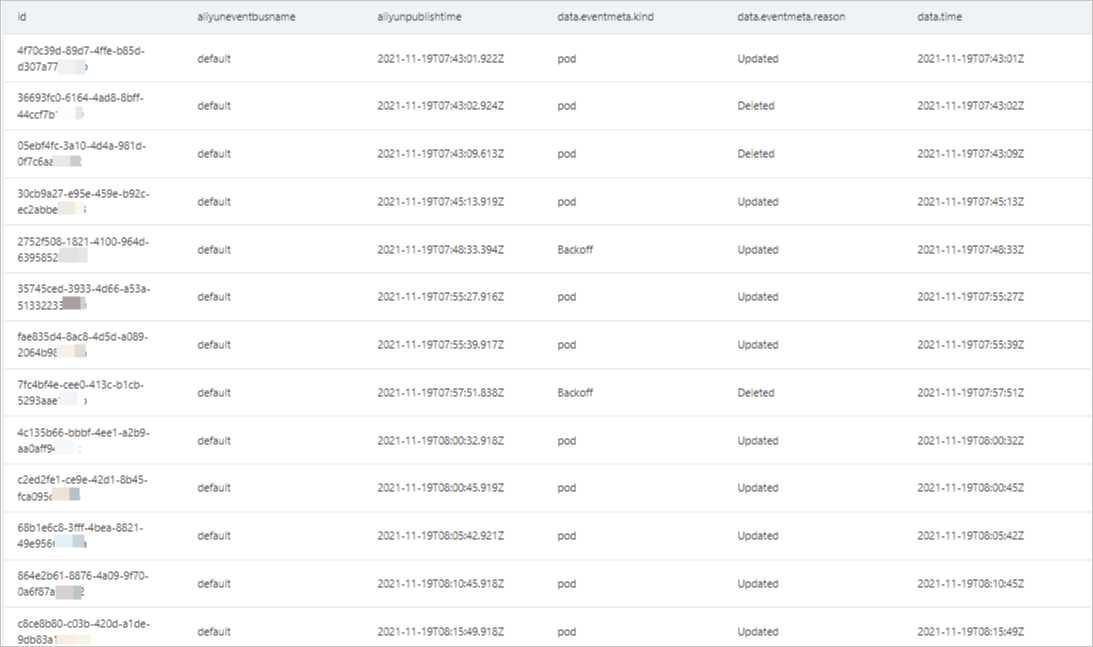
Table tab
Use this tab to drill into individual events. The table includes:
Event ID
Event bus name
Event publish time
Click an event to view its details and trace. For more information, see Event query overview.
This tab requires the Ordered By parameter to be configured.
Limits
Event analysis supports only event schemas in the OpenAPI 3.0 format.
What's next
To learn about the types of events that Alibaba Cloud services publish, see Alibaba Cloud service event sources.
To query individual events and trace their delivery path, see Event query overview.