If the configuration of a Logstash pipeline is incorrect, the output data of the pipeline may not meet requirements. In this case, you must repeatedly check the format of the data on the destination and modify the pipeline configuration in the console. This increases time and labor costs. To address this issue, you can use the pipeline configuration debugging feature provided by Logstash. This feature allows you to view the output data of a Logstash pipeline in the console after you create and deploy the pipeline. This reduces debugging costs. This topic describes how to use the feature.
Prerequisites
The logstash-output-file_extend plug-in is installed. For more information, see Install and remove a plug-in.
Procedure
- Go to the Logstash Clusters page of the Alibaba Cloud Elasticsearch console.
- In the top navigation bar, select the region where the desired cluster resides.
On the Logstash Clusters page, find the cluster and click its ID.
In the left-side navigation pane of the page that appears, click Pipelines.
On the Pipelines page, click Create Pipeline.
Configure and start a pipeline.
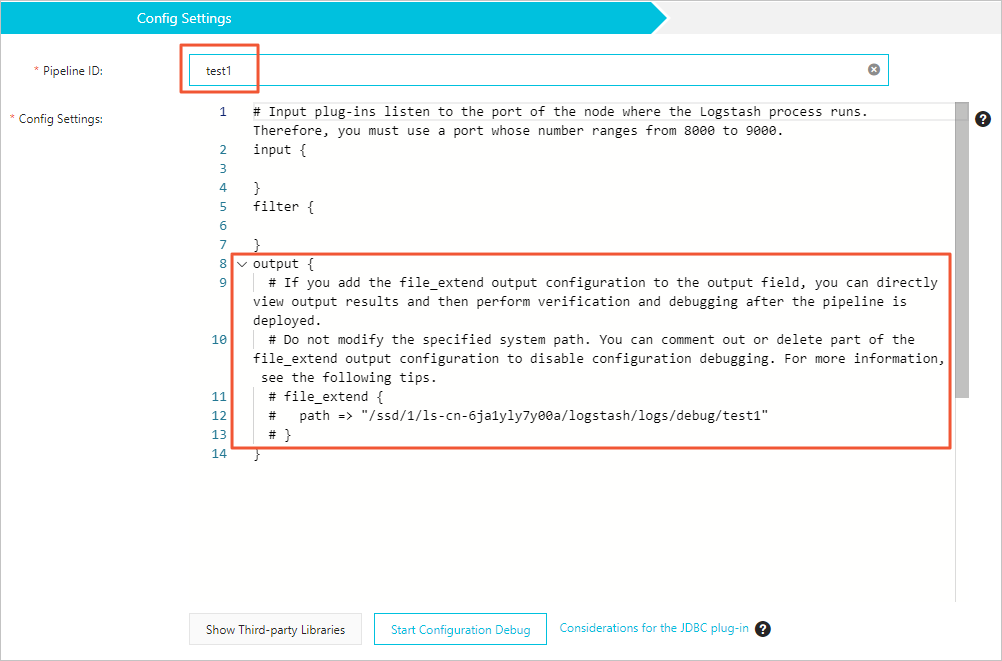
In the Config Settings step, configure Pipeline ID and Config Settings.

Parameter
Description
Pipeline ID
Specify an ID based on your business requirements. The pipeline ID is automatically mapped to the path field of the file_extend parameter.
Config Settings
Config Settings consists of the following parts:
input: specifies the data source. Open source Logstash input plug-ins are supported, except the file plug-in.
filter: processes the data collected from the data source. Numerous filter plug-ins are supported.
output: sends the processed data to the destination. In addition to open source Logstash output plug-ins, Alibaba Cloud Logstash provides the file_extend output plug-in. This plug-in allows you to enable the pipeline configuration debugging feature. After the pipeline is deployed, you can view the output data of the pipeline in the console and check whether the data meets requirements. If the data does not meet requirements, modify the pipeline configuration.
The following code provides a configuration example:
input { elasticsearch { hosts => "http://es-cn-0pp1jxv000****.elasticsearch.aliyuncs.com:9200" user => "elastic" index => "twitter" password => "<YOUR_PASSWORD>" docinfo => true } } filter { } output { elasticsearch { hosts => ["http://es-cn-000000000i****.elasticsearch.aliyuncs.com:9200"] user => "elastic" password => "<your_password>" index => "%{[@metadata][_index]}" document_id => "%{[@metadata][_id]}" } file_extend { path => "/ssd/1/ls-cn-v0h1kzca****/logstash/logs/debug/test" } }ImportantBy default, the file_extend parameter in the output part is commented out. If you want to use the pipeline configuration debugging feature, uncomment the parameter.
By default, the path indicated by the path field of the file_extend parameter is specified by the system. You are not allowed to change the path. You can click Start Configuration Debug to obtain the path.
{pipelineid} in the path indicated by the path field is automatically mapped to the pipeline ID that you specify. You are not allowed to modify {pipelineid}. Otherwise, debug logs cannot be obtained.
An input plug-in for which an Elasticsearch cluster is specified can read data from the cluster based on the query statement that is configured for the plug-in. The plug-in is suitable for scenarios in which multiple test logs need to be imported at a time. By default, the synchronization operation is automatically disabled and the Logstash process is stopped after data is read. However, Logstash needs to ensure that the process continuously runs. Therefore, Logstash restarts the process. This may cause duplicate data writes if only one pipeline exists. To address this issue, you can specify a period to enable Logstash to run a pipeline on a regular basis. For example, you can enable Logstash to run a pipeline at 13:20 on March 5 every year. After the pipeline is run for the first time, Logstash stops it. You can use the schedule parameter together with the syntax of cron expressions to specify the period. For more information, see Scheduling in open source Logstash documentation.
The following code provides an example. In this example, a pipeline is scheduled to run at 13:20 on March 5 every year.
schedule => "20 13 5 3 *"Click Next to configure pipeline parameters.
For more information about the parameters, see Use configuration files to manage pipelines.
Save the settings and deploy the pipeline.
Save: After you click this button, the system stores the pipeline settings and triggers a cluster change. However, the settings do not take effect. After you click Save, the Pipelines page appears. On the Pipelines page, find the created pipeline and click Deploy Now in the Actions column. Then, the system restarts the Logstash cluster to make the settings take effect.
Save and Deploy: After you click this button, the system restarts the Logstash cluster to make the settings take effect.
In the message that appears, click OK.
View the debug logs of the pipeline.
After the cluster is restarted, find the pipeline on the Pipelines page and click View Debug Logs in the Actions column.
On the Debug Log tab of the Logs page, view the output data of the pipeline.
If you have multiple pipelines, you can enter pipelineId: <Pipeline ID> in the search box to search for the logs of the pipeline.
