When disk usage on an Alibaba Cloud Elasticsearch cluster exceeds 85%, Elasticsearch automatically restricts write access to protect data integrity. This topic explains the root cause, how to restore write access quickly, and how to prevent recurrence.
Disclaimer: This topic may contain information about third-party products. Such information is only for reference. Alibaba Cloud does not make any guarantee, express or implied, with respect to the performance and reliability of third-party products, as well as potential impacts of operations on the products.
Symptoms
-
Write requests fail with:
FORBIDDEN/12/index read-only / allow delete (api) -
Cluster health status is red. Run
GET /_cat/nodes?vto check whether nodes have rejoined the cluster. RunGET /_cat/allocation?vto check shard allocation.NoteRed cluster health means primary shards are unavailable. Data may be at risk.
-
Kibana returns
internal server errorwhen creating ingest pipelines or enrolling Beats -
Cluster or Kibana monitoring shows disk usage approaching 100%
Root cause
Disk usage thresholds
Elasticsearch monitors disk usage continuously and enforces three watermark thresholds:
-
85% — low watermark: Elasticsearch stops allocating new shards to this node.
-
90% — high watermark: Elasticsearch relocates existing shards to nodes with more free disk space.
-
95% — flood stage: Elasticsearch sets the
read_only_allow_deleteattribute on all indexes, blocking all write operations.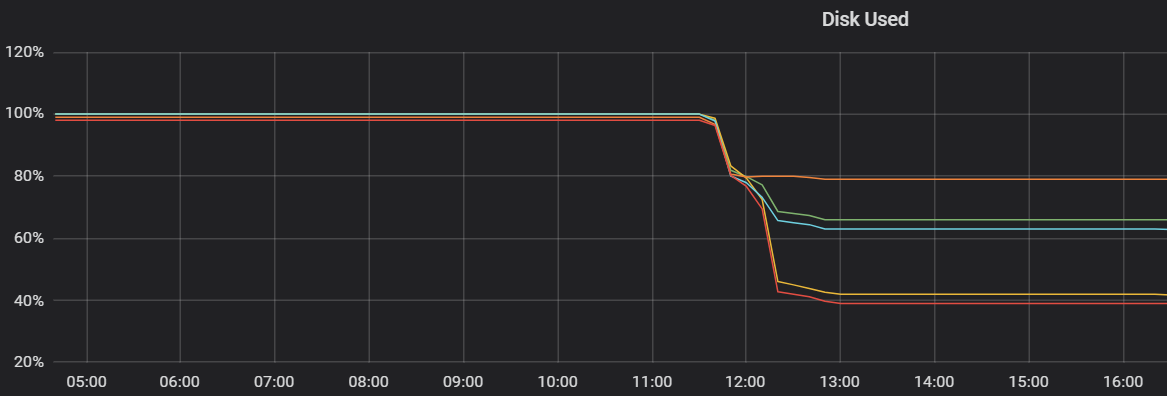
In addition to disk watermark thresholds, the following conditions may also cause write failures or alerts. Investigate these causes together:
Shard count limit reached
By default, each data node in an Elasticsearch cluster supports up to 1,000 shards. You can verify the current limit by running GET /_cluster/settings?include_defaults=true&flat_settings=true and checking the cluster.max_shards_per_node parameter. When the shard count exceeds the limit, Logstash cannot write logs and new indexes cannot be created.
As a temporary workaround, run the following command to increase the shard limit:
PUT /_cluster/settings
{
  "transient": {
    "cluster": {
      "max_shards_per_node": 2000
    }
  }
}Make sure to add a space after PUT in the command.
For a long-term solution, clean up expired or unused indexes, or add more data nodes to the cluster.
System index lifecycle policies
If disk usage fluctuates frequently but no custom Index Lifecycle Management (ILM) policies are configured, the fluctuation may be caused by the default lifecycle policies of system indexes, such as .monitoring-es-* and .monitoring-kibana-*. These indexes are automatically created daily, and old indexes are automatically deleted. This is normal behavior.
Resource correlation impact
High disk usage may be accompanied by high JVM memory usage (for example, reaching 90%) and node anomalies, which may prevent Kibana from connecting. In this case, scale up both disk capacity and memory resources. If the cluster is unhealthy, enable forced changes during the configuration upgrade. Perform the operation during off-peak business hours to avoid service disruption caused by node restarts.
Quick fix (10–15 minutes)
-
Delete old or unused indexes to free disk space.
WarningDeleted data cannot be restored. To preserve data, consider increasing storage capacity instead.
curl -u <username>:<password> -XDELETE http://<host>:<port>/<index-name>-
<host>is your cluster's internal or public endpoint. Configure the access allowlist before running this command. -
If the cluster is unresponsive, trigger a forced restart and run this command during the restart.
-
-
Remove the read-only lock. Freeing disk space does not automatically lift the write block. Clear it by setting
index.blocks.read_only_allow_deletetonull:PUT /_all/_settings { "index.blocks.read_only_allow_delete": null } -
Verify cluster health. If the status is still red, run
GET /_cat/allocation?vto check for unassigned shards. -
If unassigned shards remain, run
GET /_cluster/allocation/explainto identify the cause. If the output shows exhausted allocation retries (as in the screenshot below), runPOST /_cluster/reroute?retry_failed=true.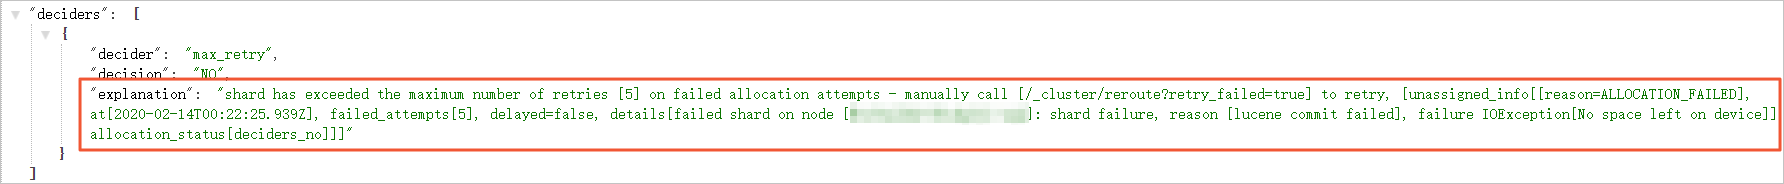
-
If the cluster health status remains red after all recovery steps, contact Alibaba Cloud technical support.
FAQ
Why does the Elasticsearch console show normal cluster status but I still receive disk usage alerts?
A normal cluster status on the console only indicates that the cluster is currently available. However, disk usage may have already reached the alert threshold (for example, 91%). Although high disk usage has not immediately triggered read_only mode, it is approaching the critical watermark — at 95%, forced read-only mode is triggered, and write operations can be blocked at any time.
We recommend that you immediately check the actual disk usage on the Cluster Monitoring page, and take one of the following actions to eliminate the risk:
-
Scale up the disk capacity.
-
Clean up unused or expired indexes.
Prevention
Enable disk usage monitoring and configure alerts to fire when usage exceeds 80%. Route alerts to your operations team so they can act before the flood stage is reached. For setup instructions, see Configure monitoring and alerting.