You can use monitoring features to identify and troubleshoot issues that occur on Elastic Compute Service (ECS) instances and address potential risks before the issues and risks affect your business.
Handle system events at the earliest opportunity
When the system performs O&M operations or encounters issues and determines that the operations or issues may affect the operation of ECS instances, the system generates system events. System events provide information such as solutions and event cycles. To prevent event consequences, such as instance restart and stop, from affecting your business, we recommend that you handle system events at the earliest opportunity. For more information, see Overview.
When a subscription instance expires, a system event is displayed in the ECS console, as shown in the following figure.
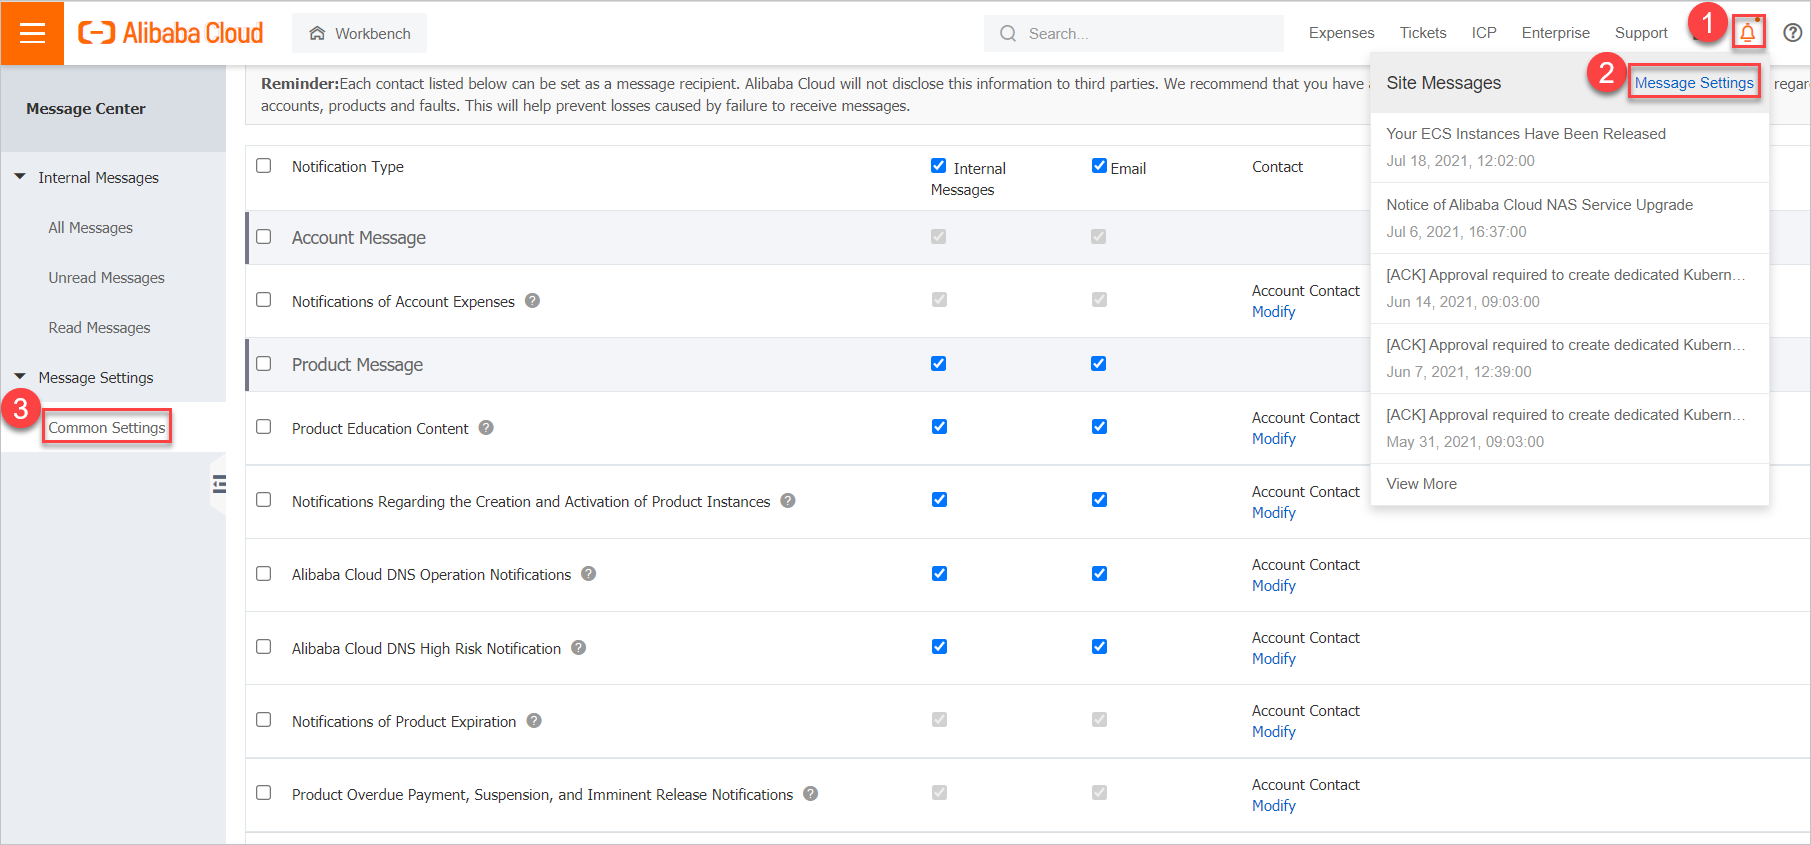
Make sure that internal messages for instance expiration, service O&M, and instance fault issues are enabled on the Common Settings page in the Message Center console, as shown in the following figure. Otherwise, you cannot receive system events in the ECS console.
Monitor the running metrics of instances
Alibaba Cloud collects and shows the running metrics of instances to help you understand the real-time and historical running status of the instances. You can check whether instances run as expected based on their running metrics. If the CPU utilization of an instance is consistently high, you can check whether processes on the instance are abnormal or whether the configurations of the instance cannot meet your requirements.
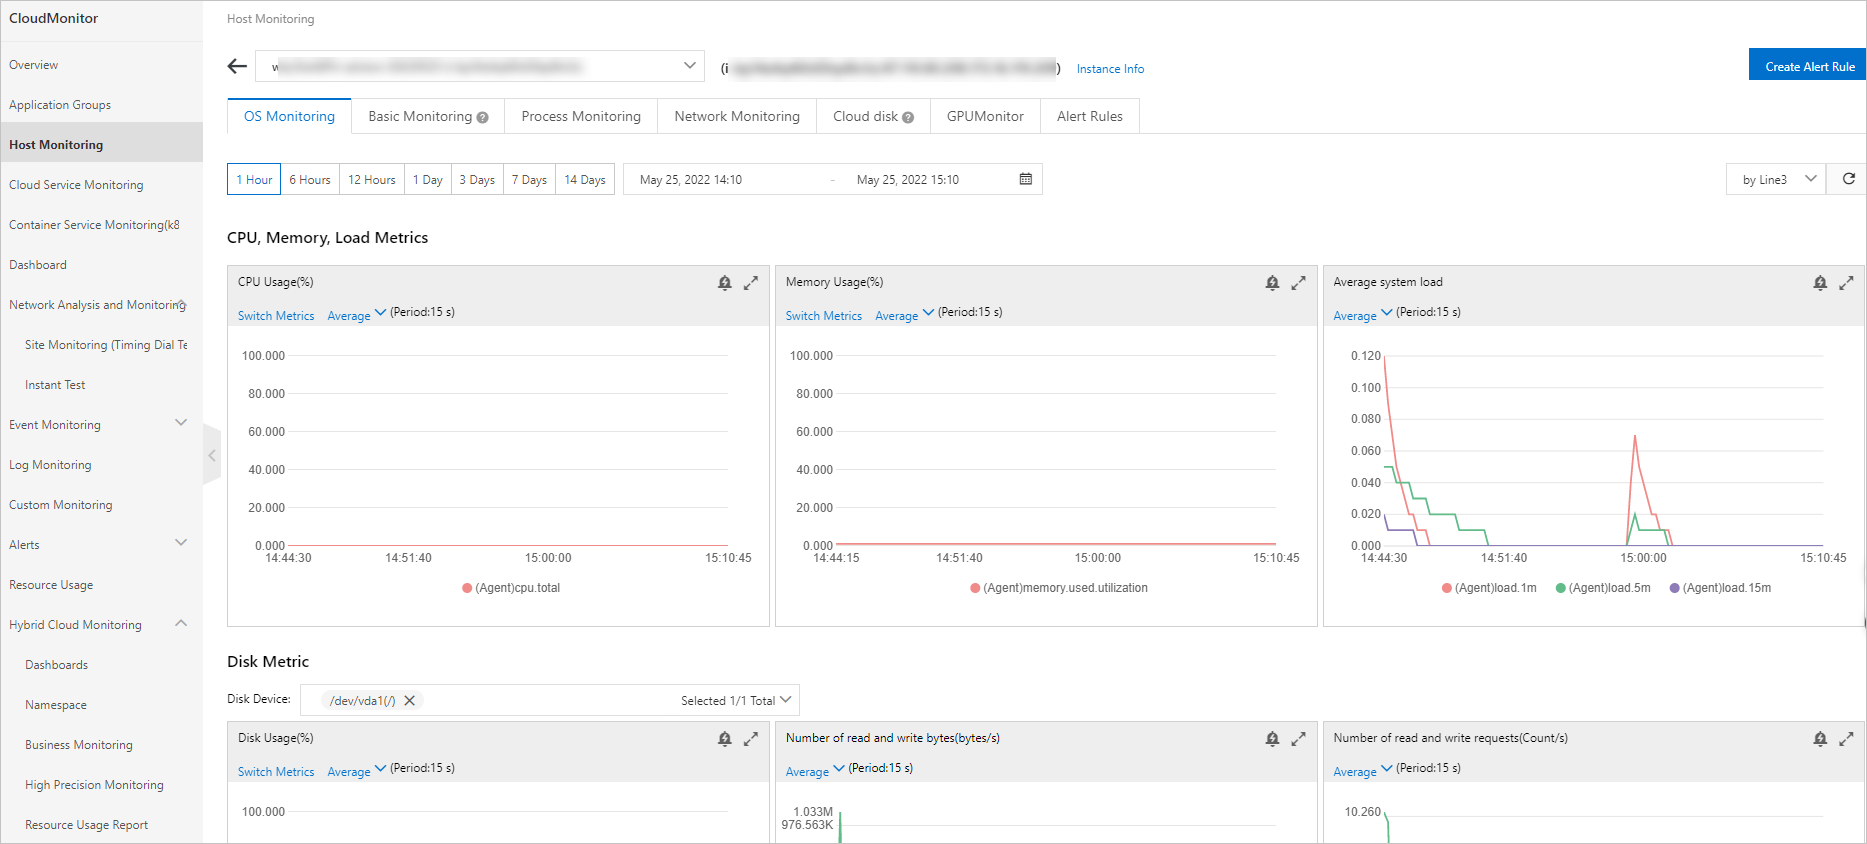
You can view the running metrics of an instance on the Monitoring tab of the Instance Details page in the ECS console or on the Host Monitoring page in the CloudMonitor console. For more information, see View the monitoring information of an ECS instance and Overview.
The following running metrics of an instance are displayed on the Monitoring tab of the Instance Details page in the ECS console:
The usage of computing, storage, and network resources such as the CPU utilization, disk read/write performance, and packet forwarding rate
The CPU credit usage of a burstable instance

The following running metrics of an instance are displayed on the OS Monitoring tab of the Host Monitoring Details page in the CloudMonitor console:
The usage of computing, storage, and network resources such as the CPU utilization, disk read/write performance, and packet forwarding rate
The active processes on an instance
The GPU memory usage of a GPU-accelerated instance

Use the alerting feature to trigger notifications
You can use the alerting feature of CloudMonitor to configure alert rules for specific events and instance running metrics. When the specified events occur or when the instance running metrics are abnormal, contacts are notified by email. This reduces manual O&M workloads. For more information, see Configure event notifications and Configure alerts for an ECS instance.
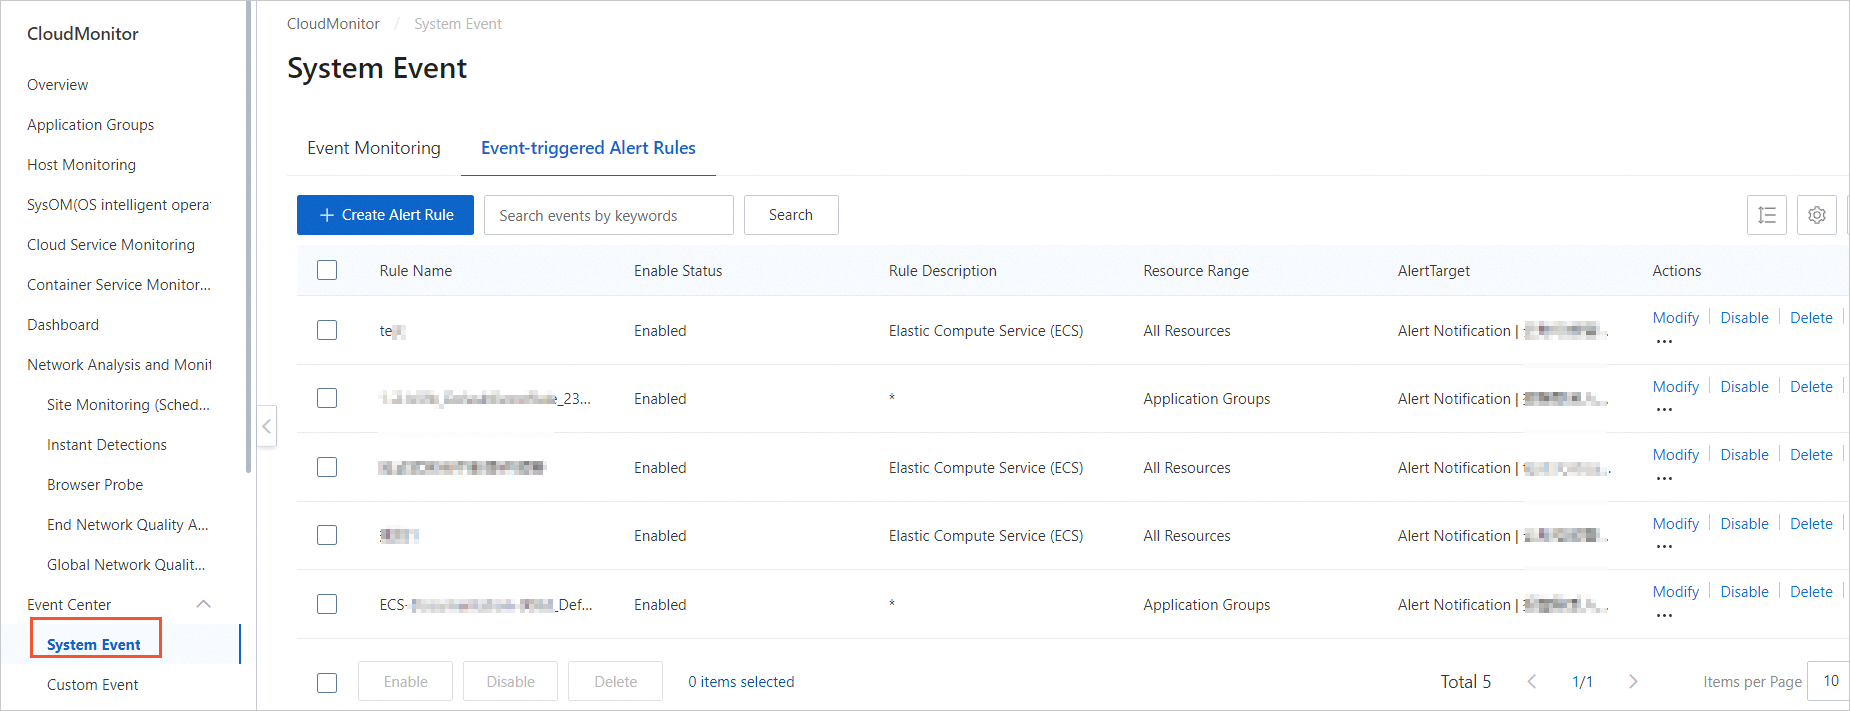
You can configure an alert rule for an event, as shown in the following figure.

You can configure alert rules for instance running metrics, as shown in the following figure.
