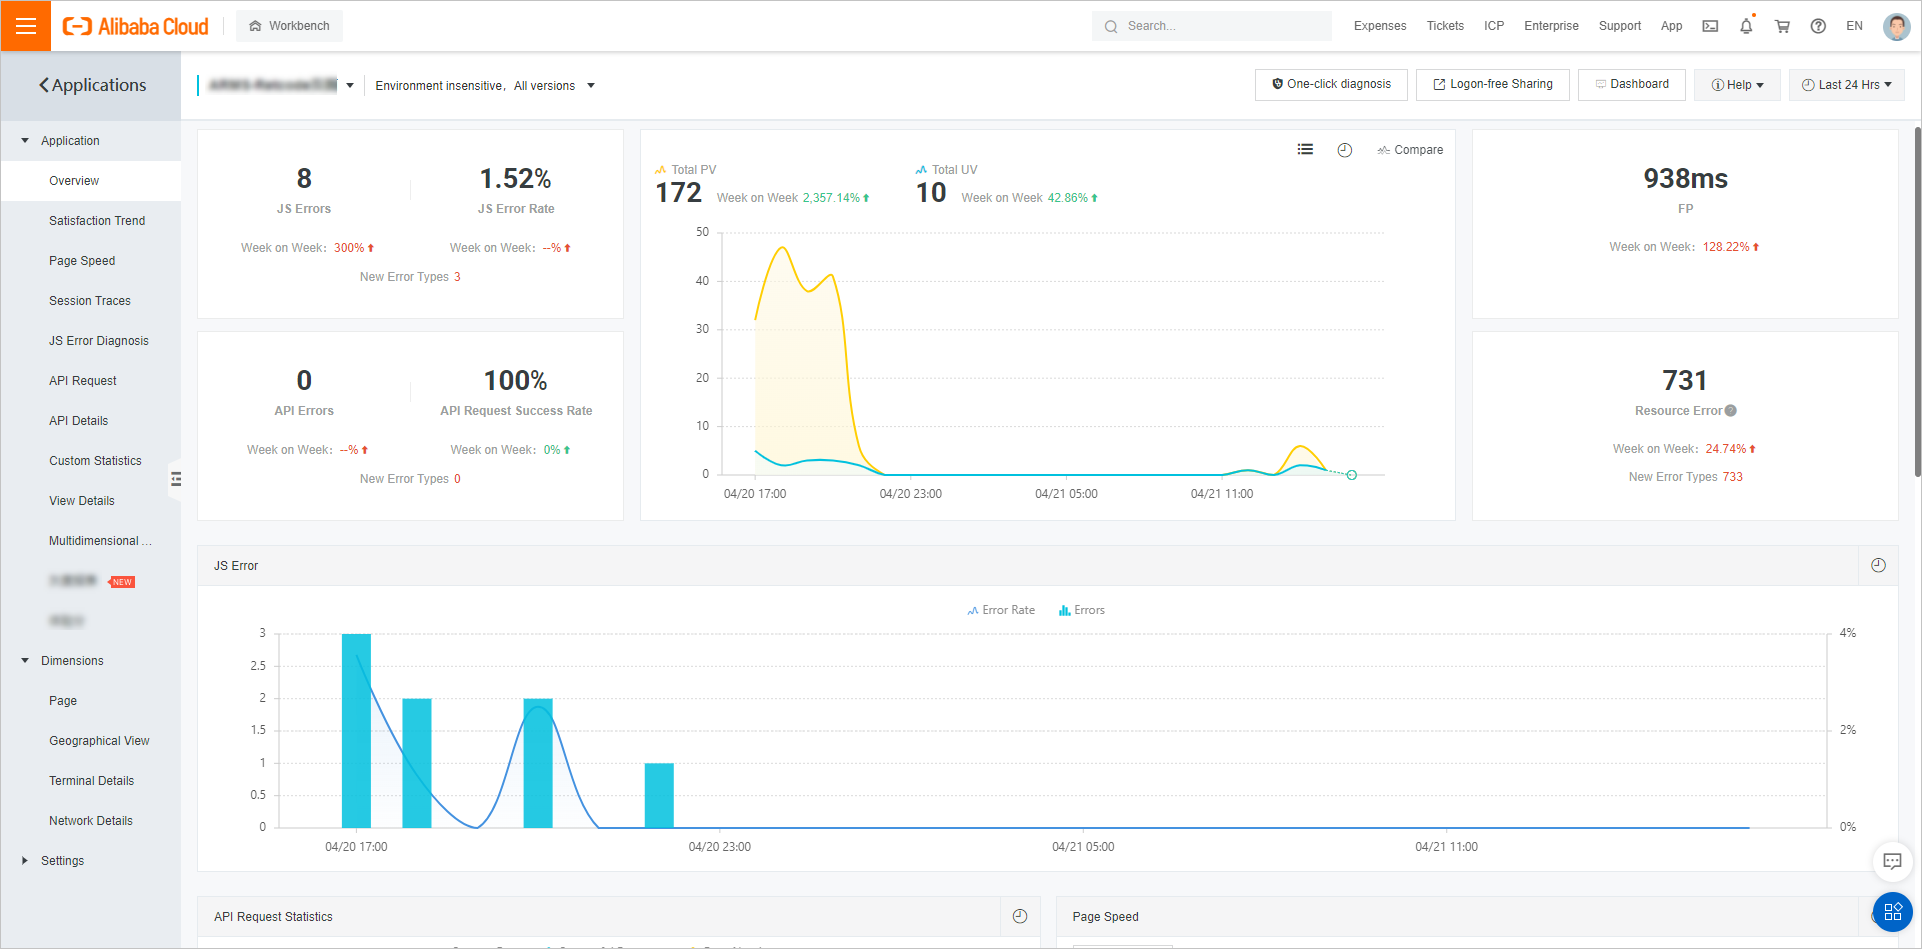
The ARMS RUM application is applicable to scenarios such as web page monitoring, Weex monitoring, and mini-program monitoring. This application helps you monitor the health status of web pages and mini-programs based on the following metrics: the page loading speed (speed test), page stability (JavaScript errors), and success rate of external service calls (API calls).
Background information
When a user accesses a service, the whole process can be divided into three phases: page generation (server status), page loading, and page runtime.
To ensure stable online services, the server monitors the status of these services. Existing server monitoring systems are quite mature, but the monitoring of page loading and runtime is far from satisfactory. For example:
The errors that users encounter when they access your website cannot be immediately captured.
The actual response time for users from different countries or regions to access your website is unknown.
The performance and success rate of asynchronous data calls of each application is unknown.
Solution
ARMS Browser Monitoring monitors the status of page loading and runtime, and reports data to the logger. The data includes the page load performance, runtime exceptions, and API call status and consumed time. Then, the platform monitors the access of all real online users based on the rich real-time log analytics and processing services provided by ARMS. Finally, the platform presents visual reports to help you detect and diagnose problems at the earliest opportunity.

Scenarios
ARMS Browser Monitoring can be used in the following scenarios:
Capability overview
ARMS Browser Monitoring has rich browser monitoring capabilities. This section provides the following examples.
ARMS browser monitoring can measure a variety of page performance metrics, including the first rendering time, first screen time, DOM Ready time, and resource loading time.
The Browser Monitoring module of Application Real-Time Monitoring Service (ARMS) provides the JavaScript (JS) error diagnostics feature. You can view the basic information and distribution of JS errors and backtrack user behaviors. This feature helps you identify and fix errors.
ARMS frontend monitoring provides the status of each API call in an application, including the call success rate, returned information, and the average time consumed for success or failure.
The frontend and backend Tracing Analysis feature can connect the links between API requests sent from the frontend and backend calls to truly restore the complete scene of code execution.
Browser and platform compatibility
Browser or platform | Supported version | Automatic data reporting with the SDK | Manual data report |
Safari | Safari 9+ | ️️️Supported | ️️️Supported |
Chrome | Chrome 49+ | ️️️Supported | ️️️Supported |
IE | IE 9+ | ️️️Supported | ️️️Supported |
Edge | Edge 12+ | ️️️Supported | ️️️Supported |
Firefox | Firefox 36+ | ️️️Supported | ️️️Supported |
Opera | Opera 43+ | ️️️Supported | ️️️Supported |
Safari for iOS | Safari for iOS 9.2+ | ️️️Supported | ️️️Supported |
Android Browser | android_webkit 4.4.2+ | ️️️Supported | ️️️Supported |
Weex | Weex 0.16.0+ | Not supported | ️️️Supported |