The relationship diagram in DataWorks intelligent data modeling provides a visual canvas to design, build, and display the model architecture of a data warehouse. This architecture includes dimensions, dimension tables, fact tables, aggregate tables, and application tables. Each relationship diagram represents a data warehouse model, and you can create multiple relationship diagrams within a single account.
Preparations
The models required for the relationship graph have been created. DataWorks intelligent data modeling supports various types of models. You need to perform data warehouse planning and dimensional modeling as needed.
Data Warehouse Planning
Before you perform data modeling, the data warehouse architect must collaborate with the data development and model design teams to survey business requirements and data sources. This process clarifies the overall data structure and finalizes the design of modules such as data layers, business categories, data domains, business processes, data marts, and subject areas. For more information, see Data Warehouse Planning.
Dimensional Modeling
Conceptual model - dimension: A dimension is a perspective for observing your business. You can plan and create dimensions in Dimensional Modeling and then associate them with dimension tables during creation. This lets you analyze business data from different perspectives.
Logical model - dimension table: Based on your data domain plan, you can extract potential dimensions for data analysis. These dimensions and their attributes are stored in dimension tables.
Logical model - fact table: Based on your business process plan, you can analyze the actual data that may be generated. This data is then stored as fields in fact tables.
Logical model - aggregate table: An aggregate table stores statistical data for multiple derived metrics within a data domain that share the same period and dimensions. It is the result of high-level business abstraction and provides a basis for business queries, online analytical processing (OLAP), and data distribution.
Logical model - application table: An application table is used for specific business scenarios. It organizes statistical data for multiple atomic and derived metrics that share the same period and dimensions, or data of specific granularities. It provides a basis for business queries, OLAP, and data distribution.
Go to the entry points for creating a relationship diagram
Go to the Data Modeling page.
Log on to the DataWorks console. In the top navigation bar, select the desired region. In the left-side navigation pane, choose . On the page that appears, select the desired workspace from the drop-down list and click Go to Data Modeling.
Navigate to the relationship diagram page.
On the intelligent data modeling page, click Relationship Diagrams in the top menu bar.
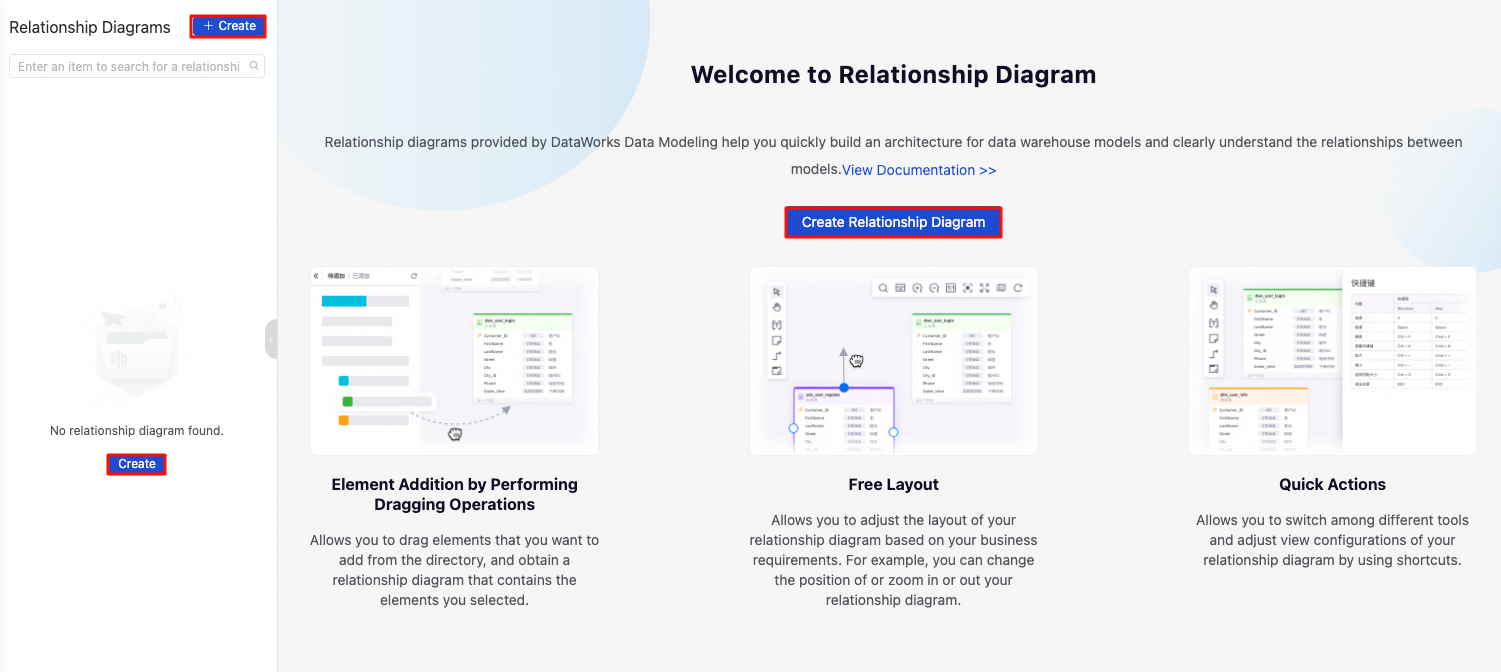
You can create your first graph from the following entry points.
Use a relationship diagram to build a data warehouse model architecture
On the relationship diagram page, you can perform the following model building operations:
Add a model: The To-Be-Added Objects panel on the left side of the page lists all models that are created in Data Modeling. Find the model that you want to add in the directory tree and drag it to the canvas on the right.
Build relationships: You can use the connection line tool from the toolbar to create associations between models. These associations represent data flows or logical dependencies. You can double-click a connection line to add a description.
Enrich the diagram: You can use tools such as notes, text boxes, and groups to add annotations and explanations to the model architecture diagram.
Save and Export: The content on the canvas is automatically saved. You can click Export to download the model architecture diagram as an image.
The following figure shows a sample data warehouse model architecture.
After a model is added to the canvas, click the ![]() icon on the model. Then, click the
icon on the model. Then, click the ![]() icon that appears above the model to open the model details page. For more information about the icons on the canvas, see Canvas feature reference.
icon that appears above the model to open the model details page. For more information about the icons on the canvas, see Canvas feature reference.
Canvas feature reference
The icons on the relationship diagram canvas are divided into object icons and function icons.
Object icons
Element
Description

Represents a conceptual model dimension.

Represents a logical model fact table.

Represents a logical model dimension table.

Represents a logical model application table.

Represents a logical model aggregate table.

Represents a note. Use notes to record information about the data warehouse model for easy reference and use. For example, you can record the method used to create the model architecture.
Function icons
Icon
Description

Select: Selects elements such as models and notes on the canvas to move, edit, or delete them.

Move Canvas: Press and hold the mouse to move the entire canvas.

Add Text: Click anywhere on the canvas to add a text box and enter a description.

Add Note: Click anywhere on the canvas to add a note.

Connection Line: Connects two models to establish an association. The arrow indicates the direction of the association. Double-click the line to add a description.

Group: Select multiple elements to create a group. You can customize the group name and background color. Groups are usually placed at the bottom layer of the canvas.

Keyboard Shortcuts: View supported keyboard shortcuts. For example, use
Ctrl + Zto undo the last operation.
Edit: After you select a text box or note, use this icon to edit its content.

Delete: Deletes the selected elements from the canvas.
ImportantDeleting an element also deletes all other elements connected to it by lines.

Refresh:
On the To Add list on the left: After you add or modify a model in another module, such as Dimensional Modeling, click this icon to refresh the To Add list. This operation does not affect the content on the canvas.
On the canvas toolbar on the right: Refreshes the entire canvas.

Search: Locates elements on the canvas. Supports fuzzy search by the Chinese name, English name, Code, and UUID of an element, and by the content in text boxes and notes.