This topic describes how to add and configure widgets in a blank canvas.
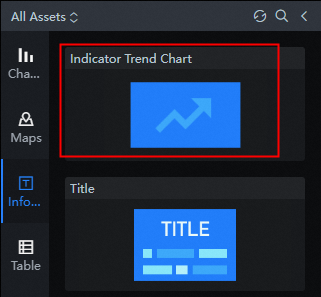
In the left-side navigation pane of the canvas, choose Information > Business Metric Trend to add the widget to the canvas.
Click a component. In the Configuration panel on the right of the visual application, configure the Title, Icon, and The value of the measuring point..
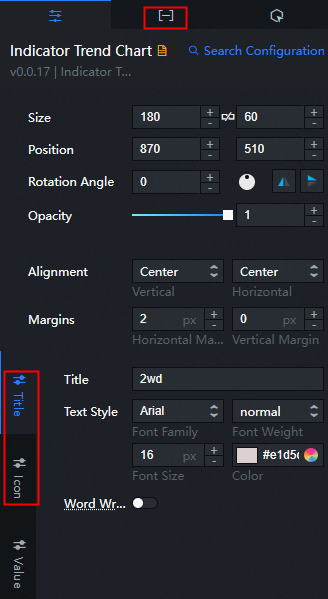
Repeat the preceding steps to configure the trend components for all business metrics.
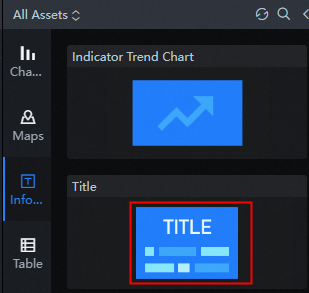
In the left-side All Assets section of the canvas, choose Info > General Titles to add the General Titles widget to the canvas.
Click the widget. In the Configure panel on the right side of the widget, configure the style of Common Title.
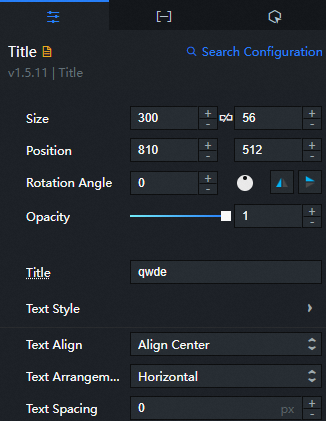
In the Configure panel of the Common Title tab, modify the name of the title.
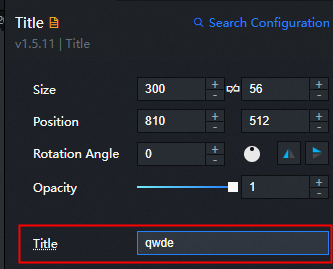
Repeat the preceding operations to add other Title widgets.
In the All Assets section on the left side of the canvas, choose Info > Trader.
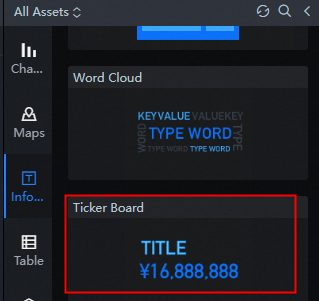
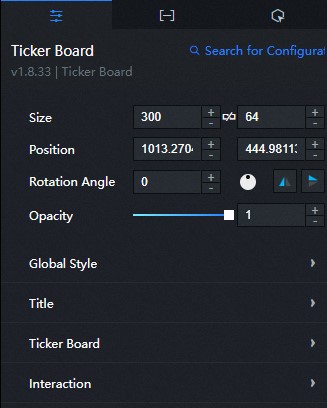
Click the component. In the Configure panel on the right side of the Visual Application tab, configure the style of the ticker board.
In the Data panel of the ticker board, replace the value with the data that you want to display.
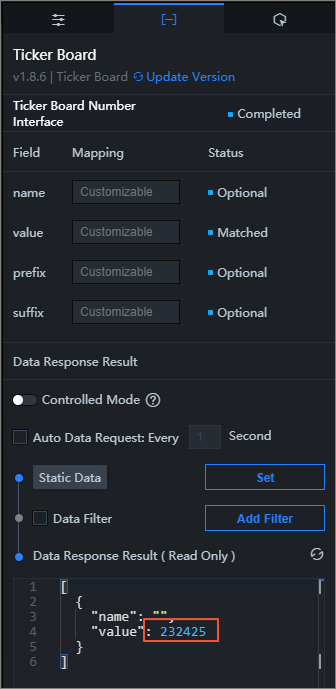
Repeat the preceding operations to add other Ticker Board widgets.
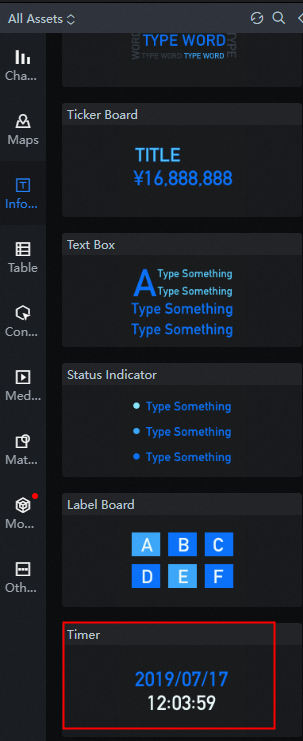
In the All Assets column on the left side of the canvas, choose Info > Timer.
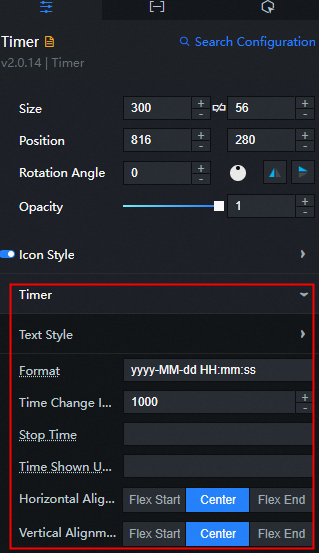
Configure the Timer style and modify the Icon Style and Timer configurations.
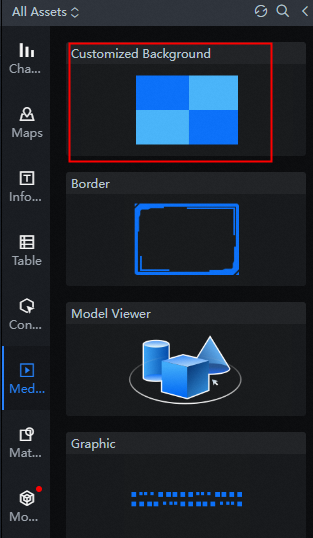
In the All Assets column on the left side of the canvas, choose Media > customized background Component.
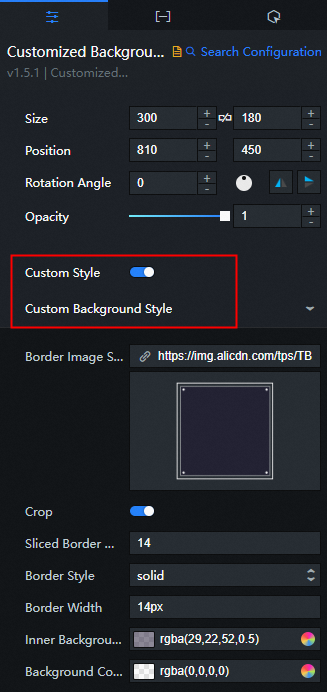
Configure the customized background style, chart size, and background color.
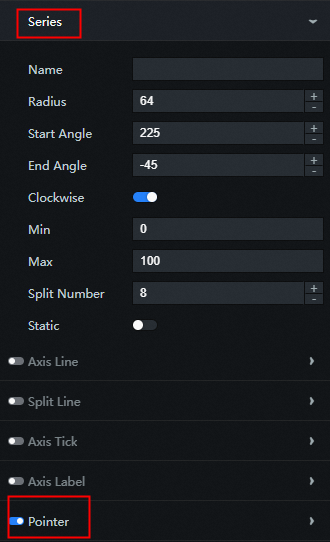
In the All Assets column on the left side of the canvas, choose Chart > Pie Chart > Dashboard.
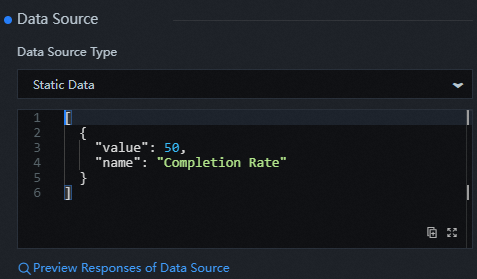
Configure the style of the dashboard and modify fields such as the dashboard pointer under Series.
Modify the data item json file as needed.
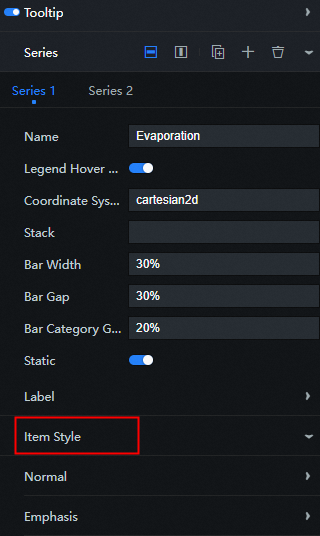
In the All Assets column on the left side of the canvas, choose Chart > Column Chart > Label Bubble Column Chart.
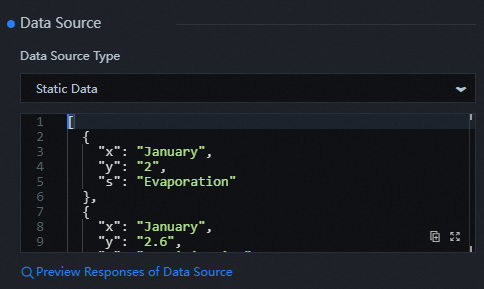
Configure the style of the Label Bubble Column Chart, modify the Element Style under Series, and modify the configurations such as the data source.
In the All Assets column on the left side of the canvas, choose Charts > area chart Widgets.
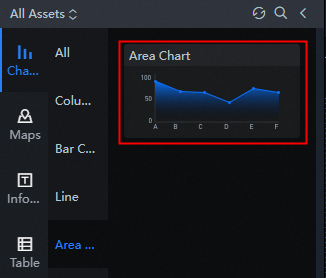
Configure the area chart style, modify the line style, and set the data source.
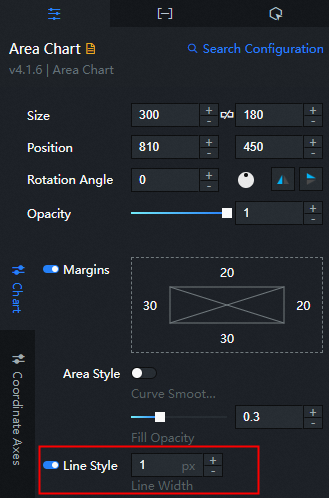
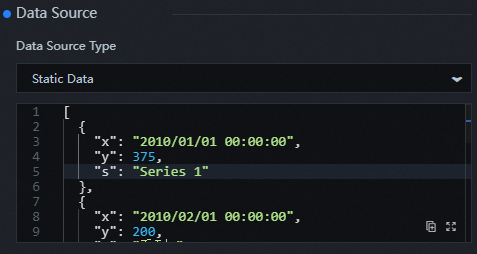
Repeat the preceding steps to add other area chart components.
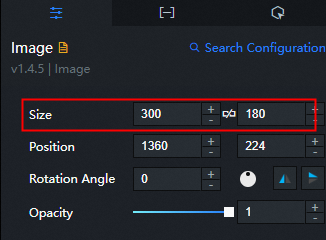
In the All Assets column on the left side of the canvas, choose Media > Image.
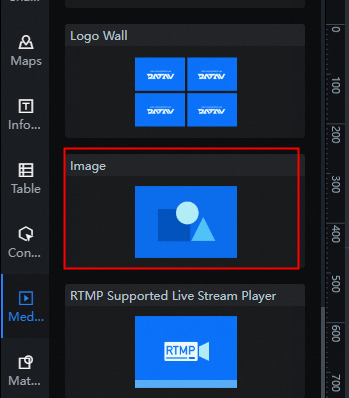
Configure the image style, Size.
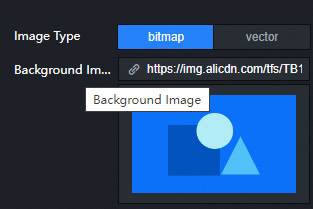
Modify the Background Image of an image as needed.
Repeat the preceding steps to add other single image widgets.
