The search (audit) feature provided by Database Autonomy Service (DAS) allows you to query and export information about SQL statements. This topic describes how to use the search feature in the SQL Explorer and Audit module.
If you have enabled DAS Enterprise Edition V3, the search feature is renamed to the audit feature.
Prerequisites
The database instance that you want to manage is connected to DAS and is in the Normal Access state.
The SQL Explorer and Audit feature is enabled for the database instance. For more information, see the Enable SQL Explorer and Audit section of the "Overview" topic.
The AliyunHDMReadOnlyWithSQLLogArchiveAccess policy is attached to a Resource Access Management (RAM) user if you want to use the search feature as the RAM user. For more information, see the Use system policies to grant permissions to a RAM user section of the "How do I use DAS as a RAM user?" topic.
NoteYou can also create a custom policy to grant the RAM user the permissions to use the search feature, including the log export feature. For more information, see the "Use custom policies to grant a RAM user the permissions to use the search and export features in the SQL Explorer and Audit module" section of the How do I use DAS as a RAM user? topic.
Supported databases and regions
For more information, see Editions and supported features.
Usage notes
If Completed is displayed in the Status column that corresponds to an SQL statement in the Logs section, the SQL statement is executed as expected. For example, if an SQL statement in a transaction is executed as expected when the transaction is rolled back, Completed is displayed in the Status column that corresponds to the SQL statement in the Logs section.
Connections to ApsaraDB RDS for MySQL instances and PolarDB for MySQL clusters may be reused. Therefore, the IP addresses and ports displayed in the Logs section may be different from the actual ones of connected clients. For more information, see Configure the connection pooling feature in ApsaraDB RDS for MySQL documentation and Connection pools in PolarDB for MySQL documentation.
The maximum length of an SQL statement in an SQL log is 8,192 bytes. If the actual length of an SQL statement exceeds 8,192 bytes, the excess part is not recorded. For ApsaraDB RDS for MySQL instances and PolarDB for MySQL clusters, the maximum length of an SQL statement in SQL logs is specified by a parameter. Take note of the following items:
If you specify the maximum length of an SQL statement to a length that is less than or equal to 8,192 bytes, the specified length is used as the upper limit and the excess part of an SQL statement is not recorded. A prefix is added to the SQL statement during data collection and processing. As a result, the maximum length of an SQL statement in an SQL log is slightly less than the specified length.
If you specify the maximum length of an SQL statement to a length that is greater than 8,192 bytes, the upper limit is 8,192 bytes by default. If the actual length of an SQL statement exceeds the upper limit, the excess part is not recorded. A prefix is added to an SQL statement during data collection and processing. As a result, the maximum length of an SQL statement in an SQL log is slightly less than 8,192 bytes.
NoteFor ApsaraDB RDS for MySQL instances and PolarDB for MySQL clusters that run MySQL 5.6 or 5.7, the maximum length of an SQL statement is specified by the loose_rds_audit_max_sql_size parameter.
For ApsaraDB RDS for MySQL instances and PolarDB for MySQL clusters that run MySQL 8.0, the maximum length of an SQL statement is specified by the loose_rds_audit_log_event_buffer_size parameter.
If you enable advanced query and the version of the database instance meets the following requirements, you can query data by transaction ID:Enable Advanced Query Transaction ID
For ApsaraDB RDS for MySQL instances, the major version is 8.0, the minor version is 20210311 or later, and the loose_rds_audit_log_version parameter is set to MYSQL_V3. For more information, see Parameters supported by ApsaraDB RDS instances that run MySQL 8.0.
For PolarDB for MySQL clusters, the version is 8.0.1.1.15 or later.
Procedure
Log on to the DAS console.
In the left-side navigation pane, choose Intelligent O&M Center > Instance Monitoring.
On the page that appears, find the database instance that you want to manage and click the instance ID. The instance details page appears.
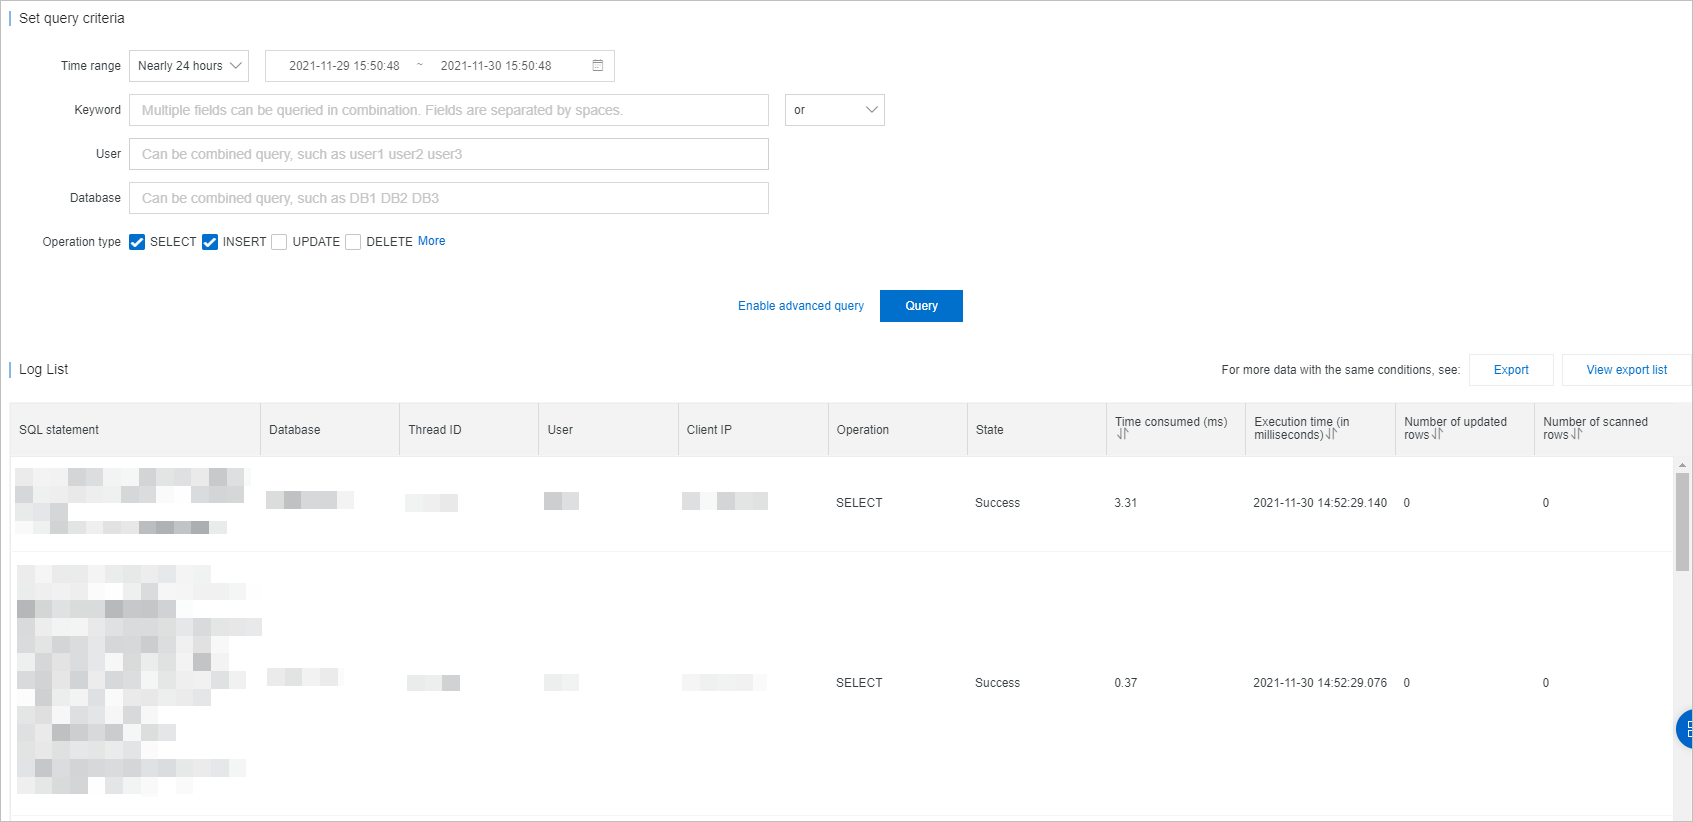
In the left-side navigation pane, choose Request Analysis > SQL Explorer and Audit. Then, on the Search tab, configure the parameters that are described in the following table to specify the query conditions.
If you have enabled DAS Enterprise Edition V3, configure parameters on the Audit tab.
Parameter
Description
Time Range
The time range during which you want to query executed SQL statements.
The maximum time range for an online query is 24 hours. The start time must fall within the data storage duration of SQL Explorer. This is because the SQL Explorer feature records a large number of SQL statements. You can use this feature to trace all operations that are performed on your database instance. If the time range for an online query exceeds 24 hours, the query requires an extended period of time and may time out.
NoteThe time range to query data must be later than the time when DAS Enterprise Edition is enabled and must fall within the data storage duration of SQL Explorer.
If you want to query SQL statements within a time range that exceeds 24 hours, we recommend that you export logs to your on-premises computer.
In the SQL Explorer and Audit module that uses a combination of hot storage and cold storage, you can query and export data within a maximum time range of 24 hours.
Keyword
The keywords that are used to query data. You can specify multiple keywords that are separated by spaces. Fuzzy queries are not supported.
NoteEach keyword must contain at least four characters.
User
The usernames that are used to query data. You can specify multiple usernames that are separated by spaces. Example: user1 user2 user3.
Database
The database names that are used to query data. You can specify multiple database names that are separated by spaces. Example: DB1 DB2 DB3.
Operation Type
The operation types that you want to query. You can select one or more operation types.
NoteYou can click Enable Advanced Query to configure more parameters to further refine the query.
Click Query. Then, you can view the information about queried SQL statements in the Logs section.
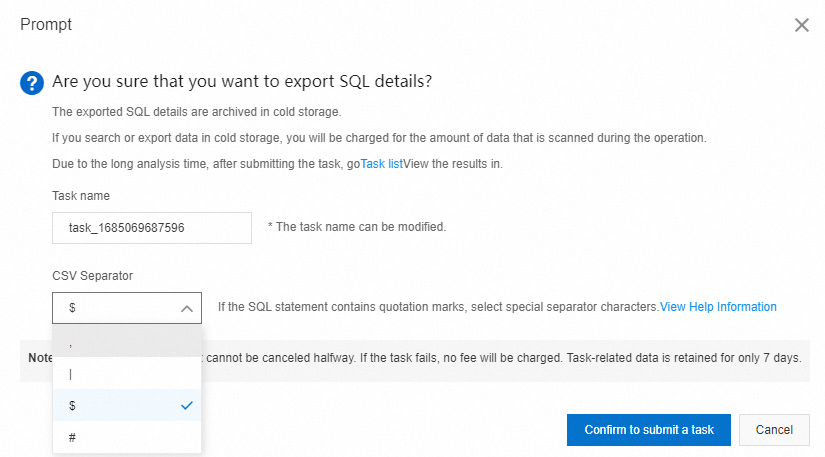
To export logs, click Export. In the Export SQL Records dialog box, configure the Exported Fields parameter. Configure the Export Time Range parameter to specify the time range during which you want to export SQL logs.
The CSV Separator module that uses a combination of hot storage and cold storage allows you to select a special character that is not contained in SQL logs as the column delimiter of the CSV file to be exported. This way, you can separate the columns of SQL logs in the exported CSV file. For more information, see the Configure and open a CSV file section of this topic.
ImportantYou can export up to 10 million data records within seven days at a time.
For the SQL Explorer and Audit module that uses a combination of hot storage and cold storage, the system creates a query or export task if you query or export data in cold storage. You can click Task list to view the task progress and historical tasks.
You can query and export only the data for which the audit log feature is enabled.

Configure and open a CSV file
Even if the SQL logs exported to a CSV file contain a delimiter, the exported data may still be displayed in one column after you open the CSV file by using tools such as Excel. To prevent this issue, you can select a column delimiter when you use the search feature of the CSV Separator module that uses a combination of hot storage and cold storage to export SQL logs to a CSV file. This section describes how to configure a CSV file to export data that can be displayed in multiple columns. In this example, Excel 2019 of the Windows operating system is used.
In the Prompt dialog box that appears after you create an export task, select a special character that is not contained in SQL logs as the column delimiter of the CSV file to be exported, such as
$.
Open the exported CSV file by using Excel.
Select the data that you want to display. In the top navigation bar, click Data. In the Data Tools section, click Text to Columns.
In the Original data type section in Step 1 of the Convert Text to Columns Wizard dialog box, select Delimited. Then, click Next.
In the Delimiters section, select Other and enter
$in the field. Then, click Next.In the Data preview section, you can preview the display effect.
In the Column data format section, select General. Then, click Finish.
FAQ
Related API operations
The following table describes the API operations that you can call to query the SQL logs of ApsaraDB RDS for MySQL instances, ApsaraDB RDS for PostgreSQL instances, or ApsaraDB RDS for SQL Server instances.
Operation | Description |
Queries the audit logs that are generated by the SQL Explorer (SQL Audit) feature for an ApsaraDB RDS instance. | |
Queries the log files that are generated by the SQL Explorer (SQL Audit) feature for an ApsaraDB RDS instance. |